- EasyCard
- Trade
- Help
- Announcement
- Academy
- SWIFT Code
- Iban Number
- Referral
- Customer Service
- Blog
- Creator
PCE vs CPI: Which Is the "True Inflation" You Should Pay Attention To? An Article to Understand the Differences Between the Two


Image Source: pexels
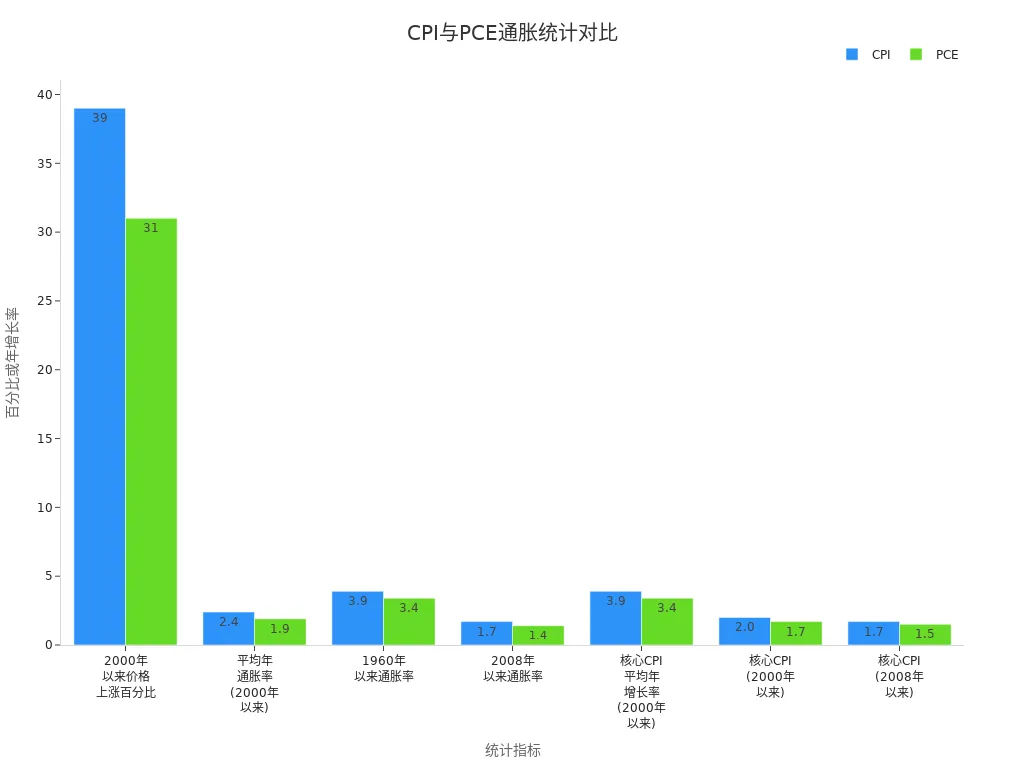
When tracking inflation, PCE better reflects the true changes in the U.S. economy compared to CPI. PCE covers a broader range, captures shifts in consumption patterns, and is the Federal Reserve’s primary basis for policy decisions. The table below shows that PCE inflation rates are generally lower than CPI over the long term, aligning more closely with reality:
| Indicator | CPI | PCE |
|---|---|---|
| Price Increase Since 2000 (%) | 39% | 31% |
| Average Annual Inflation Rate (Since 2000) | 2.4% | 1.9% |
If you’re an investor, PCE helps you adjust your portfolio in a timely manner. If you’re an average consumer, PCE also allows you to better gauge the actual impact of true inflation.
Key Highlights
- Focus on PCE over CPI, as PCE more comprehensively reflects actual U.S. consumer spending.
- PCE dynamically adjusts weights to capture consumer substitution behavior, avoiding overestimation of inflation.
- CPI is suitable for tracking everyday cost-of-living changes, while PCE is better for investors and policymakers.
- PCE’s calculation method is more accurate, reducing bias and providing a truer inflation level.
- Combining PCE and CPI offers a fuller understanding of price changes in the U.S. economy and personal life.
Which Is the True Inflation?

Image Source: unsplash
Direct Conclusion
When determining “true inflation,” you should prioritize PCE. PCE more comprehensively reflects the actual consumer spending of U.S. residents. The Federal Reserve also uses PCE as its core reference for monetary policy. PCE not only covers a broader range of goods and services but also dynamically adjusts weights to reflect changes in consumer behavior.
Economists widely agree that PCE’s chained index method reduces small-sample and substitution biases, yielding results closer to reality. If you only look at CPI, you may overestimate inflation pressures. Data from 2002 to 2018 shows that CPI’s average annual inflation rate was 2.1%, while PCE was only 1.8%. PCE’s calculation and weighting result in an inflation rate 0.6 percentage points lower than CPI, with 0.2% from formula effects and 0.4% from weighting effects.
Refer to the table below to understand the reliability of different inflation indicators:
| Indicator Type | Reliability Analysis |
|---|---|
| Trimmed Mean Inflation Estimate | Shows significant accuracy improvements in medium- to long-term PCE inflation forecasts, especially when price distributions are skewed. |
| Median PCE Inflation | Performs well when cross-sectional price changes are strongly skewed, particularly excluding OER inflation. |
| Core PCE Inflation | Performed strongly in late 2007 but has issues with long-term bias and volatility. |
You can see that PCE and its derived indicators perform better in predicting and reflecting “true inflation.”
Focus Areas
When tracking inflation, you should clarify your needs. If you’re concerned about Federal Reserve policy, investing in U.S. stocks, or dollar-based assets, PCE is your primary reference for “true inflation.” PCE captures consumer substitution behavior when prices change. For example, when milk prices rise, you might switch to soy milk or other substitutes, and PCE dynamically adjusts weights to reflect this. CPI, with fixed weights, cannot promptly reflect consumption structure changes, often overestimating inflation.
- PCE accounts for substitution effects, better reflecting actual prices paid.
- CPI, due to fixed weights, tends to overestimate inflation rates.
- PCE assigns a lower weight to housing costs than CPI, contributing to its lower inflation rate.
- Economists generally agree that PCE’s chained formula is more accurate, reducing bias.
If you’re focused on daily living costs, CPI more directly reflects price fluctuations in your shopping basket. However, for understanding the U.S. economy’s “true inflation,” PCE is more worthy of your attention. Nearly all economists in the price index field agree that chained indices like PCE are more accurate than fixed-basket Laspeyres indices like CPI. Although PCE includes some goods and services not directly tied to consumer welfare, it overall better reflects the economy’s true inflation level.
When investing, managing finances, or tracking U.S. economic trends, prioritize PCE and use CPI as a supplementary reference. This approach allows you to comprehensively grasp the actual changes in “true inflation.”
Definitions of PCE and CPI
Image Source: pexels
What Is CPI?
When learning about inflation, CPI (Consumer Price Index) is the most common measurement tool. CPI primarily reflects price changes in goods and services purchased by urban consumers. The U.S. Bureau of Labor Statistics (BLS) regularly surveys household spending to create a “market basket” that includes food, cars, rent, and other common goods and services. CPI is divided into food, energy, and other items, further categorized into durable and non-durable goods. You’ll notice that CPI’s weights and structure are periodically adjusted based on household expenditure surveys to adapt to changing consumption habits and new products.
CPI’s market basket is based on actual purchase data from thousands of households, covering over 200 item categories.
The BLS continuously reviews and updates CPI’s structure to ensure it reflects the latest consumption trends.
The table below summarizes CPI’s definition and characteristics:
| Indicator | CPI |
|---|---|
| Calculation Method | Uses Laspeyres formula |
| Included Goods | Only includes goods purchased by individual consumers |
| Data Source | Based on household expenditure surveys |
What Is PCE?
PCE (Personal Consumption Expenditures Price Index) is another key inflation indicator published by the U.S. Bureau of Economic Analysis. When tracking the overall U.S. economy, PCE more comprehensively reflects price changes in goods and services purchased by or on behalf of residents. PCE not only includes household direct consumption but also covers medical services paid by third parties like insurers. PCE uses the Fisher index, dynamically adjusting weights to better capture consumer substitution behavior in response to price changes.
- The PCE index includes all consumption expenditures by U.S. households on goods and services.
- It measures actual and imputed household expenditures, including durable and non-durable goods and services.
- PCE has a broader coverage, reflecting changes in consumer spending patterns.
| Index Name | Definition |
|---|---|
| PCE | Reflects price changes in goods and services purchased by or on behalf of U.S. residents, capturing inflation or deflation in broad consumer spending. |
| PCEPI | Tracks price changes in goods and services purchased in the economy, serving as a measure of U.S. inflation, covering the broadest range of goods and services. |
When judging true inflation, PCE better reflects the overall price changes in the U.S. economy, which is why the Federal Reserve uses PCE as its primary inflation reference.
Calculation Methods and Comparison
Calculation Methods
When understanding inflation indicators, you first need to grasp the calculation steps for CPI and PCE. Although both CPI (Consumer Price Index) and PCE (Personal Consumption Expenditures Price Index) measure price changes, their calculation methods differ significantly.
CPI Calculation Steps:
- Determine the total cost of the base-year market basket, which includes goods and services commonly purchased by U.S. urban consumers.
- Calculate the total cost of the same market basket in the current year.
- Use the CPI formula: CPI = (Current Year Cost / Base Year Cost) × 100. This gives you the CPI value.
PCE Calculation Steps:
- Calculate the total consumption expenditure of U.S. residents on all goods and services in a year, including household direct consumption and items paid by third parties (e.g., insurers).
- Use the PCE deflator formula: PCE Deflator = (Current Year Expenditure / Base Year Expenditure) × 100. This provides the PCE change.
You’ll notice that CPI focuses on price changes in a fixed market basket, while PCE tracks changes in all actual consumption expenditures.
Comparison Table
The table below helps you quickly understand the main differences between CPI and PCE in definition, calculation method, and weighting:
| Difference Category | CPI Description | PCE Description |
|---|---|---|
| Calculation Formula | Based on modified Laspeyres formula | Based on Fisher-Ideal formula |
| Weight Adjustment | Infrequent weight adjustments, reflecting urban consumer spending patterns | Dynamic weight adjustments, reflecting all residents’ consumption behavior |
| Coverage Scope | Measures only household out-of-pocket spending, high housing weight (~33%) | Includes household and nonprofit institution spending, lower housing weight (~15%) |
| Healthcare Spending | Includes only household out-of-pocket costs | Includes healthcare services paid by employers, government, etc. |
| Substitution Effect | Ignores substitution effect, fixed market basket | Fully accounts for substitution effect, weights adjust with consumption patterns |
PCE’s greatest advantage is its ability to reflect your real choices in response to price changes. When a certain type of good rises in price, you may opt for cheaper substitutes. PCE dynamically adjusts weights to capture this behavior. CPI, with fixed weights, often overestimates the pace of rising living costs. When focusing on true inflation, PCE more accurately reflects the actual cost-of-living pressures for U.S. residents.
- PCE’s frequent weight adjustments reflect consumption structure changes promptly.
- CPI is better suited for measuring urban residents’ daily living costs but reacts slowly to consumption pattern changes.
Main Differences
Coverage Scope
When comparing PCE and CPI, you should first focus on their coverage scope. CPI primarily reflects urban household out-of-pocket spending, including goods and services you directly purchase and the imputed rent costs for homeowners. PCE has a broader scope, covering not only all household consumption expenditures but also those of nonprofit institutions serving households. PCE also accounts for items paid on behalf of households, such as medical expenses covered by insurers or the government. The table below helps you quickly understand their coverage differences:
| Indicator | Coverage Scope |
|---|---|
| CPI | Focuses on urban household out-of-pocket spending, including directly purchased goods and services and imputed rent costs for homeowners. |
| PCE | Includes consumption expenditures by all households and nonprofit institutions serving them, covering direct and third-party expenditures, and broader non-market prices. |
You can see that PCE more comprehensively reflects the U.S. consumption structure, which is one reason the Federal Reserve prefers PCE as a reference for “true inflation.”
Weight Allocation
Weight allocation determines the influence of each good and service in the inflation index. When tracking CPI, you’ll notice its weights are updated only annually, making it slower to respond. PCE’s weights are adjusted monthly, more sensitively capturing changes in your consumption behavior. For example, when prices for a certain good rise, you may choose cheaper alternatives, and PCE promptly reflects this shift. CPI, with fixed weights, struggles to quickly reflect consumption pattern changes.
- PCE price index weights are updated monthly, making it more sensitive to consumer behavior changes.
- CPI weights are updated annually, reacting more slowly.
- PCE better captures consumption pattern shifts, such as when households opt for cheaper goods during price increases.
When comparing healthcare and housing costs, you’ll also see significant differences. CPI only accounts for your out-of-pocket medical expenses, with housing comprising up to 42% of its weight. PCE includes medical expenses paid by employers and the government, with housing weighted at only 22.6%. The table below shows their differences in healthcare and housing costs:
| Indicator | CPI | PCE |
|---|---|---|
| Healthcare Cost Proportion | 8.8% | 22.3% |
| Housing Cost Proportion | 42% | 22.6% |
| Included Costs | Only consumer out-of-pocket costs | Includes costs paid by employers and government |
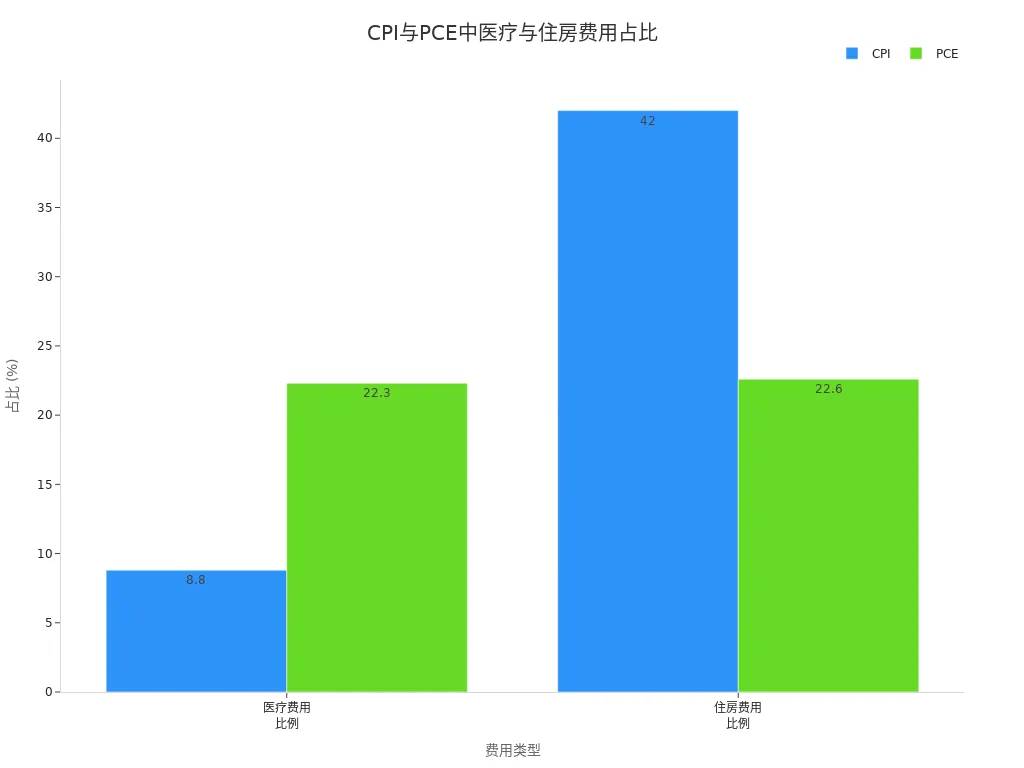
You can see that PCE’s weight allocation for healthcare and housing aligns more closely with the overall U.S. consumption structure.
Data Sources
When analyzing inflation data, the breadth and accuracy of data sources are critical. CPI is compiled by the U.S. Bureau of Labor Statistics (BLS), relying primarily on a basket of goods and services reflecting typical American purchasing habits. PCE is compiled by the Bureau of Economic Analysis, using broader data sources that include government and employer expenditure data. PCE is considered more accurate due to its integration of more data channels and varied weighting methods.
- CPI is compiled by the BLS, using a basket of goods and services reflecting typical American purchasing habits.
- PCE is compiled by the Bureau of Economic Analysis, incorporating government and employer expenditure data, making it more comprehensive.
- PCE is considered more accurate than CPI due to its broader data sources and different weighting methods.
When focusing on data update frequency, note their differences. CPI data is revised annually, with typically small revisions mainly from seasonal adjustments. PCE data undergoes more frequent and significant revisions, as statistical agencies incorporate new data sources, such as tax filings. PCE’s more frequent and substantial revisions help you stay updated on the latest U.S. economic changes.
Advantages, Disadvantages, and Applicable Scenarios
CPI Advantages and Disadvantages
When analyzing inflation, CPI has clear advantages. CPI is widely used, and many global economies adopt it for cross-time and cross-regional comparisons. You can use CPI to understand price changes across different years and regions. CPI is based on comprehensive price and expenditure surveys, with broad data sources ensuring a degree of accuracy. The BLS regularly updates CPI to help you stay informed about price and consumption behavior changes.
Note that CPI has limitations. CPI reflects an average level, which may not accurately represent your personal inflation experience. CPI sometimes struggles to fully account for improvements in goods and service quality. Different weighting schemes and statistical methods may also introduce biases.
- Advantages:
- Globally recognized, facilitating comparisons.
- Broad data sources, updated regularly.
- Disadvantages:
- Reflects only average levels, with significant individual variations.
- Quality changes are hard to capture.
- Statistical methods may introduce biases.
PCE Advantages and Disadvantages
When tracking PCE, you’ll find it better reflects the overall U.S. consumption structure. PCE dynamically adjusts weights to promptly capture consumption pattern changes. PCE also excludes volatile food and energy prices, helping you gain a clearer view of core inflation trends. The sustained rise in the core PCE price index allows you to detect inflation pressures early, providing a reference for monetary policy and investment decisions.
- Advantages:
- Dynamic weights reflect consumption behavior changes.
- Excludes volatile items, making core inflation trends clearer.
- Broad coverage, including third-party payment items.
- Disadvantages:
- Complex calculation method, harder for average consumers to understand.
- Frequent data revisions, with historical data subject to change.
In global economic and international capital flow analysis, PCE has greater authority. The Federal Reserve and international institutions prefer PCE to measure the U.S.’s true inflation level.
Applicable Scenarios
When choosing inflation indicators in different scenarios, combine your actual needs.
- If you’re an investor focused on Federal Reserve policy or dollar-based assets, PCE is more suitable as a decision-making basis. PCE reflects the true inflation pressures in the U.S. economy, helping you gauge interest rate trends and asset allocation. For example, licensed banks in Hong Kong often prioritize PCE data when assessing risks for dollar-based financial products.
- If you’re concerned about daily living costs, CPI more directly reflects price changes in your shopping basket, such as food, transportation, and housing prices.
- Policymakers reference CPI when setting social security or minimum wage policies, as it reflects ordinary households’ cost-of-living changes.
- In global economic and international capital flow analysis, PCE’s authority is higher. International investment institutions and multinational corporations use PCE to assess U.S. inflation trends and adjust global asset allocations.
When judging true inflation, combine PCE and CPI to comprehensively grasp price changes in the U.S. economy and personal life.
True Inflation Reference in Different Economic Environments
High Inflation Periods
During high inflation periods, prioritize PCE when tracking inflation indicators. PCE more quickly reflects changes in consumption behavior, especially during sharp price fluctuations. For instance, when food and energy prices surge, you may adjust your consumption structure by choosing cheaper substitutes. PCE’s monthly dynamic weight adjustments capture these shifts. CPI, with fixed weights, tends to overestimate the pace of rising living costs. The Federal Reserve, in high inflation environments, typically uses PCE as its primary reference for policies like rate hikes or asset purchase reductions. Refer to the table below for differences in Federal Reserve policy decisions under different indicators:
| Feature | CPI | PCE |
|---|---|---|
| Calculation Formula | Laspeyres formula | Fisher formula |
| Weight Method | Annual updates based on past two years’ consumption data | Monthly updates, dynamically reflecting consumption changes |
| Scope | Limited to urban consumer out-of-pocket costs | Includes urban and rural consumers and other expenditures |
| Seasonal Adjustment Method | More volatile adjustments, less frequent updates | Smoother adjustments, frequent updates with retrospective revisions |
When investing in U.S. stocks or dollar assets, tracking PCE helps you accurately gauge the Federal Reserve’s policy direction and adjust investment strategies promptly.
Stable Periods
In stable economic periods, the differences between CPI and PCE narrow. During these times, price fluctuations are smaller, and consumption structure changes are less pronounced. CPI more directly reflects changes in your daily living costs, such as food, transportation, and housing prices. PCE continues to provide the Federal Reserve with a reference for overall economic inflation. If you’re focused on personal living expenses, use CPI to understand price trends for specific items. If you’re tracking macroeconomic and policy changes, PCE remains the preferred choice. The Federal Reserve, in stable periods, combines PCE and CPI to ensure policies stabilize prices while addressing household needs.
When choosing inflation indicators in different economic environments, adjust flexibly based on your needs. In high inflation periods, PCE better reflects true inflation; in stable periods, both CPI and PCE have reference value.
After understanding the main differences between PCE and CPI, you can more effectively track “true inflation.”
- If you’re an investor, prioritize PCE, as the Federal Reserve uses PCE for its 2% inflation target, and policy adjustments are based on it.
- If you’re concerned about daily living costs, CPI helps you intuitively feel price changes.
Many investors still habitually track CPI, but the Federal Reserve prioritizes PCE, and the gap between the two has been widening in recent years. Choose reference indicators flexibly based on your needs.
FAQ
Which is more commonly used by the Federal Reserve, PCE or CPI?
When tracking Federal Reserve policy, know that the Fed primarily uses PCE as its inflation target. PCE more comprehensively reflects price changes in the U.S. economy.
Why do CPI and PCE inflation rates always differ?
You’ll notice that CPI and PCE differ in calculation methods, weights, and coverage. PCE dynamically adjusts weights, while CPI uses fixed weights, leading to frequent differences in inflation rates.
Which indicator should I track for price changes in daily life?
When focusing on daily shopping and living costs, CPI is more intuitive. CPI reflects price changes in your daily consumption basket and is easier to understand.
Is there a difference in the release timing of PCE and CPI data?
When checking data, you’ll find CPI is typically released mid-month, while PCE is released at the end of the month. PCE data may undergo revisions.
Which inflation indicator should I prioritize when investing in U.S. stocks?
When investing in U.S. stocks or dollar assets, prioritize PCE. The Fed’s reliance on PCE helps you gauge market trends.
Understanding PCE versus CPI equips you to pick the right inflation gauge for market trends, but high cross-border fees, currency volatility, and offshore account complexities can hinder acting on PCE-driven Fed policy shifts or seizing U.S. stock opportunities. Picture a platform with 0.5% remittance fees, same-day global transfers, and zero-fee contract limit orders, enabling seamless portfolio adjustments via one account?
BiyaPay is tailored for inflation-savvy investors, offering instant fiat-to-digital conversions to capitalize on PCE-triggered market moves. With real-time exchange rate query, track USD shifts and remit at optimal moments to cut costs. Covering most regions with instant arrivals, it powers quick positioning in inflation-sensitive assets like U.S. stocks or bonds. Standout: trade U.S. and Hong Kong markets through a single account, leveraging zero-fee contract limit orders for PCE-based limit strategies.
Whether aligning with Fed policy via PCE or tracking CPI for cost-of-living insights, BiyaPay fuels your edge. Sign up now, visit stocks for U.S. prospects—quick setup unlocks cost-effective, data-driven investing. Join global investors and turn inflation insights into tangible gains!
*This article is provided for general information purposes and does not constitute legal, tax or other professional advice from BiyaPay or its subsidiaries and its affiliates, and it is not intended as a substitute for obtaining advice from a financial advisor or any other professional.
We make no representations, warranties or warranties, express or implied, as to the accuracy, completeness or timeliness of the contents of this publication.


Contact Us
Company and Team
BiyaPay Products
Customer Services


is a broker-dealer registered with the U.S. Securities and Exchange Commission (SEC) (No.: 802-127417), member of the Financial Industry Regulatory Authority (FINRA) (CRD: 325027), member of the Securities Investor Protection Corporation (SIPC), and regulated by FINRA and SEC.
registered with the US Financial Crimes Enforcement Network (FinCEN), as a Money Services Business (MSB), registration number: 31000218637349, and regulated by FinCEN.
registered as Financial Service Provider (FSP number: FSP1007221) in New Zealand, and is a member of the Financial Dispute Resolution Scheme, a New Zealand independent dispute resolution service provider.