- EasyCard
- Trade
- Help
- Announcement
- Academy
- SWIFT Code
- Iban Number
- Referral
- Customer Service
- Blog
- Creator
Find your next potential stock with carrying value per share (BVPS)!


Image Source: pexels
When selecting stocks, you often want to know how much a company is truly worth. Book value per share is an important metric. You can use it to assess the true condition of a company’s assets. When you compare book value per share with the stock price, you will find a significant correlation between them. Many studies have also found that BVPS is highly correlated with stock prices and can even predict long-term returns. The following table shows the main findings of related studies:
| Research Content | Findings |
|---|---|
| Accounting Valuation and Market Expectations | BVPS is significantly correlated with stock prices and can serve as a predictive indicator for long-term stock returns. |
| Analyst-Based Valuation Models | Estimated fundamental value is highly correlated with stock prices, and the V/P ratio is a good predictor of long-term returns. |
By focusing on these data, you can better evaluate a company’s financial health, thereby enhancing your stock selection capabilities.
Key Points
- Book value per share (BVPS) is an important metric for assessing a company’s true value, reflecting the net asset value per share.
- Comparing BVPS with the current stock price can help determine if a stock is undervalued, identifying investment opportunities.
- When calculating BVPS, subtract preferred stock from shareholders’ equity and divide by the number of outstanding common shares to ensure data accuracy.
- Combine with other financial metrics, such as Altman Z-Score and Piotroski F-Score, to comprehensively assess a company’s financial health.
- Focus on industry benchmarks and select companies with a P/B ratio below the industry average, which may uncover undervalued potential stocks.
Definition of Book Value Per Share
Basic Concept of BVPS
When analyzing a company’s true value, you can use book value per share as an important reference. Book Value Per Share (BVPS) is the ratio of a company’s equity available to common shareholders to the number of outstanding shares. This figure represents the minimum value of a company’s equity and measures the book value per share. You can better understand the basic meaning of BVPS through the following points:
- Book value per share reflects the net asset value per share of a company.
- BVPS provides investors with intuitive data on the fundamental asset value of a company.
- You can use BVPS as a benchmark for company performance; an increase in BVPS over time indicates that the company is effectively managing its assets and liabilities.
When analyzing the U.S. market, it is common for company annual reports to directly disclose BVPS data, typically in USD. For example, if a publicly listed company discloses a BVPS of $25, it means the net asset value per share is 25 dollars.
BVPS and Company Value
When making investment decisions, you can compare book value per share with the company’s market value and stock price. Comparing BVPS with market price helps you determine whether a stock is undervalued or overvalued. Value investors often use BVPS to find stocks trading below their intrinsic value. You can also observe the relationship between BVPS and a company’s market capitalization. The following table summarizes the findings of related studies:
| Research Content | Conclusion |
|---|---|
| Relationship Between Financial Performance and Market Capitalization | Some studies established a positive correlation. |
| Connection Between Corporate Performance and Market Capitalization | A few analytical studies emphasized a close connection between the two. |
When conducting practical analysis, you will find that the relationship between BVPS, market capitalization, and stock price helps you more comprehensively assess a company’s financial health. By combining BVPS with other metrics, you can enhance your investment judgment.
Calculation of Book Value Per Share

Image Source: unsplash
Calculation Formula
When analyzing a company, you first need to master the standard method for calculating book value per share. The formula recommended by U.S. financial regulators is as follows:
| Formula | Description |
|---|---|
| BVPS = (Shareholders’ Equity - Preferred Stock) ÷ Weighted Average Number of Common Shares Outstanding | The standard formula for calculating book value per share. |
You can see that this formula subtracts preferred stock from total shareholders’ equity and divides by the weighted average number of outstanding common shares. This way, you can obtain the net asset value represented by each common share.
Calculation Example
You can understand the practical application through a simple example. Suppose a U.S. listed company discloses in its latest financial report that shareholders’ equity is 5,000,000 USD, preferred stock is 500,000 USD, and the weighted average number of outstanding common shares is 200,000. You can calculate using the formula:
BVPS = (5,000,000 - 500,000) ÷ 200,000 = 22.5 USD
This means the book value per share is 22.5 dollars.
When obtaining these data, you can refer to the following common sources:
- Company’s Balance Sheet
- Share Records
- Annual Reports or Quarterly Financial Statements
The U.S. Securities and Exchange Commission (SEC) has clear requirements for companies to disclose book value per share. You can find relevant information in the company’s financial reports. The following table summarizes the main disclosure requirements:
| Regulation | Content |
|---|---|
| SEC Regulation S-K, Item 506 | Requires registrants to disclose the net tangible book value per share before and after distribution in certain initial public offerings. |
| SEC Regulation M-A, Item 1010(a)(4) | Requires disclosure of book value per share as of the most recent balance sheet date. |
| ASC 260-10 | Allows disclosure of additional per-share data, including book value per share, in the notes to financial statements. |
When performing calculations, you must verify the authority of the data sources to ensure the accuracy of the results.
Application of BVPS in Stock Selection
BVPS vs. Stock Price Comparison
When selecting stocks, you can directly compare book value per share with the current stock price. This method helps you determine whether a stock is undervalued. Typically, you can calculate the “price-to-book ratio” (P/B Ratio), which is the stock price divided by the book value per share. If the P/B ratio is below the industry average, it indicates that the market may be undervaluing the company, potentially presenting an undervaluation opportunity.
For example, a U.S. listed company has a book value per share of 22.5 USD and a current stock price of 30 USD. You can calculate the P/B ratio:
P/B = 30 ÷ 22.5 = 1.33
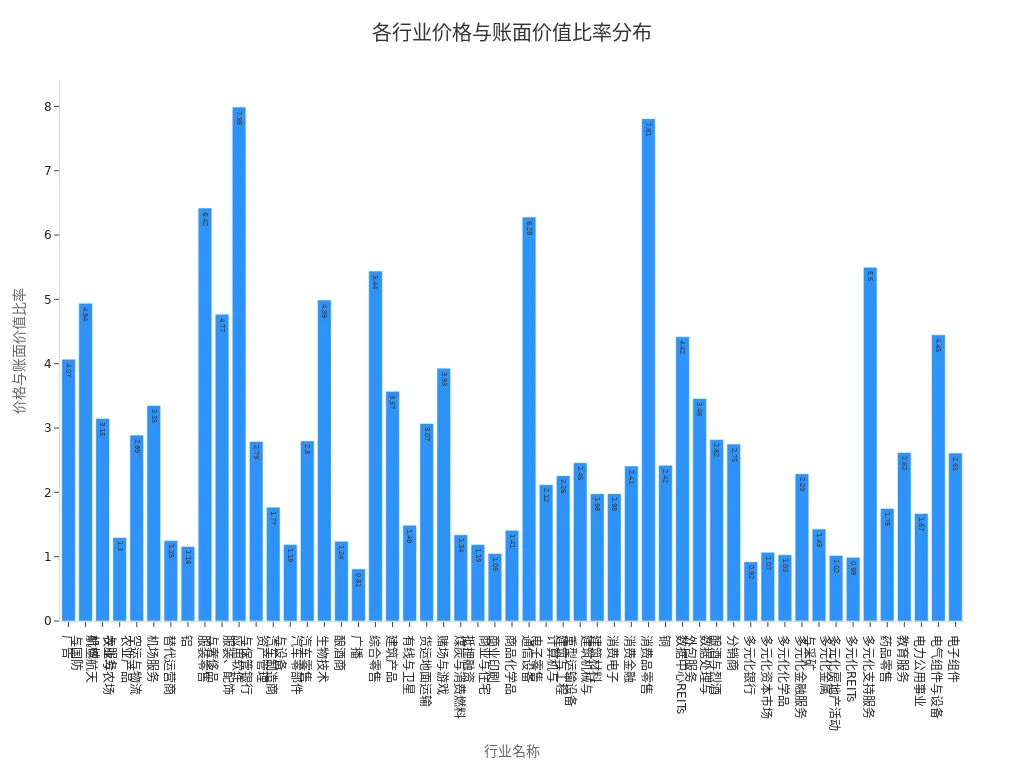
You can compare this ratio with the industry average. The following table shows the price-to-book ratios for various industries:
| Industry Name | Price-to-Book Ratio |
|---|---|
| Advertising | 4.07 |
| Aerospace & Defense | 4.94 |
| Agricultural & Farm Machinery | 3.15 |
| Agricultural Products & Services | 1.30 |
| Apparel Retail | 6.42 |
| Application Software | 7.99 |
| Auto Manufacturers | 1.77 |
| Biotechnology | 4.99 |
| General Retail | 5.44 |
| Building Products | 3.57 |
| Communication Equipment | 6.28 |
| Diversified Banks | 0.92 |
| Diversified REITs | 0.99 |
You can see that P/B ratios vary significantly across industries. When analyzing, you should prioritize companies with P/B ratios below the industry average, as these companies are more likely to be undervalued by the market.
Industry Benchmarks
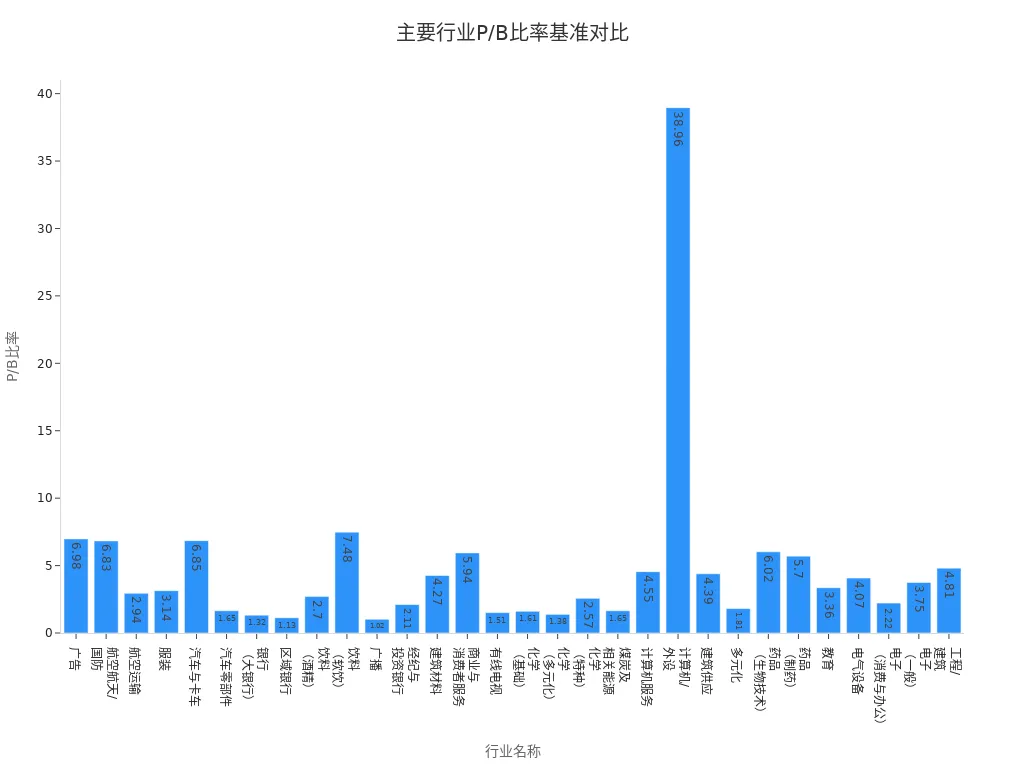
In practice, you cannot rely solely on a single company’s P/B ratio. You also need to consider industry benchmarks. Different industries have varying asset structures and profit models, leading to different reasonable ranges for book value per share and P/B ratios. The following table shows P/B ratios, ROE, and other metrics for major industries:
| Industry Name | Number of Companies | P/B Ratio | ROE | EV/Invested Capital | ROIC |
|---|---|---|---|---|---|
| Advertising | 54 | 6.98 | 11.85% | 8.29 | 34.91% |
| Aerospace/Defense | 67 | 6.83 | 11.94% | 5.38 | 14.03% |
| Air Transport | 24 | 2.94 | 13.27% | 1.78 | 8.48% |
| Apparel | 37 | 3.14 | 8.47% | 2.47 | 15.26% |
| Auto & Truck | 34 | 6.85 | 9.27% | 3.11 | 3.15% |
| Auto Parts | 33 | 1.65 | 7.09% | 1.33 | 8.66% |
| Banks (Large) | 15 | 1.32 | 11.52% | 1.23 | N/A |
| Regional Banks | 591 | 1.13 | 6.80% | 1.31 | N/A |
| Beverages (Alcoholic) | 18 | 2.70 | 9.49% | 2.68 | 17.86% |
| Broadcasting | 22 | 1.02 | -9.12% | 1.49 | 12.68% |
| Building Materials | 39 | 4.27 | 27.36% | 4.74 | 26.84% |
| Drugs (Biotechnology) | 535 | 6.02 | -14.12% | 2.52 | 3.08% |
| Drugs (Pharmaceutical) | 231 | 5.70 | 10.49% | 3.11 | 14.08% |
| Education | 29 | 3.36 | 4.22% | 3.70 | 11.86% |
| Electrical Equipment | 101 | 4.07 | 4.78% | 4.72 | 12.23% |
Through these data, you can determine a company’s position within its industry. If a company’s P/B ratio is significantly below the industry average while showing strong performance in metrics like ROE, it may have high investment value.
Tip: When analyzing, you should prioritize comparing with industries that have similar business structures to the target company. This helps avoid misjudgments due to industry differences.
Combining Other Metrics
When using book value per share to screen potential stocks, you cannot rely solely on a single metric. You also need to combine other financial metrics to comprehensively evaluate a company’s financial health. Common complementary metrics include:
- Altman Z-Score: You can use it to assess a company’s bankruptcy risk; a higher score indicates greater financial stability.
- Piotroski F-Score: You can use nine financial factors to determine whether a company’s fundamentals are improving.
- Beneish M-Score: You can use it to detect the possibility of earnings manipulation by a company.
When selecting stocks, you can follow these steps:
- First, screen companies with P/B ratios below the industry average.
- Then, use metrics like Altman Z-Score and Piotroski F-Score to eliminate companies with poor financial health or risks.
- Finally, consider factors such as profitability and growth potential to comprehensively assess investment value.
Note: Book value per share is only a starting point for stock selection. You need to combine multiple metrics to more accurately identify true potential stocks.
Practical Application and Case Studies

Image Source: pexels
Stock Selection Process
When selecting stocks, you can follow these steps to efficiently screen potential stocks:
- Collect company financial data. You can obtain information such as shareholders’ equity, preferred stock, and the number of outstanding common shares from the company’s annual report, quarterly financial statements, or the U.S. Securities and Exchange Commission (SEC) website.
- Calculate book value per share. Use the formula
(Shareholders' Equity - Preferred Stock) ÷ Weighted Average Number of Common Shares Outstandingto obtain the net asset value per share. - Compare with current market price. Compare book value per share with the company’s current stock price to identify undervalued or overvalued stocks.
- Track changes in BVPS. Observe the growth trend of book value per share to assess the company’s asset management and financial health.
- Combine other valuation metrics. Refer to metrics like P/B ratio, debt-to-equity ratio, and profitability for a more comprehensive investment analysis.
- Screen financially sound and reasonably valued companies as potential stock candidates.
Tip: During the screening process, prioritize companies with consistently growing BVPS and P/B ratios below the industry average, as these are more likely to be undervalued by the market.
Considerations
When using book value per share for stock selection, you need to be aware of the following common pitfalls and limitations:
- Companies may manipulate BVPS through creative accounting practices. For example, undervaluing assets or overvaluing liabilities can inflate BVPS, potentially misleading investors.
- BVPS does not account for a company’s debt. You need to pay attention to the debt-to-equity ratio to avoid companies with high BVPS but high debt risks.
- BVPS only reflects tangible assets, excluding intangible assets like patents, trademarks, and goodwill. You need to be cautious when analyzing tech or brand-driven companies.
- BVPS is based on the historical cost of assets and does not account for inflation or market value changes. The book value of some assets may be significantly lower than their actual market value.
- BVPS cannot reflect future growth potential. When evaluating growth companies, you need to consider factors like R&D investment and innovation capabilities.
- The relationship between market price and BVPS affects the reliability of BVPS. When a company repurchases stock, if the market price is below BVPS, BVPS will increase after the repurchase; otherwise, it will decrease.
In practice, you cannot rely solely on a single metric. Comprehensive analysis is essential to effectively mitigate risks and improve stock selection success rates.
Case Study Analysis
You can better understand the practical impact of BVPS in stock selection through real-world cases:
- In 2012, Berkshire Hathaway invested in Coca-Cola. You will find that Coca-Cola’s book value per share was consistently growing at the time, with stable cash flow, ultimately delivering long-term returns.
- During the 2011 Fukushima disaster, Toyota’s book value per share remained stable. If you focused on BVPS, you could have identified Toyota’s strong risk resistance, with its stock price rebounding after the disaster.
- During market volatility, a U.S. bank saw continuous BVPS growth. By analyzing its debt-to-equity ratio, you would find its debt level reasonable, and its stock price steadily rose.
- A tech company had a low book value but significant R&D investment. If you only looked at BVPS, you might miss its future growth potential. By combining innovation capabilities and industry prospects, you can more comprehensively assess its investment value.
When selecting stocks, it is recommended to combine industry characteristics, company financial structure, and market environment to flexibly use book value per share, enhancing the scientific basis of investment decisions.
When selecting stocks, you can use book value per share as an important reference. The following table summarizes the key points of the P/B ratio:
| Metric | Description |
|---|---|
| P/B Ratio | The ratio of market value to book value, revealing the net asset value of a company. |
| Formula | P/B Ratio = Market Price Per Share ÷ Book Value Per Share |
| Importance | Particularly useful for asset-heavy industries (e.g., banking, real estate). A P/B below 1 may indicate a bargain. |
You should also note the following limitations:
- BVPS cannot account for future growth potential.
- It does not include brand value.
- It overlooks market sentiment.
You can combine metrics like P/B ratio and return on equity, regularly updating your analysis (e.g., quarterly) to continually refine your stock selection system.
FAQ
What is Book Value Per Share (BVPS)?
You can understand book value per share as the net assets represented by each common share of a company. It reflects the actual value per share after subtracting liabilities from assets.
What is the relationship between BVPS and stock price?
You can compare BVPS with the stock price to determine whether a stock is undervalued. If the stock price is below BVPS, it suggests the market may be undervaluing the company.
Which industries is BVPS suitable for analyzing?
When analyzing asset-heavy industries, such as banking, insurance, and real estate, you can prioritize BVPS. For light-asset industries like technology, BVPS has less reference value.
Where can BVPS data be obtained?
You can find relevant data in a company’s annual report, quarterly financial statements, or on the U.S. Securities and Exchange Commission (SEC) website. Companies typically disclose detailed financial information.
Is BVPS alone reliable for stock selection?
You cannot rely solely on BVPS. You also need to combine metrics like profitability and debt levels to comprehensively analyze a company’s financial health for more scientific investment decisions.
Book Value Per Share (BVPS) is a cornerstone of value investing, offering a clear metric to gauge a company’s net asset worth on a per-share basis. Identifying a stock where the P/B ratio is low while BVPS is robustly increasing points toward a potentially undervalued opportunity. To successfully capitalize on this insight, especially across global markets like the US and Hong Kong, you need a trading platform that offers both speed and cost efficiency.
To ensure your BVPS-driven value strategy is executed without the drag of high costs or slow funding, integrate the financial agility of BiyaPay. We offer zero commission for contract limit orders, a crucial advantage that minimizes the transaction costs associated with building and maintaining a diversified portfolio of value stocks. Moreover, our platform supports the swift, mutual conversion between fiat and digital assets like USDT, providing you with the fastest, most reliable pathway to fund your brokerage accounts and seize time-sensitive global opportunities. You can register quickly—in just 3 minutes without requiring an overseas bank account—and gain immediate access to US and Hong Kong Stocks. Leverage our real-time exchange rate checks to maintain transparent control over your funding costs. Open your BiyaPay account today and translate your BVPS analysis into profitable global value investments.
*This article is provided for general information purposes and does not constitute legal, tax or other professional advice from BiyaPay or its subsidiaries and its affiliates, and it is not intended as a substitute for obtaining advice from a financial advisor or any other professional.
We make no representations, warranties or warranties, express or implied, as to the accuracy, completeness or timeliness of the contents of this publication.


Contact Us
Company and Team
BiyaPay Products
Customer Services


is a broker-dealer registered with the U.S. Securities and Exchange Commission (SEC) (No.: 802-127417), member of the Financial Industry Regulatory Authority (FINRA) (CRD: 325027), member of the Securities Investor Protection Corporation (SIPC), and regulated by FINRA and SEC.
registered with the US Financial Crimes Enforcement Network (FinCEN), as a Money Services Business (MSB), registration number: 31000218637349, and regulated by FinCEN.
registered as Financial Service Provider (FSP number: FSP1007221) in New Zealand, and is a member of the Financial Dispute Resolution Scheme, a New Zealand independent dispute resolution service provider.