- EasyCard
- Trade
- Help
- Announcement
- Academy
- SWIFT Code
- Iban Number
- Referral
- Customer Service
- Blog
- Creator
What do Tapes A, B, and C in the NYSE mean? Exploring the Different Trading Tapes of the World's Largest Stock Exchange


Image Source: unsplash
Tape A represents large companies’ stocks listed on the New York Stock Exchange, Tape B covers stocks from other U.S. regional exchanges such as NYSE Arca and NYSE American, and Tape C specifically refers to Nasdaq-listed stocks. The division of Tapes A, B, and C helps investors clearly identify the source of market data from different trading regions. Recent industry data shows that the latency of market and trading data for Tapes A/B and Tape C has significantly decreased, allowing investors to access real-time information more quickly.
Key Points
- Tapes A, B, and C represent stocks from different exchanges. Tape A covers blue-chip stocks listed on the New York Stock Exchange, Tape B includes stocks from regional exchanges, and Tape C focuses on Nasdaq’s technology stocks.
- Understanding the division of Tapes A, B, and C helps investors quickly obtain the required market data, improving the efficiency of trading decisions.
- Tape A stocks typically have high liquidity, suitable for long-term investments; Tape C’s technology stocks are highly volatile, more suited for short-term trading.
- Investors should select appropriate data services based on the types of stocks they focus on to optimize their investment portfolios and trading strategies.
- By effectively utilizing the data from Tapes A, B, and C, investors can better seize market opportunities and enhance investment returns.
What Are Tapes A, B, and C?

Image Source: unsplash
The New York Stock Exchange (NYSE) uses Tapes A, B, and C to categorize market data. This classification system helps market participants quickly identify the types of stocks and the sources of data from different trading regions. Each tape represents specific stock categories and exchanges, forming the foundational structure for data transmission in the U.S. securities market.
Tape A Definition
Tape A primarily refers to stocks listed on the New York Stock Exchange LLC. Tape A is responsible for transmitting the primary trading and quote data for these stocks, including the last sale price, trading volume, and other core information.
Tape A holds a representative position in the U.S. capital market, covering many large blue-chip companies.
The table below summarizes the official definition of Tape A and its related exchanges:
| Tape | Definition |
|---|---|
| Tape A | Primary trading and quote data, including last sale price, trading volume, and other information. |
| Exchange/Region Name | Notes |
|---|---|
| New York Stock Exchange LLC | Manages Network A |
The existence of Tape A ensures that investors can promptly obtain real-time market and transaction information for NYSE-listed stocks.
Tape B Definition
Tape B covers stocks listed on other major U.S. exchanges, particularly regional exchanges such as NYSE Arca, NYSE American, and BATS. Tape B not only provides basic trading data but also includes more in-depth order book information, such as bid and ask prices and quantities.
Tape B brings richer liquidity and diverse trading options to the market.
The table below provides the official definition of Tape B:
| Tape | Definition |
|---|---|
| Tape B | Provides in-depth order book data, including bid and ask prices and quantities. |
The primary exchanges involved in Tape B include NYSE Arca, NYSE American, BATS BZX, BATS BYX, and IEX. These exchanges collectively enhance the trading activity of Tape B stocks.
Tape C Definition
Tape C specifically covers stocks listed on the Nasdaq Stock Market LLC. Tape C is responsible for transmitting real-time trading and quote data for the Nasdaq market, covering numerous technology giants and growth-oriented companies.
Tape C provides investors with market information on the U.S. technology sector and emerging companies.
The table below provides the official definition of Tape C:
| Tape | Definition |
|---|---|
| Tape C | Covers securities listed on regional and other exchanges, providing real-time trading and quote data. |
The existence of Tape C enables investors to stay informed about the market dynamics of Nasdaq-listed stocks in a timely manner.
The Role of Tapes A, B, and C in the NYSE Market Structure
Tapes A, B, and C collectively form the data transmission system of the U.S. securities market. They each handle data distribution tasks for different exchanges and stock types, ensuring efficient circulation of market information.
- Tape A: Covers all stocks listed on the New York Stock Exchange, representing the trading venues for all Tape A stocks.
- Tape B: Includes regional exchanges such as BATS, NYSE American, ARCA, and IEX, primarily covering stocks in the NYSE market.
- Tape C: Covers all Nasdaq-listed stocks, including some of the largest companies and emerging growth stocks.
Through the division of Tapes A, B, and C, investors can more targetedly access the required market data. This structure enhances market transparency, helping investors make more informed decisions.
Differences Between NYSE Tapes A, B, and C
Stock Types
Tapes A, B, and C each cover different types of stocks. Tape A mainly includes blue-chip stocks listed on the New York Stock Exchange (NYSE), such as General Electric (GE) and IBM. These companies typically have large market capitalizations, representing the core strength of traditional U.S. industries. Tape B covers stocks listed on the American Stock Exchange (AMEX) and other regional exchanges, such as American International Group (AIG) and Royal Gold (RGLD). This category includes a more diverse range of stock types, encompassing both mid-sized enterprises and some growth-oriented companies. Tape C focuses on Nasdaq-listed stocks, representing emerging companies primarily in the technology sector, such as Apple (AAPL) and Microsoft (MSFT).
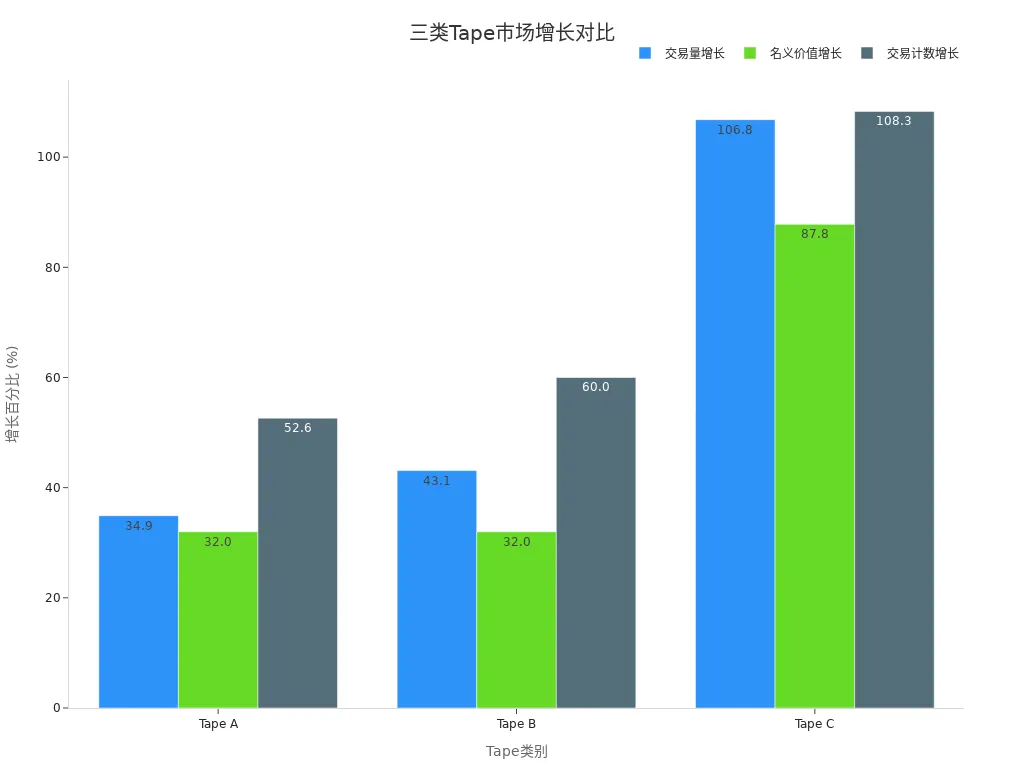
A comparison reveals that Tape C’s technology growth stocks have shown the most significant growth in trading volume and notional value in recent years. According to financial analysts’ data, Tape C’s trading volume grew by 106.8%, notional value by 87.8%, and trade count by 108.3%. Tape A and Tape B showed relatively smaller growth, but Tape B achieved a 60% increase in trade count.
| Tape | Trading Volume Growth | Notional Value Growth | Trade Count Growth |
|---|---|---|---|
| Tape A | +34.9% | +32.0% | +52.6% |
| Tape B | +43.1% | +32.0% | +60.0% |
| Tape C | +106.8% | +87.8% | +108.3% |
Exchange Distribution
The stocks of the three tapes are distributed across different exchanges. Tape A is managed by the New York Stock Exchange, Tape B is overseen by regional exchanges such as BATS, NYSE American, ARCA, and IEX, while Tape C is entirely managed by the Nasdaq market.
This distribution structure ensures that trading data for different types of stocks can be transmitted efficiently, meeting diverse market demands.
| Tape | Responsible Exchanges |
|---|---|
| A | NYSE-listed stocks |
| B | Regional exchanges (e.g., BATS, NYSE American, ARCA, IEX) |
| C | Nasdaq-listed stocks |
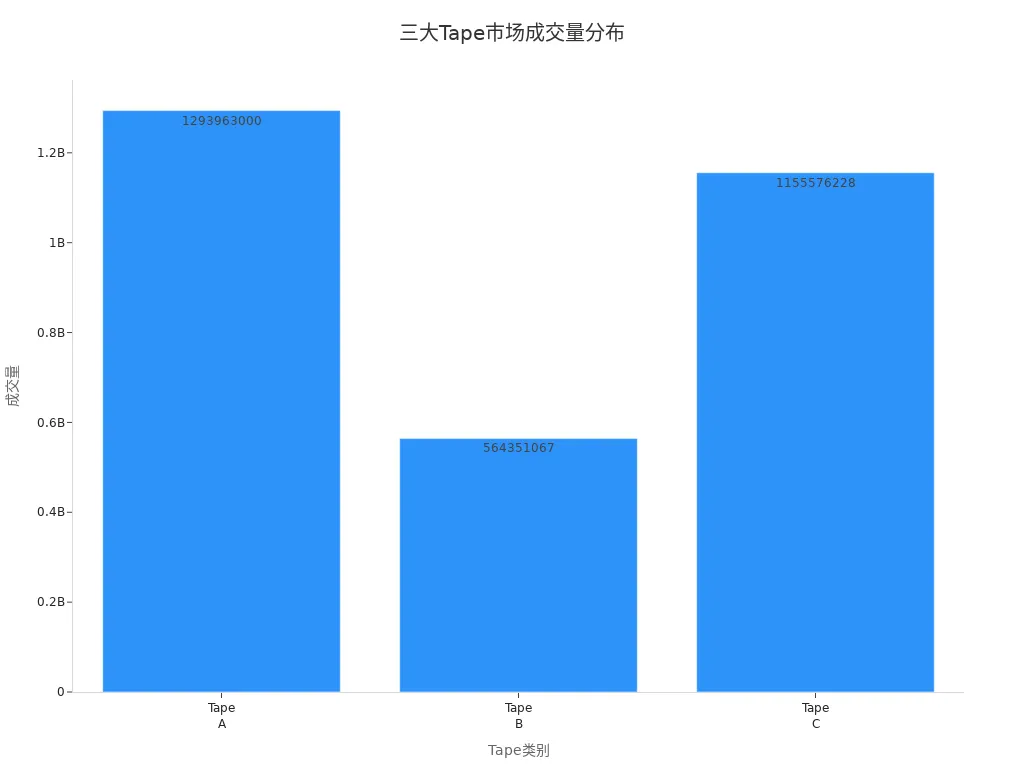
In terms of market trading volume, both Tape A and Tape C have trading volumes exceeding 1 billion shares, while Tape B has a relatively lower volume but still holds a significant position in the U.S. market.
| Tape | Matched Volume |
|---|---|
| Tape A | 1,293,963,000 |
| Tape B | 564,351,067 |
| Tape C | 1,155,576,228 |
Trading Structure
Tapes A, B, and C also differ significantly in their trading structures and data transmission mechanisms. Tapes A and B are regulated by the Consolidated Tape Association (CTA) Plan, while Tape C is regulated by the Unlisted Trading Privileges (UTP) Plan. Tape A focuses on consolidated trading information for NYSE-listed securities, Tape B covers AMEX and regional exchange-listed securities, and Tape C focuses on Nasdaq-listed securities.
| Aspect | Tape A | Tape B | Tape C |
|---|---|---|---|
| Definition | Consolidated trading information for New York Stock Exchange (NYSE)-listed securities. | Consolidated trading information for American Stock Exchange (AMEX) and regional exchange-listed securities. | Consolidated trading information for Nasdaq Stock Market-listed securities. |
| Coverage | Includes all trading and quote data for NYSE-listed securities across all exchanges. | Includes all trading and quote data for AMEX and regional exchange-listed securities. | Includes all trading and quote data for Nasdaq-listed securities. |
| Traded Securities | NYSE-listed stocks and securities. | AMEX-listed and regional exchange-listed stocks and securities. | Nasdaq-listed stocks and securities. |
| Data Provided | Real-time trading and quote information for NYSE-listed securities. | Real-time trading and quote information for AMEX and regional exchange-listed securities. | Real-time trading and quote information for Nasdaq-listed securities. |
| Market Participants | Primarily NYSE, but includes other exchanges trading NYSE-listed securities. | Primarily AMEX and regional exchanges, but includes other exchanges trading these securities. | Primarily Nasdaq, but includes other exchanges trading Nasdaq-listed securities. |
| Regulation | Managed under the SEC-regulated Consolidated Tape Association (CTA) Plan. | Managed under the SEC-regulated Consolidated Tape Association (CTA) Plan. | Managed under the SEC-regulated Unlisted Trading Privileges (UTP) Plan. |
| Purpose | Provides comprehensive market data for NYSE-listed securities. | Provides comprehensive market data for AMEX and regional exchange-listed securities. | Provides comprehensive market data for Nasdaq-listed securities. |
| Examples | General Electric (GE), IBM (IBM) | American International Group (AIG), Royal Gold (RGLD) | Apple (AAPL), Microsoft (MSFT) |
This structural design enables Tapes A, B, and C to meet the trading and data needs of different stock types, enhancing the transparency and efficiency of the U.S. securities market.
Tape A Details
Covered Stocks
Tape A primarily covers stocks listed on the New York Stock Exchange (NYSE). These stocks typically belong to large U.S. companies with broad industry representation, including energy, finance, healthcare, and consumer goods. Many well-known blue-chip stocks fall under Tape A. For example, companies like General Electric (GE), Coca-Cola (KO), and JPMorgan Chase (JPM) are traded under Tape A. Tape A stocks generally have high liquidity and large trading volumes, providing investors with ample buying and selling opportunities across multiple trading sessions.
The characteristics of Tape A stocks include:
- Primarily large listed companies with high market capitalization and strong industry representation
- High trading activity with narrow bid-ask spreads
- Widely followed by U.S. and global investors
Tape A stocks are often considered core components of asset allocation by institutional investors and fund managers. These stocks have relatively stable price movements, making them suitable for long-term holding and value investment strategies.
Data Sources
Tape A’s trading and quote data are provided by multiple authoritative channels. The New York Stock Exchange distributes real-time market data for Tape A stocks through an efficient data transmission system. The main data sources include:
- Consolidated Tape Association (CTA): Responsible for consolidating and distributing Tape A’s trading and quote data, ensuring accurate and timely information.
- Securities Information Processor (SIP): Acts as a data processing hub, aggregating and standardizing Tape A data from various exchanges for unified investor access.
- NYSE National, Inc. and other regional exchanges: These exchanges also generate some trading data for Tape A stocks, which is ultimately consolidated through CTA and SIP.
Investors can access key information such as the latest transaction prices, order book depth, and trading volume for Tape A stocks through these channels. The data transmission process adheres to the regulatory standards of the U.S. Securities and Exchange Commission (SEC), ensuring market transparency and fairness. Tape A’s data services provide investors with a basis for decision-making, helping them grasp market dynamics and optimize trading strategies.
Tape B Details
Covered Stocks
Tape B primarily covers stocks listed on U.S. regional exchanges. These stocks are diverse, including both mid-sized enterprises and some growth-oriented companies. Tape B stocks are typically not listed on the NYSE or Nasdaq main boards. Many companies in industries such as energy, mining, financial services, and emerging sectors choose to list on these regional exchanges.
The liquidity of Tape B stocks varies; some stocks have active trading, while others have limited trading volume. Investors selecting Tape B stocks should pay attention to their industry background and market performance.
The main characteristics of Tape B stocks include:
- Broad industry representation, covering energy, technology, healthcare, finance, and other sectors
- Wide range of market capitalizations, including both mid-sized enterprises and smaller growth companies
- Trading activity varies by company and industry
The table below shows common types of Tape B stocks:
| Stock Type | Industry Examples | Representative Companies (Ticker) |
|---|---|---|
| Energy | Oil, Natural Gas | Hess Corporation (HES) |
| Financial Services | Insurance, Asset Management | American International Group (AIG) |
| Emerging Technology | Software, Hardware | Coupa Software (COUP) |
| Precious Metals and Mining | Gold, Silver Mining | Royal Gold (RGLD) |
Primary Exchanges
Tape B’s data primarily comes from U.S. regional exchanges. These exchanges provide trading platforms and market data for Tape B stocks.
The core exchanges involved in Tape B include:
- NYSE Arca: Primarily electronic trading, covering ETFs and various stocks
- NYSE American: Focuses on small and growth-oriented companies
- BATS BZX and BATS BYX: Provide efficient stock trading services
- IEX (Investors Exchange): Operates with a “fair trading” philosophy, attracting diverse companies for listing
These exchanges collectively enhance the market activity of Tape B stocks. Tape B’s market structure provides investors with more options and improves the overall liquidity of the U.S. securities market.
Investors can access real-time market and transaction data through Tape B-related exchanges. Tape B’s diverse trading environment helps meet the needs of different investors.
Tape C Details
Covered Stocks
Tape C primarily covers stocks listed on the Nasdaq Stock Market LLC. The stocks under this tape are predominantly technology and innovation-driven companies, with many globally recognized high-growth firms listed on Nasdaq. For example, companies like Apple (AAPL), Microsoft (MSFT), and Amazon (AMZN) fall under Tape C. Tape C also includes a large number of small and mid-sized technology companies and representatives of emerging industries.
The Nasdaq market has a vast number of stocks, with Tape C covering over 3,000 stocks, including equities and ETFs across various asset classes. These stocks typically have high liquidity and significant market attention. Tape C’s stocks are actively traded with notable price volatility, attracting both institutional and individual investors.
Tape C provides investors with a rich selection, particularly suitable for those focused on technological innovation and growth potential. Nasdaq-listed companies hold a significant position in the U.S. economic structure, and Tape C’s data serves as a critical foundation for market analysis and investment decisions.
Trading Environment
Tape C’s trading environment is highly electronic, relying on advanced data transmission and processing systems. The Nasdaq market employs a unified quote and trading data distribution mechanism to ensure transparency and efficiency in market information.
The table below summarizes the main data services and characteristics of Tape C’s trading environment:
| Data Type | Description |
|---|---|
| UTP Quotation Data Feed (UQDF) | Aggregates the best bid and ask quotes from UTP participants, providing the national best bid and offer for Nasdaq securities. |
| UTP Trade Data Feed (UTDF) | Provides trading data for Nasdaq securities from UTP participants. |
| Data Services | Supports real-time, delayed, historical, market replay, and aggregated data services. |
| Coverage | Covers over 3,000 Nasdaq-listed stocks, including equities and ETFs. |
| Region | U.S. market. |
Nasdaq’s Tape C trading platform is renowned for its speed and transparency. Market participants can access real-time and historical data through UTP data services to meet various investment needs. Tape C’s trading environment supports diverse trading strategies, including high-frequency trading and quantitative investing. Tape C’s efficient data distribution system provides investors with comprehensive and timely market information, enhancing the overall competitiveness of the U.S. securities market.
Impact on Investors
Market Data Access
When trading in the U.S. stock market, investors first need to access accurate market data. The division of Tapes A, B, and C provides investors with clear data sources. Each tape corresponds to stocks from different exchanges, allowing investors to select appropriate data services based on the types of stocks they focus on. For example, investors focusing on NYSE-listed blue-chip stocks typically prioritize subscribing to Tape A data feeds. Those focusing on technology growth stocks prefer Tape C data.
U.S. market data is primarily distributed through Securities Information Processors (SIPs) and data terminals provided by major exchanges. Investors can access real-time or delayed market data through brokerage platforms, financial terminals, or professional data providers. Some high-frequency traders and institutional investors opt for direct access to raw data sources to achieve lower latency.
The timeliness and accuracy of market data directly impact investors’ trading experiences. Investors should select data service types and access methods based on their needs and trading strategies.
Investment Decisions
When formulating investment strategies, investors need to fully understand the market structure of Tapes A, B, and C. The stock types, liquidity, and volatility covered by each tape vary. For example, Tape A’s blue-chip stocks have lower volatility, making them suitable for long-term holding. Tape C’s technology stocks have higher volatility, better suited for short-term trading or high-risk investors.
Investors should also pay attention to the trading volume and market depth of each tape. Although Tape B has relatively lower trading volume, some industry-leading companies still offer investment value. By analyzing historical data from different tapes, investors can evaluate market trends and individual stock performance.
In practice, some investors combine multiple data sources, using technical and fundamental analysis tools to enhance the rationality of their decisions. For investors requiring cross-border fund settlement, licensed Hong Kong banks can provide USD accounts and international remittance services to facilitate fund transfers and asset allocation.
Effectively utilizing data from Tapes A, B, and C helps investors seize market opportunities and optimize their portfolio structures.
Data Products

Image Source: pexels
ArcaBook
ArcaBook is one of the core data products offered by the New York Stock Exchange (NYSE). It provides market participants with real-time full limit order book data for the NYSE Arca exchange. Investors can access detailed information on each level of the bid and ask order book through ArcaBook, gaining insights into market depth and liquidity. ArcaBook covers not only Tape B-related stocks but also some ETFs and other asset classes.
ArcaBook offers a rich set of data elements, including opening, closing, halt auctions, indicative match prices, matched volumes, auction imbalances, and market imbalances. Market participants can use these data to optimize trading strategies and improve order execution efficiency.
| Feature | Description |
|---|---|
| Real-Time Data | NYSE ArcaBook provides real-time full limit order book data. |
| Data Elements | Includes opening, closing, halt auctions, indicative match prices, matched volumes, auction imbalances, and market imbalances. |
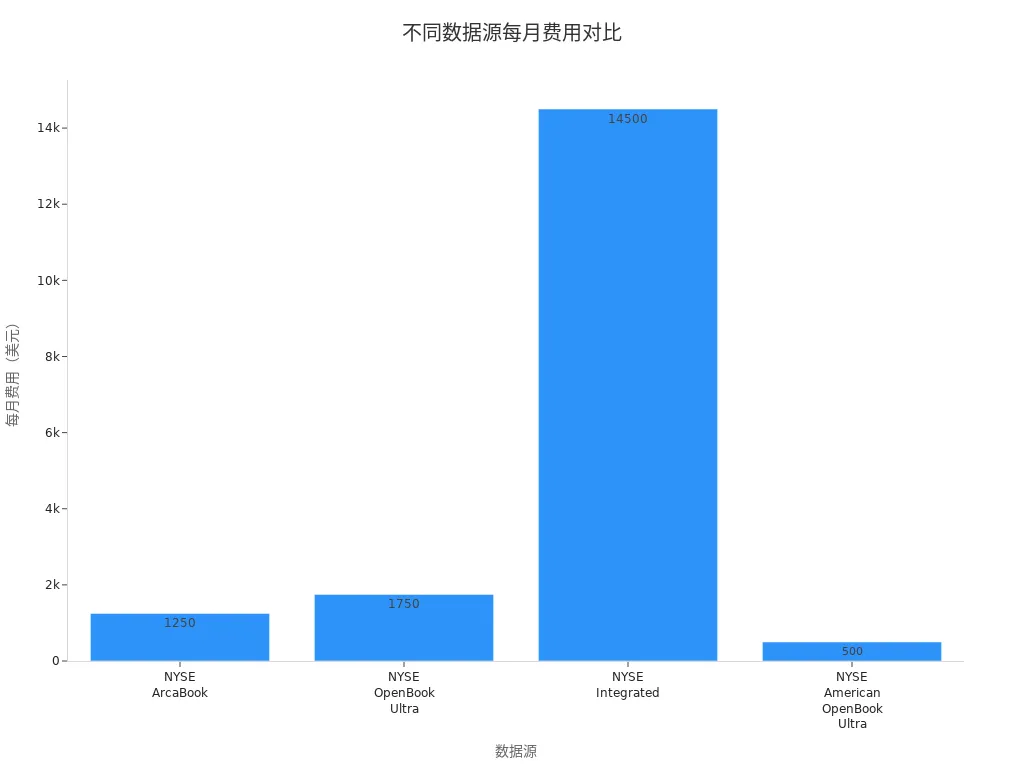
The monthly subscription fee for ArcaBook is $1,250. Investors can select appropriate data services based on their needs.
The Consolidated Tape Association (CTA) manages the dissemination of real-time trading and quote information for instruments listed on NYSE, NYSE Arca, NYSE American, and Cboe BZX. Tapes A, B, and C correspond to different market data sources, covering data from all regulated U.S. exchanges.
OpenBook
OpenBook is a depth data product provided by the New York Stock Exchange for Tape A stocks. It displays real-time order book information for NYSE main board-listed stocks, including prices and quantities for each level of the bid and ask. OpenBook’s data covers all Tape A-related stocks, helping investors gain insights into market dynamics and enhance the rationality of trading decisions.
The monthly fee for OpenBook Ultra is $1,750, suitable for institutional users with higher demands for data depth and speed. For investors needing integrated data from Tapes A, B, and C, the NYSE Integrated product offers a more comprehensive market view but comes at a higher cost of $14,500 per month.
The table below compares the fees for major data products:
| Data Source | Monthly Fee (USD) |
|---|---|
| NYSE ArcaBook | $1,250 |
| NYSE OpenBook Ultra | $1,750 |
| NYSE Integrated | $14,500 |
| NYSE American OpenBook Ultra | $500 |
When selecting data products, investors should consider the types of stocks they focus on, exchange distribution, and budget to allocate data services effectively, improving trading efficiency and market insights.
Tapes A, B, and C correspond to different exchanges and stock types. Investors should pay attention to the tape divisions and select appropriate data services. Tape A is suitable for focusing on large blue-chip stocks, Tape B covers regional exchanges, and Tape C focuses on technology growth stocks. Understanding the tape structure helps efficiently access market information and optimize investment decisions.
Investors can flexibly allocate U.S. stock data products based on their needs, combined with USD accounts at licensed Hong Kong banks.
FAQ
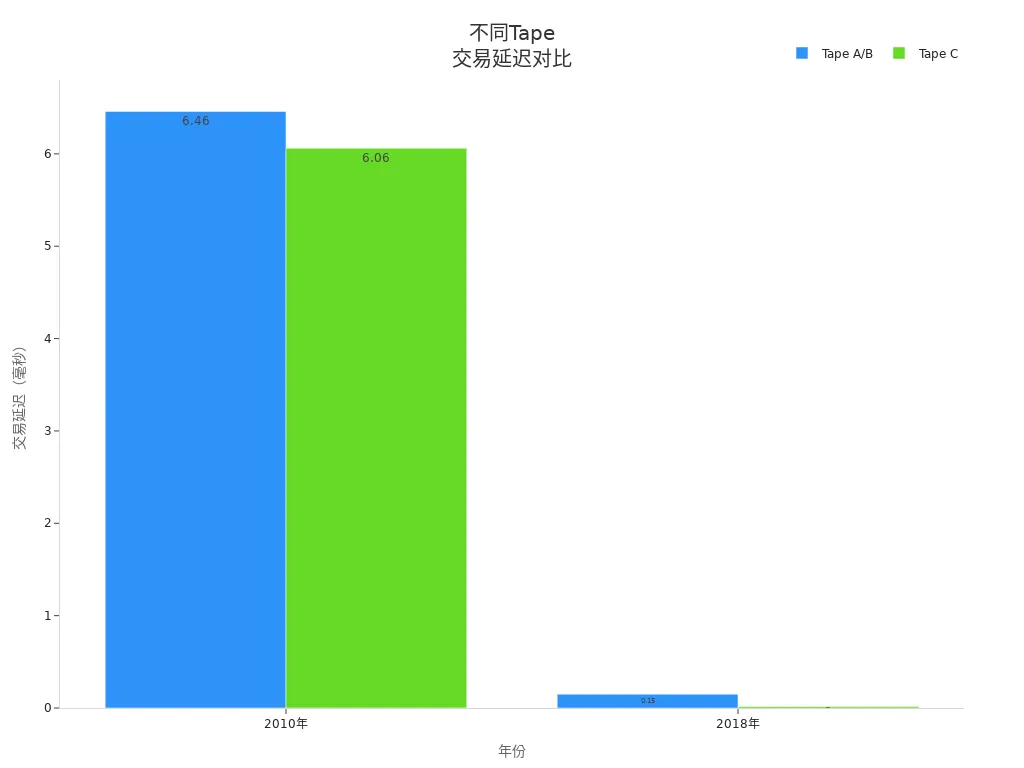
How Much Latency Do Tape A, B, and C Data Have?
Market data shows that the latency for Tapes A, B, and C has been significantly reduced. Mainstream brokers and data providers typically deliver real-time data within 1 second. High-frequency traders can achieve lower latency through dedicated lines.
How Should Investors Choose Appropriate Data Products?
Investors should select data products based on the types of stocks and exchanges they focus on. For example, those focusing on Nasdaq technology stocks can prioritize Tape C data. Institutional investors may consider integrated data services to enhance market insights.
What Is the Liquidity of Tape B Stocks?
The liquidity of Tape B stocks varies by company and industry. Some energy, financial, and technology companies have active trading. Investors can assess liquidity by observing trading volume and bid-ask spreads.
Can Licensed Hong Kong Banks Assist with U.S. Stock Fund Settlement?
Licensed Hong Kong banks can provide USD accounts and international remittance services for investors. Investors can use these banks for U.S. stock fund settlement and cross-border fund management, improving fund transfer efficiency.
Grasping the Tape A, B, and C structure is fundamental to sourcing reliable data from the world’s largest exchange. However, turning the insights gleaned from Tape A blue chips or Tape C tech stocks into profitable positions requires speed and cost efficiency in execution. When arbitrage opportunities arise, or market data demands a rapid portfolio adjustment, delays in funding can neutralize your data advantage.
To ensure your trading execution matches your data analysis, use the financial agility of BiyaPay. Our platform supports the swift, mutual conversion between fiat and digital assets like USDT, providing you with the fastest, most reliable pathway to fund your brokerage accounts. We offer international remittance at fees as low as 0.5%, potentially saving you up to 90% compared to traditional banks on global transfers. You can register quickly—in just 3 minutes without requiring an overseas bank account—and gain seamless access to US and Hong Kong Stocks trading. Leverage our real-time exchange rate checks to maintain transparent control over your funding. Open your BiyaPay account today and translate your NYSE market knowledge into efficient global action.
*This article is provided for general information purposes and does not constitute legal, tax or other professional advice from BiyaPay or its subsidiaries and its affiliates, and it is not intended as a substitute for obtaining advice from a financial advisor or any other professional.
We make no representations, warranties or warranties, express or implied, as to the accuracy, completeness or timeliness of the contents of this publication.


Contact Us
Company and Team
BiyaPay Products
Customer Services


is a broker-dealer registered with the U.S. Securities and Exchange Commission (SEC) (No.: 802-127417), member of the Financial Industry Regulatory Authority (FINRA) (CRD: 325027), member of the Securities Investor Protection Corporation (SIPC), and regulated by FINRA and SEC.
registered with the US Financial Crimes Enforcement Network (FinCEN), as a Money Services Business (MSB), registration number: 31000218637349, and regulated by FinCEN.
registered as Financial Service Provider (FSP number: FSP1007221) in New Zealand, and is a member of the Financial Dispute Resolution Scheme, a New Zealand independent dispute resolution service provider.