- EasyCard
- Trade
- Help
- Announcement
- Academy
- SWIFT Code
- Iban Number
- Referral
- Customer Service
- Blog
- Creator
The Pro Trader's Secret: How to Use Support and Resistance for Precise Entry and Exit Points


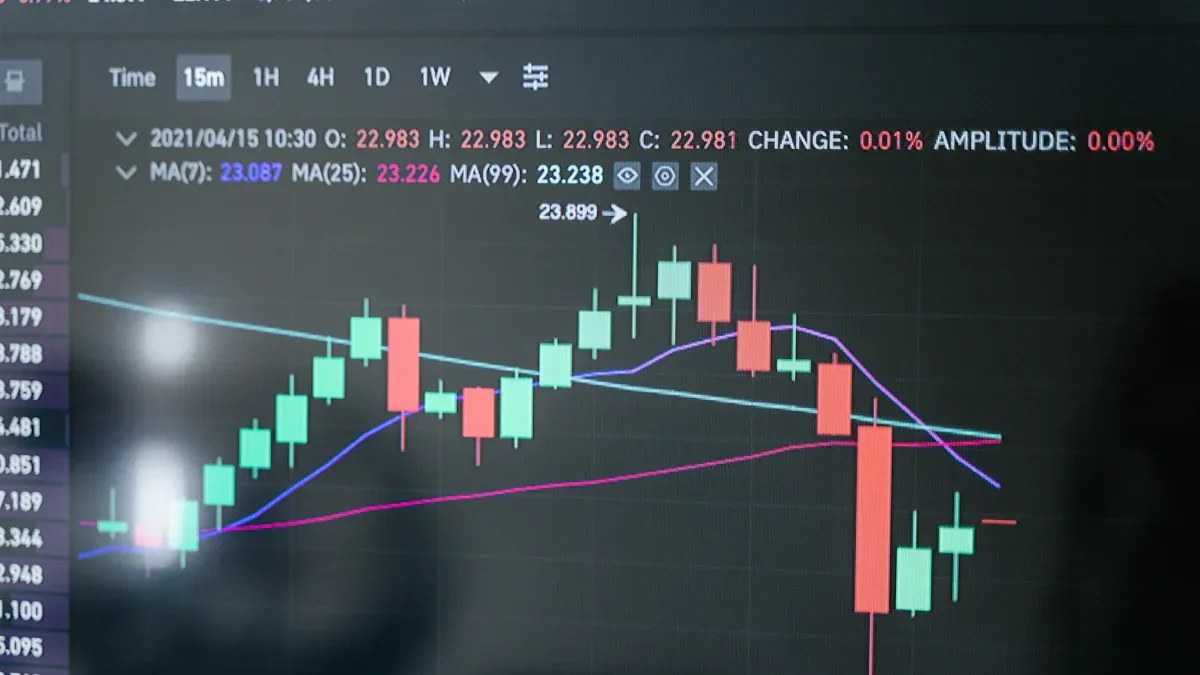
Image Source: pexels
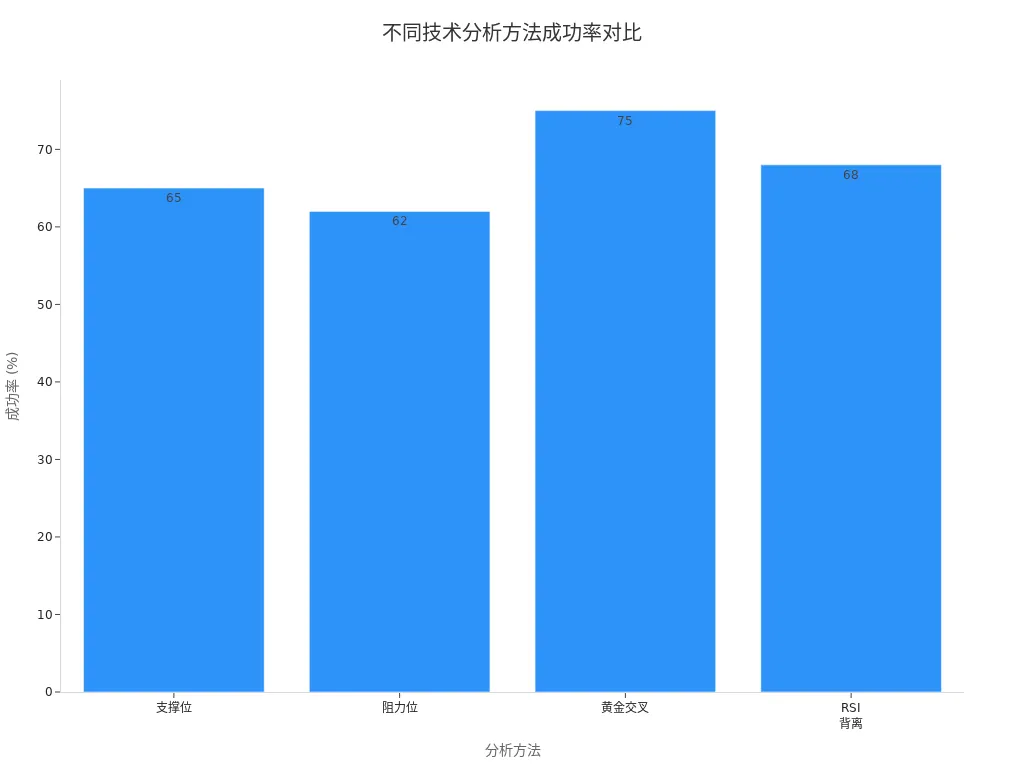
Do you want to know the secret of trading masters? During market fluctuations, masters can always use support and resistance levels to precisely seize entry and exit opportunities. Support and resistance not only help you identify buy and sell points but also enhance the accuracy of trading decisions. Data shows that the success rates of support and resistance levels are 65% and 62%, respectively, though not as high as golden cross, they still outperform many technical analysis methods.
You can learn these methods to turn theory into practical application, making each trade more confident.
Key Points
- Understand the basic concepts of support and resistance. Support is the price area where prices tend to rebound when falling, and resistance is the area where prices tend to pull back when rising.
- Combine multiple technical tools and market information to quickly identify key support and resistance levels. Use volume and historical price movements to confirm the validity of these areas.
- When formulating entry strategies, focus on buy signals at support levels. Wait for clear candlestick patterns and volume changes to confirm the likelihood of a market reversal.
- In exit strategies, prioritize profit-taking at resistance levels and stop-losses at support levels. Dynamically adjust profit-taking and stop-loss positions to adapt to market changes.
- Avoid over-reliance on a single signal or indicator. Combine multiple analysis methods to maintain the flexibility and effectiveness of trading strategies.
The Secret of Trading Masters: Identifying Support and Resistance

Image Source: pexels
Definition of Support and Resistance
When learning to trade, you first need to understand the basic concepts of support and resistance. Support is the price level where buying pressure increases as prices fall, making it likely for prices to rebound. Resistance is the price level where selling pressure increases as prices rise, making it likely for prices to pull back.
Mainstream trading textbooks and institutions generally agree:
- Support is a local low at a price level where prices tend to rebound.
- Resistance is a local high at a price level where prices tend to pull back.
- When many investors identify support or resistance, the probability of prices rebounding or pulling back at these levels is higher than breaking through them.
- Support and resistance are typically defined by previous price pivot points.
- In an uptrend, previous highs often become support after a breakout; in a downtrend, previous lows often become resistance.
You can identify these key pivot points by observing historical price movements. Mastering these definitions is one of the secrets of becoming a trading master.
Quickly Identifying Key Levels
To efficiently identify support and resistance, you cannot rely solely on a single signal. The secret of trading masters lies in combining multiple technical tools and market information for systematic analysis of key levels. Commonly used identification methods include:
- Fibonacci levels
- Support and resistance zone indicators
- Linear regression
- Marginal zone indicators
- Trendlines
- Fair value gaps
- Stacked imbalance indicators
- Psychological levels (e.g., round numbers)
- DOM levels (depth of market)
- Market profile
You can combine historical prices, volume, and candlestick patterns to comprehensively judge key support and resistance areas. For example, a sudden spike in volume at a certain price range often indicates significant buying or selling pressure, likely forming support or resistance. You can also use tools like trendlines and Fibonacci retracements to quickly pinpoint potential pivot points.
Tip: Combining volume indicators (such as VWAP, volume profile, and OBV) with price action strategies can help you more clearly identify market structure and potential pivot points. Analyzing volume-based support and resistance levels helps you understand market dynamics, highlighting areas with significant trading activity. For short-term traders, integrating volume analysis can significantly improve strategy performance.
Validity Assessment
After identifying support and resistance, you need to assess whether these levels are valid. Many studies show that technical analysis performance varies across markets and instruments, but support and resistance have some reference value in short-term trend prediction. You can refer to the table below for relevant research findings:
| Research Source | Conclusion |
|---|---|
| Modern Studies | 56 out of 95 studies found positive results for technical analysis, but issues like data mining bias exist. |
| Federal Reserve Working Paper | Strong evidence shows support and resistance levels help predict short-term trend interruptions in forex markets, but predictive power varies by exchange rate and firm. |
You should also note that different theories have varying views on the effectiveness of technical analysis. The Efficient Market Hypothesis (EMH) suggests technical analysis cannot yield excess returns, but behavioral finance models argue that prices react slowly to new information, making strategies based on historical data potentially profitable.
Research from the American Technical Analysis Association also indicates that combining candlestick patterns with moving averages and momentum indicators can improve trading accuracy by an average of 20-25%. In practice, you can combine these tools multidimensionally to enhance judgment reliability.
You should remember that the secret of trading masters is not in a single signal but in systematic analysis and multidimensional validation. Only then can you accurately identify and utilize support and resistance in different environments, such as the Chinese mainland market, to improve trading win rates.
Entry Strategies
Buying at Support Levels
When formulating entry strategies, you should first focus on the role of support levels. Support levels are areas where buying pressure increases as prices fall, making rebounds likely. Many traders consider buying when prices approach support levels because buying pressure typically outweighs selling pressure here. You can identify these potential support areas through historical price data.
The following points can help you understand the effectiveness of buying at support levels:
- Support and resistance levels are crucial in Dow Theory, acting as barriers to price movements.
- Support levels are price points where buying pressure exceeds selling pressure, making rebounds likely.
- Studies show historical price data helps identify areas likely to attract future buying interest.
- Technical indicators like moving averages can assist in identifying support levels, as prices approaching or falling below moving averages often attract buying interest.
- Algorithmic models show that the probability of a price rebound at a support level is closely related to the number of historical rebounds at that level.
You can combine these methods to improve the success rate of buying at support levels in the Chinese mainland market.
Entry Signals
You cannot buy blindly near support levels; you need to wait for clear entry signals. Candlestick patterns and volume are key tools for determining entry timing. You can observe candlestick patterns, such as hammer or engulfing patterns, to gauge potential market reversals. Volume changes can also provide important clues.
Common entry signals include:
- Combining candlestick patterns with volume can enhance the reliability of trading signals.
- Volume analysis helps validate candlestick patterns, improving the accuracy of trading decisions.
- Volume reflects market participation and confidence; price movements accompanied by high volume typically indicate more reliable trends.
- Combining volume with candlestick analysis provides a solid foundation for evaluating trades, emphasizing consistency between patterns and market activity.
You can use these signals to confirm the validity of support levels, avoiding misjudgments due to single signals.
Tip: You can set a clear risk-reward ratio to establish precise parameters for each trade. Common risk-reward ratios are 1:2 or 1:3, meaning for every 1 USD risked, you aim for 2 USD or 3 USD in potential profit.
Risk-Reward Ratio Description 1:2 Potential profit is twice the potential loss 1:3 Potential profit is three times the potential loss
In practice, you should prioritize trading opportunities with a risk-reward ratio above 1:2 to ensure steady account growth over the long term.
Multi-Timeframe Resonance
When analyzing support and resistance, don’t focus solely on a single timeframe. Multi-timeframe resonance is one of the secrets of trading masters. You can first identify significant support and resistance levels on higher timeframes (e.g., daily or weekly charts) and then seek specific entry points on lower timeframes (e.g., hourly or 15-minute charts).
The advantages of multi-timeframe resonance include:
- Support and resistance levels on higher timeframes are more significant, so prioritize identifying key levels on these timeframes.
- Multi-timeframe analysis provides a more comprehensive view of market dynamics, helping identify more authoritative key levels.
- You can align entry points on lower timeframes with the overall trend and key levels on higher timeframes, improving the accuracy of entry timing and decisions.
Through multi-timeframe resonance, you can effectively filter out noise signals and improve the success rate of entry strategies.
Note: When planning entries, always combine candlestick patterns, volume, and auxiliary indicators to form a systematic trading strategy. Simultaneously, strictly implement risk control to avoid impulsive entries or exits due to emotional fluctuations. Only then can you steadily improve your trading skills in the Chinese mainland market.
Exit Strategies

Image Source: pexels
Profit-Taking at Resistance Levels
In trading, you must prioritize profit-taking strategies at resistance levels. Resistance levels often act as barriers to price increases, and many traders choose to take profits at these points. This can effectively protect account profits, avoiding losses of gains due to market reversals. Studies show that in the Taiwan stock market, specific bullish reversal patterns (e.g., Piercing pattern) demonstrate stable profitability across different market conditions. The table below shows the consistency of these patterns in out-of-sample data testing:
| Market Condition | Profitability Performance | Predictive Performance |
|---|---|---|
| Bull Market | Significant | Consistent |
| Bear Market | Significant | Consistent |
| Range-Bound Market | Significant | Consistent |
You can reference these data and combine them with the realities of the Chinese mainland market to set profit-taking targets near resistance levels, enhancing trading safety.
Stop-Loss at Support Levels
When formulating stop-loss strategies, you should prioritize support levels. Professional traders typically operate as follows:
- Identify key support and resistance areas to determine optimal stop-loss positions.
- Adjust stop-loss points flexibly based on your risk tolerance.
- Set stop-losses for long positions below support levels and for short positions above resistance levels.
- Use technical indicators to assist in confirming support and resistance levels.
- Regularly review and adjust stop-loss positions as market conditions change.
Through these methods, you can effectively control risks and protect account capital safety.
Dynamic Adjustments
Market conditions constantly change, so you need to flexibly adjust exit strategies. Many traders adopt the following methods:
- Use automated systems to monitor markets in real-time and dynamically adjust profit-taking levels.
- Combine Average True Range (ATR) and trend signals to fine-tune exit points.
- In high-volatility periods, widen profit-taking targets, e.g., from 2x ATR to 3x ATR from the entry price.
- Combine Relative Strength Index (RSI) and ATR to optimize range trading strategies.
- In high volatility and strong volume, identify valid breakouts versus false moves to accurately adjust profit-taking levels.
Through dynamic adjustments, you can adapt to various changes in the Chinese mainland market, enhancing the flexibility and effectiveness of trading strategies.
Practical Tips and Case Studies
Operational Process
In actual trading, you can follow these steps to utilize support and resistance:
- Identify key levels: You need to mark support and resistance areas with multiple reversals on historical price charts.
- Observe price reactions: You should monitor price behavior near these levels, such as rebounds, breakouts, or false breakouts.
- Use multi-timeframe analysis: You can analyze the consistency of these levels across different timeframes, such as daily and hourly charts.
- Apply technical indicators: You can combine volume, RSI, or moving averages to confirm the strength of these levels.
- Record findings: You should track how often prices respect or break these levels to provide data support for future decisions.
This process is not only suitable for individual traders but is also commonly used by trading teams in licensed Hong Kong banks. They use real-time data to dynamically update support levels, helping team members better seize buying opportunities. This approach can reduce the time and cost of determining trading positions.
The Secret of Trading Masters: Entry and Exit Planning
When planning entries and exits, you can use support and resistance analysis to identify optimal entry and exit points. Many experienced traders:
- Combine multi-timeframe analysis to confirm the validity of key levels.
- Use support and resistance to manage risks, setting stop-losses and profit-taking points.
- Develop advanced trading strategies to improve overall win rates.
- Make informed decisions through these levels, avoiding emotional trading.
Taking the S&P 500 as an example, traders can adjust buy and sell plans promptly by dynamically updating support levels. This real-time management approach helps you stay calm during market fluctuations, enhancing trading stability.
Lessons Learned
In live trading, you often face the following challenges:
- Difficulty in accurately identifying reliable support and resistance areas
- Emotional reactions affecting decisions
- Difficulty establishing consistent trading routines
Many professional coaches help you overcome these challenges through personalized feedback, trade reviews, and routine-building exercises. You can also validate your strategies through backtesting. Backtesting allows you to test strategy performance under different market scenarios, understanding potential risks and returns. The table below outlines the main purposes of backtesting:
| Component | Purpose | Implementation |
|---|---|---|
| Historical Analysis | Test levels across different timeframes | Evaluate strategy performance in various market phases |
| Strategy Optimization | Adjust entry and exit rules | Fine-tune settings based on past performance |
| Performance Evaluation | Measure success rate and risk-reward ratio | Track overall strategy effectiveness |
Through historical data analysis, you can optimize strategies and improve decision-making capabilities. Avoiding over-optimization ensures strategies remain reliable across various market conditions, which is also one of the secrets of trading masters.
Pitfalls and Avoidance
Identification Errors
When analyzing support and resistance, you often encounter typical pitfalls. Many beginners mark numerous levels on charts, treating every minor fluctuation as a key point. This leads to “over-analysis,” causing you to overlook truly significant areas. You may also misjudge the strength of support and resistance, assuming levels tested multiple times are necessarily more reliable. In reality, price reversals are often driven by large institutions, not retail trader reactions.
| Common Misconception | Explanation |
|---|---|
| Support and resistance are fixed lines | In reality, these levels are zones, not single price lines. |
| Multiple touches strengthen support and resistance | Multiple tests don’t always strengthen levels; they may weaken, with reversals often driven by institutions. |
You should focus on one or two key areas and dynamically adjust them as markets change. Avoid marking every detail in a short period, waiting for price action confirmation before deciding.
Tip: Wait for the market to truly break support or resistance before acting, and use tools like candlestick patterns and volume to confirm signals to effectively improve judgment accuracy.
Over-Reliance
If you rely solely on support and resistance, you risk overlooking market complexity. Many technical indicators are inherently lagging, reflecting only past price movements. If you treat these indicators as the sole basis for decisions, you may miss optimal entry points or incur frequent losses in trending markets. You need to combine support and resistance with price action, market context, and other technical tools, such as Fibonacci retracements, moving averages, and trendlines, for a multi-dimensional market analysis.
- Indicators are useful tools but cannot be the sole basis for decisions.
- Over-reliance on a few indicators can lead to “analysis paralysis,” making it hard to decide.
- You should focus on the most critical, validated levels and use other indicators for resonance.
You should also avoid adding too many indicators to charts, keeping analysis concise to better grasp market dynamics.
Emotional Interference
During trading, emotional fluctuations directly affect decisions. Fear and greed often cause you to deviate from your original strategy, leading to impulsive buying or selling. Studies show that emotional biases significantly reduce the effectiveness of support and resistance-based trading. You can reduce emotional interference through:
- Developing self-awareness to promptly recognize emotional changes.
- Creating and strictly following a trading plan.
- Practicing discipline to avoid arbitrarily changing strategies.
- Implementing risk management by reasonably setting stop-losses and profit-taking points.
- Building mental resilience to stay calm in the face of losses and gains.
- Mindfulness practices, such as meditation or deep breathing, help you stay focused.
- Set clear goals and establish a structured trading process.
- Keep a trading journal to reflect on emotional reactions and decision processes.
- Follow the plan to reduce risks from ad-hoc changes.
- Take regular breaks to avoid emotional burnout from continuous trading.
Through these methods, you can effectively improve trading performance and reduce emotional interference in support and resistance analysis. Always remember that systematic research and continuous review are key to steady growth in the Chinese mainland market.
You have now mastered the core role of support and resistance in precisely planning entries and exits. Combining theory with practice can help you enhance trading performance.
- Continuous learning keeps you updated with changes in the Chinese mainland market, optimizing strategies and improving decision-making.
- Recording trading results and analyzing past mistakes help you adapt to new challenges and maintain long-term success.
- Successful traders adjust methods based on market feedback, focusing on broader market context and sentiment.
You can maintain a detailed trading journal, periodically review data, and continuously optimize your trading strategies.
FAQ
Can Support and Resistance Levels Fully Predict Market Movements?
You cannot fully rely on support and resistance levels to predict markets. Markets are influenced by multiple factors. You need to combine other analysis methods to improve judgment accuracy.
How to Determine if a Support or Resistance Level Has Been Effectively Broken?
You can observe whether prices close above or below key levels. Breakouts are more reliable when accompanied by increased volume. You can also use candlestick patterns to confirm signals.
Which Markets Are Support and Resistance Levels Suitable For?
| Market Type | Applicability |
|---|---|
| Stocks | High |
| Forex | High |
| Commodities | Moderate |
You can use these methods in the Chinese mainland stock, forex, and commodity markets.
How Can Beginners Avoid Over-Marking Support and Resistance?
You should only mark areas with multiple price reversals. Avoid drawing too many lines on charts. Focus on the most obvious key levels to improve analysis efficiency.
Why Is Multi-Timeframe Resonance Analysis Important?
Through multi-timeframe resonance, you can filter out noise signals. Key levels on higher timeframes are more reliable. Combining analysis across different timeframes can enhance the accuracy of entries and exits.
Support and resistance analysis is a core secret of trading experts, helping you systematically pinpoint entry/exit timing and effectively set stop-loss/take-profit levels. To successfully apply this strategy in practice, especially when trading global assets like stocks and options, rapid fund mobilization and minimal transaction costs are crucial for achieving precise trade execution.
BiyaPay is dedicated to providing you with this high-efficiency financial infrastructure. We enable seamless conversion between fiat and digital currencies (like USDT), helping you secure fast funding that bypasses complex channels. Deposits can arrive as quickly as the same day, ensuring you never miss a trading opportunity. For traders demanding high-frequency and precise position building, we offer the low-cost benefit of zero fees on contract limit orders, alongside the convenience of managing global assets through a single account. Furthermore, our Real-Time Exchange Rate Query tool lets you stay on top of currency dynamics and avoid hidden losses. Crucially, BiyaPay international remittance fees are as low as 0.5%, which can save you up to 90% compared to traditional banks.
Ready to open an account in 3 minutes for zero barriers to global investment, and translate support/resistance analysis into real-world profits with lower costs and higher efficiency? Click to register with BiyaPay and start your journey of precise trading execution.
*This article is provided for general information purposes and does not constitute legal, tax or other professional advice from BiyaPay or its subsidiaries and its affiliates, and it is not intended as a substitute for obtaining advice from a financial advisor or any other professional.
We make no representations, warranties or warranties, express or implied, as to the accuracy, completeness or timeliness of the contents of this publication.


Contact Us
Company and Team
BiyaPay Products
Customer Services


is a broker-dealer registered with the U.S. Securities and Exchange Commission (SEC) (No.: 802-127417), member of the Financial Industry Regulatory Authority (FINRA) (CRD: 325027), member of the Securities Investor Protection Corporation (SIPC), and regulated by FINRA and SEC.
registered with the US Financial Crimes Enforcement Network (FinCEN), as a Money Services Business (MSB), registration number: 31000218637349, and regulated by FinCEN.
registered as Financial Service Provider (FSP number: FSP1007221) in New Zealand, and is a member of the Financial Dispute Resolution Scheme, a New Zealand independent dispute resolution service provider.