- EasyCard
- Trade
- Help
- Announcement
- Academy
- SWIFT Code
- Iban Number
- Referral
- Customer Service
- Blog
- Creator
Beginner’s Guide to Reading Hang Seng Index Interactive Charts


Image Source: pexels
When you first encounter the Hang Seng Index interactive chart, remember three key points: you need to understand the chart structure, learn to use interactive functions, and know how to interpret critical data.
As long as you practice diligently, whether it’s candlestick charts, technical indicators, or Hang Seng Index historical trend charts, you can easily master them. These skills are very practical, and any beginner can learn them.
Key Points
- Understand the basic structure of the Hang Seng Index chart, including candlestick charts, line charts, and volume charts, to help you quickly grasp price movements and market activity.
- Learn to use technical indicators such as moving averages and the Relative Strength Index to improve your ability to judge market trends and trading opportunities.
- Master the interactive operation techniques of charts, such as zooming, panning, and switching timeframes, to facilitate market trend analysis from different perspectives.
- Learn to interpret key data such as opening price, closing price, and percentage change, and combine it with volume to assess market sentiment and trend changes.
- Avoid common reading mistakes, simplify chart content, and make good use of alert functions to improve analysis accuracy and operational efficiency.
Chart Structure
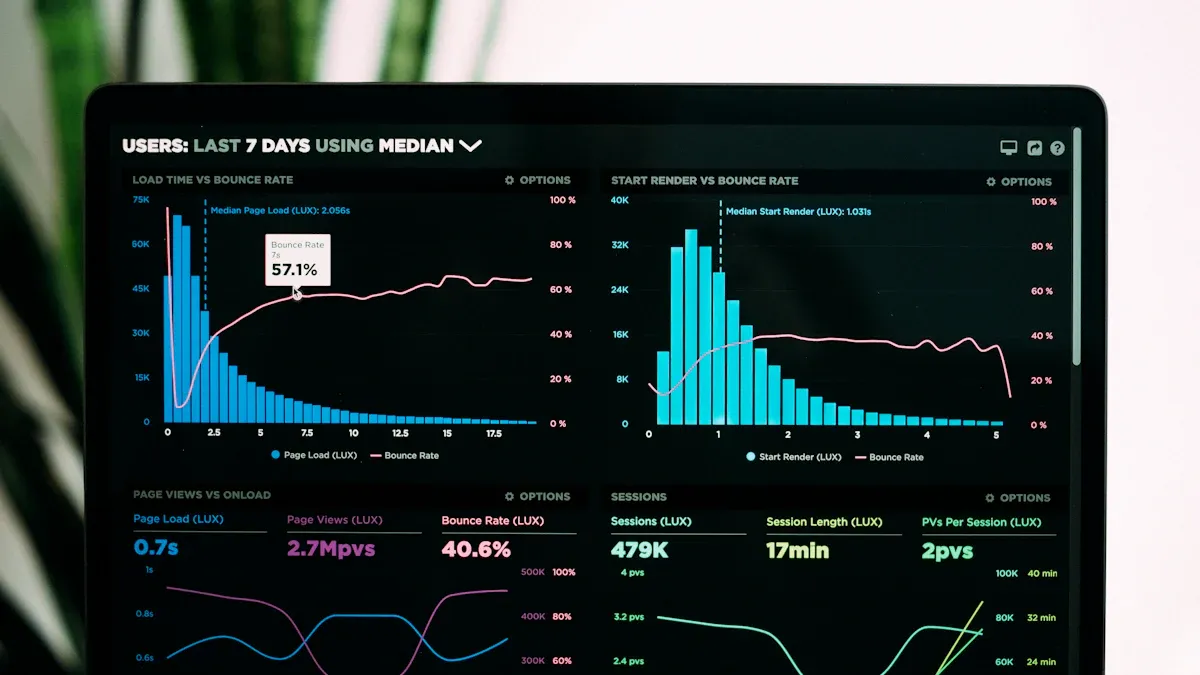
Image Source: unsplash
Candlestick and Line Charts
In the Hang Seng Index interactive chart, the most common display formats are candlestick charts, line charts, and bar charts. Candlestick charts (also known as K-line charts) can simultaneously display the opening price, closing price, highest price, and lowest price. You can use candlestick charts to quickly judge price changes within a day.
Line charts connect the daily closing prices, suitable for observing long-term trends. If you want to see volume changes, you can choose bar charts.
Tip: Beginners are advised to start with line charts because they are simple and easy to understand.
Technical Indicators
Technical indicators can help you analyze market trends. The most common ones are the Moving Average (MA) and the Relative Strength Index (RSI). The Moving Average calculates the average price over a period, allowing you to see the trend direction clearly.
The RSI is used to determine whether the market is overbought or oversold. You can add these indicators to the chart to help you make better judgments.
| Technical Indicator | Main Function |
|---|---|
| MA | Shows price trends |
| RSI | Judges overbought or oversold conditions |
Volume
The volume area is usually displayed at the bottom of the chart, represented by bars of varying heights. You can observe volume changes to judge market activity levels. When volume is high, it indicates more market participants, and price fluctuations may be significant.
You should pay attention to situations where volume and price rise or fall simultaneously, as this helps you determine whether the market trend is changing.
Hang Seng Index Historical Trend Chart
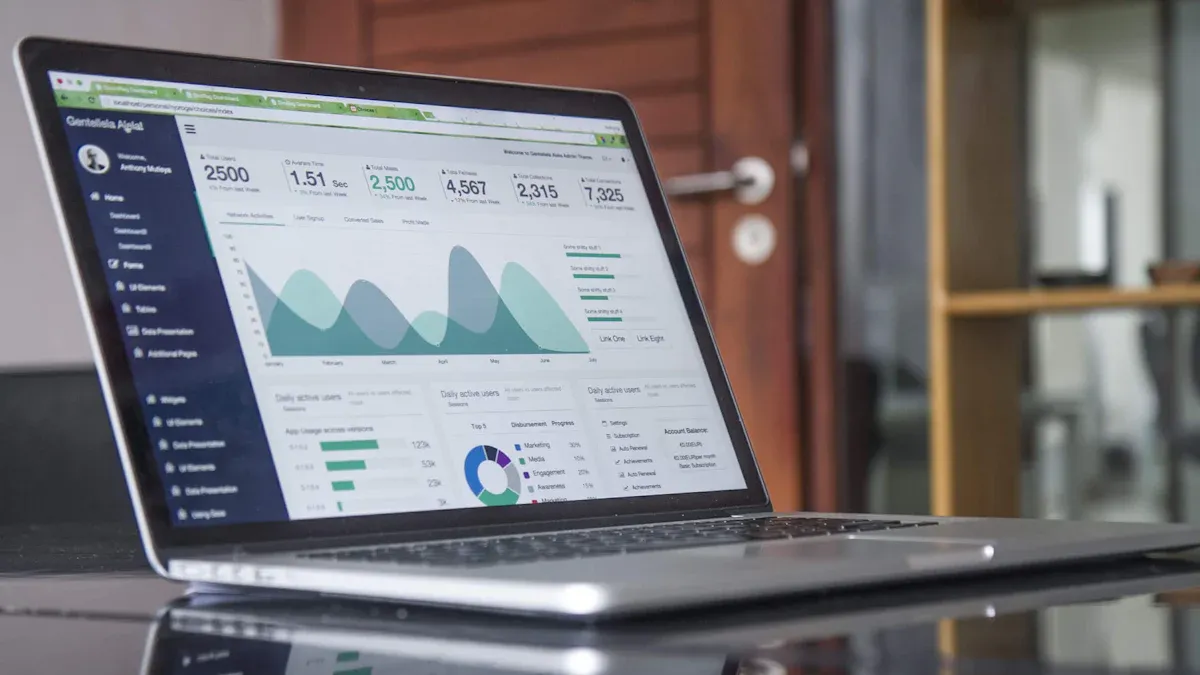
Image Source: unsplash
When you learn to read the Hang Seng Index historical trend chart, you can gain a more comprehensive understanding of market changes. This chart allows you to see the index’s performance over different time periods, helping you identify trends and turning points.
As long as you master a few basic operations, you can effectively utilize this tool.
Timeframe Switching
You can switch between different timeframes on the Hang Seng Index historical trend chart. Common timeframes include daily, weekly, and monthly lines. Each timeframe provides a different market perspective. According to The Bible of Candlestick Charts, daily lines record daily price changes, while weekly and monthly lines help you observe longer-term trends.
You can use these switches to identify the start and end of trends and find support and resistance levels. This way, you can enhance your market sensitivity and judgment.
Tip: You can start with daily lines and then switch to weekly or monthly lines to more easily identify major trends.
Historical Data Viewing
The Hang Seng Index historical trend chart usually supports a mouse hover function. When you hover your mouse over a specific day or candlestick, the chart will display the opening price, closing price, highest price, lowest price, and volume for that day. You can quickly compare data from different dates to understand market changes.
You can also switch between daily, weekly, and monthly lines to analyze the market from multiple perspectives. Many charts also have a comparison function, allowing you to view multiple indices simultaneously for cross-sectional analysis, which is very helpful for judging market strength.
- You can use the following methods to improve your analysis skills:
- Switch between different timeframes to observe trend changes.
- Use the mouse hover function to view detailed data.
- Try comparing the trends of different indices.
The Hang Seng Index historical trend chart is not just about looking at numbers; it’s about learning how to let data tell a story. As long as you practice more, you can discover more market patterns and improve your analytical skills.
Operating Guidelines
Zooming and Panning
When using the Hang Seng Index interactive chart, you often need to zoom in or out to observe details of different time periods. You can use the mouse wheel to zoom the chart directly, quickly focusing on a specific period. You can also click on the timeframe axis at the bottom of the chart and drag the mouse left or right to view past or future data.
These operations allow you to switch perspectives easily, whether you want to see short-term fluctuations or long-term trends, all at a glance.
Tip: If you want to compare multiple periods simultaneously, zoom out the chart first and then pan slowly to more easily identify trend changes.
Indicator Switching
You can switch between different technical indicators based on your analysis needs. For example, you can choose the Moving Average (MA), Relative Strength Index (RSI), Bollinger Bands, etc.
These indicators can help you judge market trends and trading opportunities. According to market surveys and practical applications of technical analysis, indicator switching has many successful cases in different market conditions:
- Survival Analysis: You can predict the performance of certain stocks or indices in specific periods, which is more useful than simple descriptions.
- Tracking Data Regression Analysis: You can use time series data to analyze market changes in different periods and uncover potential opportunities.
- Simultaneous Equation Models: You can build models based on different indicators to predict market trends more accurately.
- Market Segmentation Analysis: You can use the K-means algorithm to observe the performance of different market segments and find the most suitable investment strategy for yourself.
- Flexible Model Construction: You can combine multiple indicators to help generate higher returns in industries like retail or healthcare.
- Logistic Regression Applied to Market Basket Analysis: You can predict consumer behavior to enhance your market judgment.
When switching indicators on the Hang Seng Index historical trend chart, you can flexibly adjust strategies based on these analysis methods to improve analysis accuracy.
Note: Different indicators are suitable for different market conditions, so you can experiment to find the combination that works best for you.
Setting Alerts
You can set real-time alerts on most Hang Seng Index interactive charts. When the index price reaches your set target, the system will automatically notify you. This function is particularly useful for busy investors, as you don’t need to constantly monitor the chart and won’t miss important market changes.
You can also set real-time updates to ensure the data you see is the latest. This way, you can react promptly and seize every investment opportunity.
- Common alert settings:
- Set alerts for when the price rises or falls to a specific value.
- Set alerts for abnormal volume changes.
- Set alerts for when technical indicators show specific signals.
Tip: You can flexibly set multiple alerts based on your investment strategy to improve operational efficiency.
Data Interpretation
When reading the Hang Seng Index interactive chart, the most important thing is to learn to interpret various data. These data can help you understand market conditions and improve your analytical skills.
The following sections will introduce opening and closing prices, percentage changes, and how to simply judge market trends.
Opening and Closing Prices
Theopening price and closing price are two numbers you must pay attention to. The opening price refers to the price of the Hang Seng Index at the start of daily trading, while the closing price is the price of the last transaction of the day.
You can compare these two numbers to initially gauge market sentiment.
| Data Name | Meaning | Key Observation |
|---|---|---|
| Opening Price | The first transaction price of the day | Whether it is higher than the previous closing price |
| Closing Price | The last transaction price of the day | Whether it is higher than the opening price |
On the Hang Seng Index historical trend chart, you can usually see the opening and closing prices for each day directly.
When the closing price is higher than the opening price, it indicates an optimistic market sentiment for the day. Conversely, if the closing price is lower than the opening price, the market may be more pessimistic.
Tip: Pay attention to the changes in opening and closing prices over consecutive days to more easily identify market trends.
Percentage Change
Percentage change is an important indicator for measuring the daily fluctuation range of the Hang Seng Index. You can calculate it using the following formula:
Percentage Change (%) = [(Closing Price - Opening Price) ÷ Opening Price] × 100
If the percentage change is positive, it indicates the index has risen; if negative, it indicates a decline. You can see the percentage change value directly on the chart, which helps you quickly judge market volatility.
- You should pay attention to the following situations:
- A percentage change greater than 2% indicates significant market volatility, requiring special attention to risks.
- A percentage change close to 0% indicates a relatively stable market, suitable for observing subsequent trends.
- Consistent percentage changes in the same direction over multiple days may signal the formation of a new trend.
Volume is also a data point you cannot ignore. When volume increases significantly alongside large percentage changes, market sentiment is usually strong.
You can find the volume bar chart at the bottom of the Hang Seng Index historical trend chart to observe volume changes.
Judging Market Trends
You can simply judge market trends based on opening and closing prices, percentage changes, and volume.
Here are the commonly used steps:
- Define the question you want to understand, such as “Will the Hang Seng Index rise in the short term?”
- Explore the chart data, observing changes in opening and closing prices, percentage changes, and volume.
- Analyze the data to identify patterns, such as three consecutive days with closing prices higher than opening prices or continuously increasing volume.
- Verify your assumptions. You can refer to statistical testing methods, such as comparing average percentage changes across different periods or using simple moving averages to judge trends.
- Finally, make decisions based on your observations, such as choosing to wait or take action.
Note: Data analysis typically includes five steps: defining the problem, exploring data, analyzing data, verifying assumptions, and communicating decisions. You can use these steps to improve the accuracy of your market trend judgments. Many professional analysts use statistical tests (such as t-tests, chi-square tests, ANOVA) and model cross-validation (such as K-fold cross-validation or leave-one-out) to evaluate the reliability of their analysis results. While you may not need to use these complex methods, you can learn from their approach to build confidence.
As long as you practice reading the Hang Seng Index historical trend chart and combine the above data analysis methods, you can gradually improve your market judgment skills.
Remember, predictive analysis forecasts future trends based on past data patterns, which is the greatest value of learning data interpretation.
Common Mistakes
Pitfalls
When reading the Hang Seng Index interactive chart, you often encounter several typical mistakes. According to Sarah Leo, a journalist at The Economist, these mistakes can be divided into three categories:
- Misleading Charts: Some charts truncate the scale, causing you to underestimate or exaggerate data changes. For example, a chart showing only partial data can easily lead you to misjudge market trends.
- Confusing Charts: Chaotic colors or mixed chart types can make it hard for you to distinguish key data points. In such cases, you may easily overlook important information.
- Charts That Fail to Explain the Issue: Charts with excessive details or poor design can make it impossible for you to grasp the main point. For example, too many colors or categories can obscure the main trend.
Tip: You should avoid focusing only on the surface of the chart and pay attention to whether the chart design is clear and the data is complete.
Solutions
You can adopt the following methods to improve the accuracy of reading Hang Seng Index charts:
- Use Programmatic Trading Tools: These tools can help you eliminate emotional biases and make data-driven judgments. You can use backtesting functions to check whether your analysis strategy is effective.
- Learn to Interpret Code Logic: You can refer to others’ strategies and repeatedly test with historical data to identify and correct your mistakes.
- Simplify Chart Content: You should focus on key data and avoid looking at too many indicators at once. This can improve the chart’s readability.
- Customize Technical Indicators: You can set appropriate technical indicators based on your needs to enhance your understanding of market data.
Remember: As long as you practice more and make good use of modern tools, you can effectively avoid common mistakes and improve your market analysis skills.
You have now mastered the three core skills for reading Hang Seng Index interactive charts: understanding chart structure, mastering interactive operations, and learning to interpret data.
You can practice more with the Hang Seng Index historical trend chart to improve your analytical skills. Continuous learning is important. You can refer to the Hong Kong Stock Exchange’s official website, Investing.com, and other websites to access more chart resources and tutorials.
It is recommended that you spend a little time practicing every day to gradually build confidence.
FAQ
How to choose the right technical indicators?
You can choose technical indicators based on your analysis goals. Beginners are advised to start with the Moving Average (MA) and Relative Strength Index (RSI), as these two indicators are easy to understand and suitable for observing trends and market conditions.
Do Hang Seng Index interactive charts require payment?
Most Hang Seng Index interactive chart platforms provide free basic functions.
If you need advanced analysis or real-time data, some platforms charge monthly fees, approximately $10–30 USD, depending on the exchange rate.
Can I view Hang Seng Index interactive charts on my phone?
You can view Hang Seng Index interactive charts on most mobile browsers or dedicated apps.
Some platforms support automatic adaptation to mobile screens, making it convenient for you to check data anytime, anywhere.
How to set price alert functions?
You can find the “alert” or “notification” function within the chart platform.
Simply input the target price or technical indicator conditions, and the system will notify you via email or mobile when the conditions are met.
In the volatile Hang Seng Index market of 2025, mastering interactive charts empowers novice investors to spot trends, but complex fund management and high remittance fees often hinder efficiency. BiyaPay offers a seamless solution to these challenges. With quick registration via its mobile app, you can open an account without cumbersome procedures and trade U.S. and Hong Kong stocks in real-time using a single account—start now at BiyaPay!
BiyaPay supports real-time conversions across multiple fiat and digital currencies with transparent rate queries, ensuring cost clarity. With remittance fees as low as 0.5%, it outperforms traditional platforms. Visit BiyaPay today to streamline your investments and capitalize on Hang Seng market opportunities!
*This article is provided for general information purposes and does not constitute legal, tax or other professional advice from BiyaPay or its subsidiaries and its affiliates, and it is not intended as a substitute for obtaining advice from a financial advisor or any other professional.
We make no representations, warranties or warranties, express or implied, as to the accuracy, completeness or timeliness of the contents of this publication.


Contact Us
Company and Team
BiyaPay Products
Customer Services


is a broker-dealer registered with the U.S. Securities and Exchange Commission (SEC) (No.: 802-127417), member of the Financial Industry Regulatory Authority (FINRA) (CRD: 325027), member of the Securities Investor Protection Corporation (SIPC), and regulated by FINRA and SEC.
registered with the US Financial Crimes Enforcement Network (FinCEN), as a Money Services Business (MSB), registration number: 31000218637349, and regulated by FinCEN.
registered as Financial Service Provider (FSP number: FSP1007221) in New Zealand, and is a member of the Financial Dispute Resolution Scheme, a New Zealand independent dispute resolution service provider.