- EasyCard
- Trade
- Help
- Announcement
- Academy
- SWIFT Code
- Iban Number
- Referral
- Customer Service
- Blog
- Creator
Midday Dynamics and Capital Flow Analysis of Asian Stock Markets


Image Source: pexels
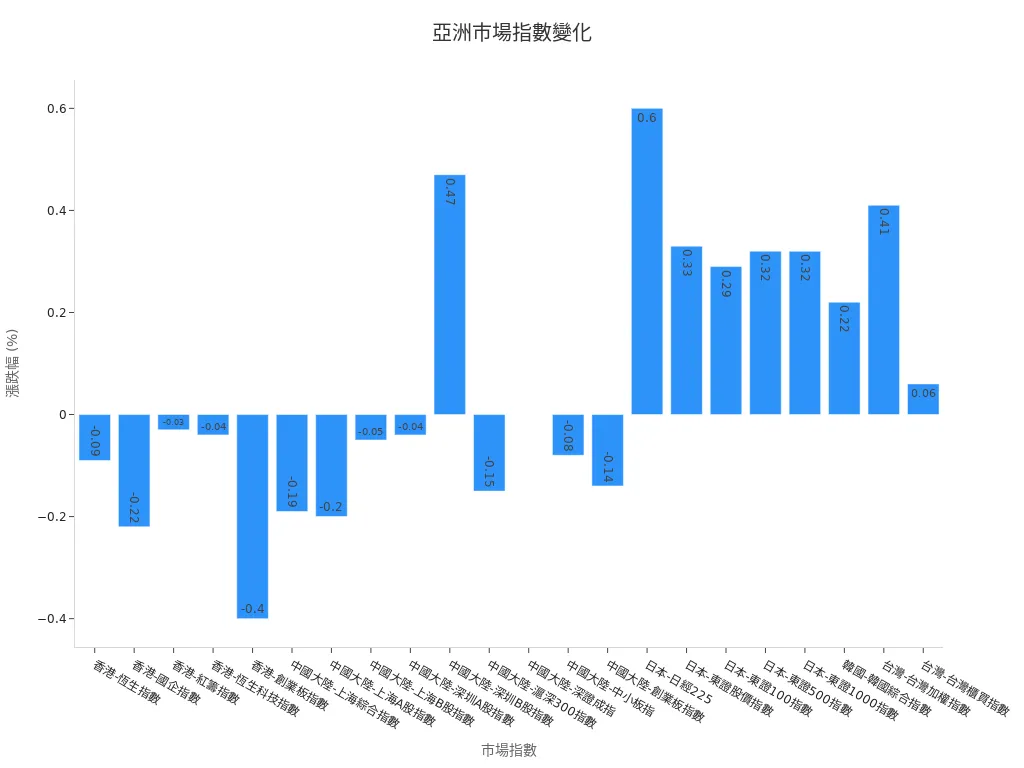
Asian stock markets showed mixed performance at midday, with the Nikkei 225 Index rising 0.60% and the Taiwan Weighted Index recording a 0.41% gain, reflecting significant capital inflows into Japan and Taiwan markets. Chinese and Hong Kong markets were generally soft, with the Hang Seng Index slightly down by 0.09%. The table below lists real-time data for major markets:
| Market | Index Name | Index Points | Change Points | Change (%) |
|---|---|---|---|---|
| Hong Kong | Hang Seng Index | 24040.00 | -20.99 | -0.09% |
| Mainland China | Shanghai Composite Index | 3382.14 | -6.59 | -0.19% |
| Japan | Nikkei 225 | 38542.00 | +230.67 | +0.60% |
| South Korea | KOSPI Index | 2953.26 | +6.60 | +0.22% |
| Taiwan | Taiwan Weighted Index | 22139.28 | +89.38 | +0.41% |
Key Points
- Asian stock markets displayed mixed performance, with capital mainly flowing into Japan and Taiwan markets, favoring banking, insurance, and real estate sectors.
- Geopolitical events and macroeconomic data are the primary factors affecting market volatility, and investors should closely monitor relevant policies and economic indicators.
- Market trading volume and capital flow indicators show cautious investor sentiment, with short-term capital flexibly adjusting positions and long-term capital maintaining a defensive stance.
- Sector rotation is evident, and investors should adopt diversified investment and flexible adjustment strategies, avoiding blind chasing of highs and taking profits timely.
- Foreign capital recently favored Taiwan and Japan markets, with changes in capital flows reflecting market risk appetite and allocation trends.
Midday Trends in Asian Stock Markets

Image Source: pexels
Major Indices
Asian stock markets showed divergent performance at midday today. Some markets rose, while others declined. The Nikkei 225 Index rose 0.60%, and the Taiwan Weighted Index also recorded a 0.41% gain, indicating capital flows into Japan and Taiwan markets. Chinese and Hong Kong markets were soft, with the Hang Seng Index slightly down by 0.09%. The KOSPI Index saw a modest 0.22% increase.
Easing concerns over Israel-Iran conflicts and falling oil prices impacted Asian stock markets. China’s May industrial production growth fell short of expectations, but retail sales exceeded forecasts, with a muted market response. Investors are focusing on upcoming monetary policy meetings of the U.S. Federal Reserve and the Bank of Japan, creating a strong wait-and-see atmosphere.
Capital flows and institutional movements during Asian stock market sessions are key observation indicators. Major institutions continued to sell nearly USD 5 billion, with trading volume of soon-to-be-ex-dividend ETFs reaching 320,000 lots, indicating evident sector rotation. Taiwan’s stock market surged over 270 points early in the session, breaking 22,300 points, driven by a USD 15 opening gain in TSMC’s stock price, strengthening the broader market. Foreign investors bought a net USD 47.3 billion last week, ending a streak of continuous selling, and heavily purchased 46,000 lots of TSMC.
- 10:30-12:00 is the “turning session”, where major players may start unloading, and the trend may reverse, with early session gains/losses and trading volume as key indicators.
- 12:00-13:30 is the “transition session,” with calmer trends as institutions and traders wrap up; Hong Kong markets are closed, suitable for day traders to clear positions, with trading volume and heavyweight stock performance as key data.
- 13:30-13:45 is the “closing session,” with spot markets closing and only futures trading, where price fluctuations are influenced by market expectations, allowing investors to observe the gap between the spot market and futures to predict trends.
Market Comparison
Asian stock markets showed divergent performance across major markets. Japan’s economic indicators remain negative, with the Economic Surprise Index indicating data underperformed market expectations. The yen fell below 154.00 against the USD, hitting a one-month low, reflecting market uncertainty and caution regarding the Bank of Japan’s policy outlook.
In contrast, emerging Asian markets like India and Indonesia showed greater resilience, driven by long-term themes such as urbanization, domestic consumption, infrastructure demand, and technological development. These markets face lower inflationary pressures, giving central banks more room to maneuver, with improved financing conditions and significantly stronger growth momentum and credit conditions compared to Japan.
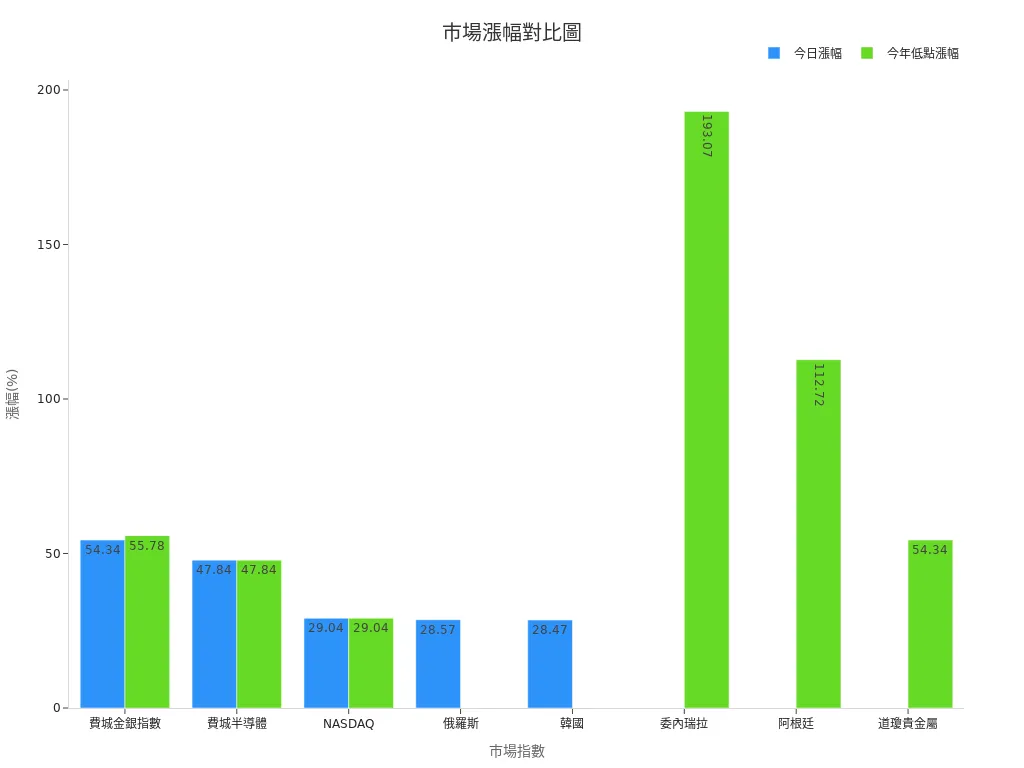
The table below compares today’s global major market gains, highlighting differences between Asian and other markets:
| Market Index | Today’s Gain (%) | Remarks |
|---|---|---|
| Philadelphia Gold & Silver Index | 54.34 | Highest gain today, most outstanding performance |
| Philadelphia Semiconductor Index | 47.84 | Outstanding performance |
| NASDAQ | 29.04 | Outstanding performance |
| Russia | 28.57 | Outstanding performance |
| South Korea | 28.47 | Outstanding performance |
Asian stock markets’ performance this year is also noteworthy. Venezuela and Argentina markets have risen 193.07% and 112.72%, respectively, from their yearly lows, indicating strong momentum in emerging markets. Indices like the Philadelphia Gold & Silver Index, Dow Precious Metals, and Philadelphia Semiconductor Index have also performed exceptionally well recently.
Overall, Asian stock markets show significant regional divergence. Taiwan’s market, driven by AI themes and heavyweight stocks, maintains high-level consolidation. Japan and South Korea markets are affected by exchange rate fluctuations and policy expectations, with cautious investor sentiment. China and Hong Kong markets underperformed due to weaker-than-expected economic data. Emerging markets like India and Indonesia demonstrate strong fundamental resilience, becoming focal points for capital.
Influencing Factors
Macro News
Recent Asian stock markets have been influenced by multiple macroeconomic data and policy news. The Reserve Bank of India announced a 25-basis-point rate cut on June 6, signaling policy adjustment intentions. India and ASEAN regions, benefiting from supply chain restructuring and demographic advantages, drive medium- to long-term economic growth expectations. India is gradually becoming a global manufacturing hub, with rising infrastructure demand. ASEAN countries, with expanding middle classes, see supported profit growth. These structural factors bring rich investment opportunities to Asian markets.
In China, the Consumer Price Index (CPI) data for May, released on June 9, remained in negative territory, with markets focusing on deflationary pressures. On the same day, China’s General Administration of Customs released trade balance data, and with the U.S.-China trade war truce, markets closely monitored export performance. The U.S. May non-farm payrolls report added 130,000 jobs, below April’s 177,000, reflecting U.S. economic pressures and indirectly affecting Asian market expectations.
Asia’s inflation rate is significantly lower than in Europe and the U.S., with limited impact from oil and food price surges caused by the Russia-Ukraine conflict. This lower inflationary environment helps stabilize investor sentiment and supports stock market performance.
Today’s Asian stock market volatility is primarily driven by economic indicators like GDP growth, CPI, and PPI. Market reactions depend on the gap between actual data and expectations. If economic data continues to exceed expectations, it will intensify market volatility and potentially alter trends.
Geopolitical Events
Geopolitical events continue to impact Asian stock markets. Recently, tensions in the Middle East raised concerns about rising inflationary pressures, prompting adjustments in global central bank policy expectations. Risks between Israel and Iran have not been fully resolved, and investors remain vigilant. The Russia-Ukraine conflict heightens global geopolitical risks, increasing market uncertainty.
Asian economies are actively adjusting policies to address external challenges. For example, Vietnam’s administrative reforms improved efficiency, saving approximately USD 4.5 billion, promoting economic growth. Japan’s Nikkei 225 Index is supported by corporate reforms and capital repatriation, but shifts in the Bank of Japan’s interest rate policy may affect foreign capital flows. China’s policy stimulus continues to drive rebounds in the CSI 300 and Hang Seng Indices, though real estate debt issues remain a pressure point.
- Recent foreign capital flow data shows Japan’s market attracted USD 2.541 billion in inflows, becoming a focal point for capital. Emerging markets saw minor outflows of USD 212 million.
- Asian investment-grade bonds, with high credit quality, low volatility, and low interest rate risk, serve as a safe haven in turbulent markets, attracting capital inflows.
Overall, changes in Middle East dynamics and foreign capital flows are directly reflected in market volatility and index movements, with investors’ risk appetite and hedging attitudes adjusting accordingly, further influencing short-term Asian stock market trends.
Capital Flows

Image Source: pexels
Sector Focus
Today’s Asian stock market capital flows show clear sector rotation. Main institutional funds (including funds, social security, QFII, and insurance) recorded a net outflow of approximately USD 3.624 billion, with insurance funds showing the largest outflow. Influenced by central bank rate hikes, institutional outflows intensified, but overall market sentiment remained active, with retail investors buying on dips, driving a volatile upward market trend.
Capital flows were concentrated in the following sectors:
- Banking stocks saw the most significant inflows today, with institutional net inflows reaching USD 1.556 billion, marking the second consecutive week of institutional favor. Hong Kong’s banking sector performed strongly, with sustained inflows, reflecting growing investor confidence in financials.
- Insurance stocks recorded net inflows of USD 576 million, with China Pacific Insurance’s stock price rising 11.45%, becoming a market focus.
- Real estate and construction materials sectors saw net inflows of USD 352 million and USD 239 million, respectively, indicating increased short-term capital allocation to traditional industries.
- Consumer, agriculture, emerging industries, coal and oil, automotive, food and beverage, and brokerage sectors also recorded inflows, reflecting clear sector rotation and speculative characteristics.
Conversely, sectors like chemicals, non-ferrous metals, pharmaceuticals, power equipment, and electronics saw significant net outflows. The chemical sector had a net outflow of USD 902 million, and non-ferrous metals saw USD 684 million in outflows, indicating rising short-term risk aversion among institutional investors.
Today’s total market turnover was approximately USD 454.4 billion, up USD 98.8 billion from the previous day, with net capital inflows of about USD 13.7 billion. The reversal of institutional outflows and inflows across sectors indicates capital is primarily engaged in sector rotation and speculation, with a strong short-term trading atmosphere.
Asian Stock Market Capital Flows
Capital flows in Asian stock markets have been volatile over the past week, with market sentiment turning cautious. Despite net institutional outflows, retail capital actively entered, pushing some sectors upward. From foreign capital flows, Taiwan and Japan markets stood out, attracting significant foreign inflows.
The table below shows foreign capital flows in Taiwan, South Korea, and Japan markets at the end of September 2024 and February 2025:
| Time Point | Market | Foreign Capital Flow (Net Buy/Sell, USD Billion) |
|---|---|---|
| End of September 2024 | Taiwan | +32.27 |
| End of September 2024 | South Korea | -6.57 |
| End of September 2024 | Japan | +9.11 |
| End of February 2025 | Taiwan | -36.52 |
| End of February 2025 | South Korea | -17.78 |
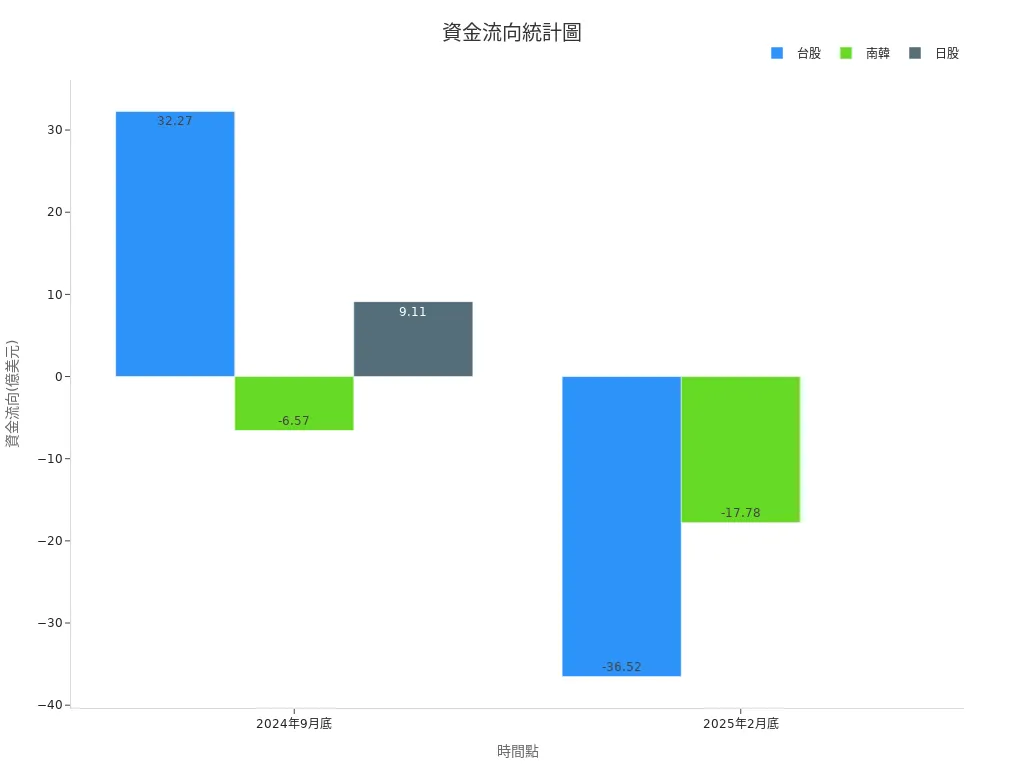
At the end of September 2024, foreign capital significantly flowed into Taiwan (+USD 32.27 billion) and Japan (+USD 9.11 billion), reflecting international capital preference for these markets. South Korea recorded a slight outflow (-USD 6.57 billion). By the end of February 2025, foreign capital shifted to significant outflows from Taiwan (-USD 36.52 billion) and South Korea (-USD 17.78 billion), indicating a clear change in capital preference. Other Asian markets also saw net foreign selling, reflecting declining risk appetite.
Overall, Asian stock market capital flows show sector rotation and regional divergence. Traditional sectors like banking, insurance, and real estate gained capital favor, while technology, pharmaceuticals, and non-ferrous metals faced outflow pressures. Foreign capital flow trends into Taiwan and Japan markets serve as key references for regional capital allocation.
Market Sentiment
Trading Volume
Today’s Asian stock market sentiment is primarily reflected through trading volume and net capital inflow indicators. Professional investors typically refer to the following statistical data to gauge market atmosphere:
- Trading Volume multiplied by Typical Price can calculate daily capital inflows or outflows.
- Money Flow Ratio is defined as the sum of positive capital inflows over the past 14 days divided by the sum of negative capital inflows.
- Money Flow Index (MFI) is calculated as: MFI = 100 – 100 / (1 + Money Flow Ratio), with values ranging from 0 to 100.
- Typical Price is calculated as: (High + Low + Close) / 3.
- When the MFI exceeds 80, the market is overbought; below 20, it is oversold, helping measure market sentiment.
According to the latest data, today’s market trading volume indicators have significantly slowed compared to historical periods. Taking the Bitcoin market as an example, active supply peaked at about 4 million Bitcoins in early April, dropping to about 3.1 million by early June, indicating declining market activity. This phenomenon is also reflected in major Asian stock markets, with reduced investor trading willingness.
Investor Behavior
In terms of investor behavior, short-term trading trends are evident. Some capital opts for quick entries and exits during sector rotation, particularly in traditional sectors like banking, insurance, and real estate. Markets observed that when the MFI approaches overbought zones, some investors take profits to reduce position risks. Conversely, when the MFI nears oversold zones, retail capital tends to buy on dips, driving short-term market rebounds.
Professional analysts note that declining money flow indicators alongside trading volume reflect cautious market sentiment. Investors are generally adopting a wait-and-see stance, awaiting more macroeconomic data and policy signals. Short-term capital prefers flexible position adjustments, while long-term capital maintains defensive allocations, with the overall market atmosphere leaning conservative.
Asian stock markets at midday show sector rotation, with capital focusing on traditional industries like banking, insurance, and real estate. Semiconductors and AI themes remain strong, but investors should be wary of high valuation risks. In the short term, diversified operations and flexible adjustment strategies are recommended, avoiding blind price chasing. Multiple economic data and policy decisions in mid-June will influence market volatility, and investors should closely monitor and flexibly allocate capital.
FAQ
What are the characteristics of midday capital flows in Asian stock markets?
Midday capital flows in Asian stock markets show sector rotation. Traditional industries like banking, insurance, and real estate gained capital favor. Technology and pharmaceutical sectors saw outflows. Foreign capital prefers Taiwan and Japan markets.
Which Asian markets have seen more foreign capital inflows recently?
Foreign capital has primarily flowed into Taiwan and Japan markets recently. According to the latest data, Taiwan and Japan recorded net inflows exceeding USD 3 billion and USD 900 million, respectively.
What are the main factors affecting short-term volatility in Asian stock markets?
Geopolitical events, macroeconomic data, and policy news are the main influencing factors. Middle East tensions, central bank rate decisions, and Chinese economic data directly impact market trends.
How should investors respond to sector rotation?
Investors can adopt diversified investment strategies, flexibly adjusting positions. Monitor trading volume and money flow indicators, avoid chasing highs, and take profits timely.
What changes have occurred in Asian stock market trading volumes?
| Indicator | Recent Change |
|---|---|
| Total Trading Volume | Slowed compared to historical periods |
| Money Flow Indicator | Showing a downward trend |
Reduced trading volume reflects rising wait-and-see sentiment.
In 2025, Asian stock markets at midday show divergence, with Japan and Taiwan drawing inflows, particularly in banking and insurance sectors, requiring investors to navigate volatility and sector rotation. BiyaPay empowers you to seize market opportunities, enabling investment in U.S. and Hong Kong stocks through one account, bypassing complex setups for these markets. Access a wealth management product with up to 5.48% annualized returns, offering flexible withdrawals to balance stock trading and stable yields.
BiyaPay’s real-time currency conversions and rate queries keep costs as low as 0.5%, boosting investment efficiency. Regulated by international financial authorities, it ensures secure transactions. Visit BiyaPay today to start investing in U.S. and Hong Kong stocks, capitalizing on Asian market dynamics!
*This article is provided for general information purposes and does not constitute legal, tax or other professional advice from BiyaPay or its subsidiaries and its affiliates, and it is not intended as a substitute for obtaining advice from a financial advisor or any other professional.
We make no representations, warranties or warranties, express or implied, as to the accuracy, completeness or timeliness of the contents of this publication.


Contact Us
Company and Team
BiyaPay Products
Customer Services


is a broker-dealer registered with the U.S. Securities and Exchange Commission (SEC) (No.: 802-127417), member of the Financial Industry Regulatory Authority (FINRA) (CRD: 325027), member of the Securities Investor Protection Corporation (SIPC), and regulated by FINRA and SEC.
registered with the US Financial Crimes Enforcement Network (FinCEN), as a Money Services Business (MSB), registration number: 31000218637349, and regulated by FinCEN.
registered as Financial Service Provider (FSP number: FSP1007221) in New Zealand, and is a member of the Financial Dispute Resolution Scheme, a New Zealand independent dispute resolution service provider.