- EasyCard
- Trade
- Help
- Announcement
- Academy
- SWIFT Code
- Iban Number
- Referral
- Customer Service
- Blog
- Creator
Latest Hang Seng Index ADR Quotes: Essential Reading Before HK Stock Market Opens


Image Source: pexels
Today’s Hang Seng Index ADR quotes show that HSBC, Meituan, Tencent, Xiaomi, and HKEX ADRs are all higher than their HK stock closing prices, with gains ranging from 0.72% to 1.74%. Chinese concept stocks like Alibaba and JD.com also recorded gains. The Hang Seng Index futures rose 119 points overnight, and the market expects a positive reaction at the HK stock market opening. Investors can use Hang Seng Index ADRs to gauge the pre-market movements of major constituents, providing real-time reference for formulating investment strategies.
Key Points
- Hang Seng Index ADRs reflect the U.S. market’s real-time evaluation of major HK stock constituents, aiding investors in predicting HK stock market opening trends.
- Major constituents like HSBC, Tencent, and Meituan ADRs generally rose, indicating increased market confidence in banking and select tech stocks.
- Tech and semiconductor sectors are highly sensitive to ADR price movements, and investors should closely monitor related data to adjust portfolio strategies.
- Easing international tensions and strong U.S. economic data boost market risk appetite, driving HK stocks and ADR prices higher.
- Experts recommend combining ADR, overnight futures, and historical sensitivity analysis to flexibly adjust portfolios and diversify risks to address market volatility.
Hang Seng Index ADR Quotes
Image Source: pexels
Overview of Major Constituents
As an important reference indicator before the HK stock market opens, Hang Seng Index ADRs instantly reflect the performance of major constituents in the U.S. market. Below are the latest ADR quotes for major constituents and their comparison with yesterday’s HK stock closing prices:
| Stock Name | ADR Price | Change vs. HK Stock | Equivalent HKD Price |
|---|---|---|---|
| HSBC | N/A | Up 2.06% | 94.5 HKD |
| Alibaba | 116.62 USD | Down 1.44% | N/A |
| Tencent | N/A | Up 1.04% | 515.3 HKD |
| Meituan | N/A | Up 0.90% | 142.3 HKD |
| JD.com | 33.61 USD | Down 0.36% | N/A |
The above data comes from market reports from June 13 to 14, 2025, reflecting the real-time trends of Hang Seng Index ADRs in the U.S. market. Investors can use this data to anticipate potential trends at the HK stock market opening.
Comparison of Gains and Losses
The gains and losses in Hang Seng Index ADRs directly reflect the U.S. market’s latest evaluation of major HK stock constituents. HSBC’s ADR was 2.06% higher than its HK stock closing price, indicating strong market confidence in the Hong Kong banking sector. Alibaba’s ADR fell 1.44%, reflecting pressure on some tech stocks. Tencent and Meituan ADRs rose 1.04% and 0.90%, respectively, while JD.com slightly declined by 0.36%, showing a mixed performance in the tech sector.
Some blue-chip stocks, such as CK Hutchison and CLP Holdings, recorded ADR premiums of 0.85% to 1.16%, indicating a preference for defensive assets. Historical data shows that when U.S. stocks hit new highs, Hang Seng Index ADRs generally rise, pushing HK stocks to open higher. For example, HSBC ADR rose 2.5%, Tencent ADR rose 0.7%, and AIA ADR rose nearly 1%, collectively contributing over 130 points to the Hang Seng Index, reflecting the close correlation between Hang Seng Index ADRs and the HK stock index.
- Recently, the five major tech giants (Meta, Apple, Alphabet, Microsoft, Amazon) all rose, supporting market sentiment and boosting related Chinese tech stock ADRs.
- Philadelphia Semiconductor Index constituents like AMD, NVIDIA, and Applied Materials surged strongly, further driving tech sector ADR gains.
- Optimistic sentiment regarding geopolitical and trade agreements is also reflected in the gains of Hang Seng Index ADRs.
Additionally, TSMC’s ADR rose for nine consecutive days, with a premium rate as high as 21.7%, directly reflecting market enthusiasm and confidence in the tech sector. The real-time data of Hang Seng Index ADRs has become a critical basis for investors to judge HK stock market opening trends.
Opening Trend Forecast
Image Source: unsplash
Morning Session Expectations
Based on the latest Hang Seng Index ADR and overnight futures data, the market generally expects the Hang Seng Index to open 46 to 57 points higher in the morning session. The U.S. April non-farm payroll added 177,000 jobs, far exceeding market expectations of 133,000, indicating a robust U.S. economic foundation. U.S. major indices rose across the board in early trading, with the Dow Jones Industrial Average surging 450 points (about 1.1%), the S&P 500 rising 1%, and the Nasdaq climbing 0.7%. TSMC’s ADR also jumped over 3%. These data reflect a recovery in market confidence, providing positive support for the HK stock market’s morning session.
- April non-farm payroll added 177,000 jobs, exceeding expectations
- Dow Jones Industrial Average rose 450 points (about 1.1%)
- S&P 500 rose 1%
- Nasdaq rose 0.7%
- TSMC ADR surged over 3%
- Strong U.S. stock and ADR performance, with overnight futures rising in tandem
As a key indicator of HK stock market opening trends, Hang Seng Index ADRs instantly reflect U.S. market evaluations of major HK constituents. Historical data shows that when ADRs and overnight futures rise simultaneously, the likelihood of the Hang Seng Index opening higher increases significantly. Forecasting models often use metrics like accuracy, precision, and recall, validated through data segmentation and cross-validation methods. These approaches are widely applied to morning session trend forecasts, enhancing model reliability.
Affected Sectors
Based on historical data, tech and semiconductor sectors are most sensitive to ADR price movements. The table below summarizes the sensitivity of major sectors and stocks to ADR changes:
| Sector/Stock | ADR Price Change | Sensitivity Description |
|---|---|---|
| TSMC ADR | Down 0.82% | Tech sector representative, significant price volatility |
| ASE ADR | Down 3.82% | Tech sector, large price volatility |
| UMC ADR | Down 1.84% | Tech sector, significant price volatility |
| Philadelphia Semiconductor Index Constituents | AMD down 3.45%, NVIDIA down 2.75%, Applied Materials down 3.24%, Micron down 3.18% | High sensitivity in the semiconductor sector overall |
| Energy, Real Estate, Materials Sectors | Led declines in S&P 11 sectors | Sensitivity to ADR not explicitly stated |
| Healthcare, Consumer Staples, Communication Services Sectors | Strengthened | Sensitivity to ADR not explicitly stated |
Tech and semiconductor stocks like TSMC, ASE, and UMC react quickly to ADR price movements. When semiconductor-related ADRs fall, HK stocks often face pressure at opening. The chart below shows recent percentage declines for major semiconductor stocks and indices, helping investors identify sectors most affected by ADRs:
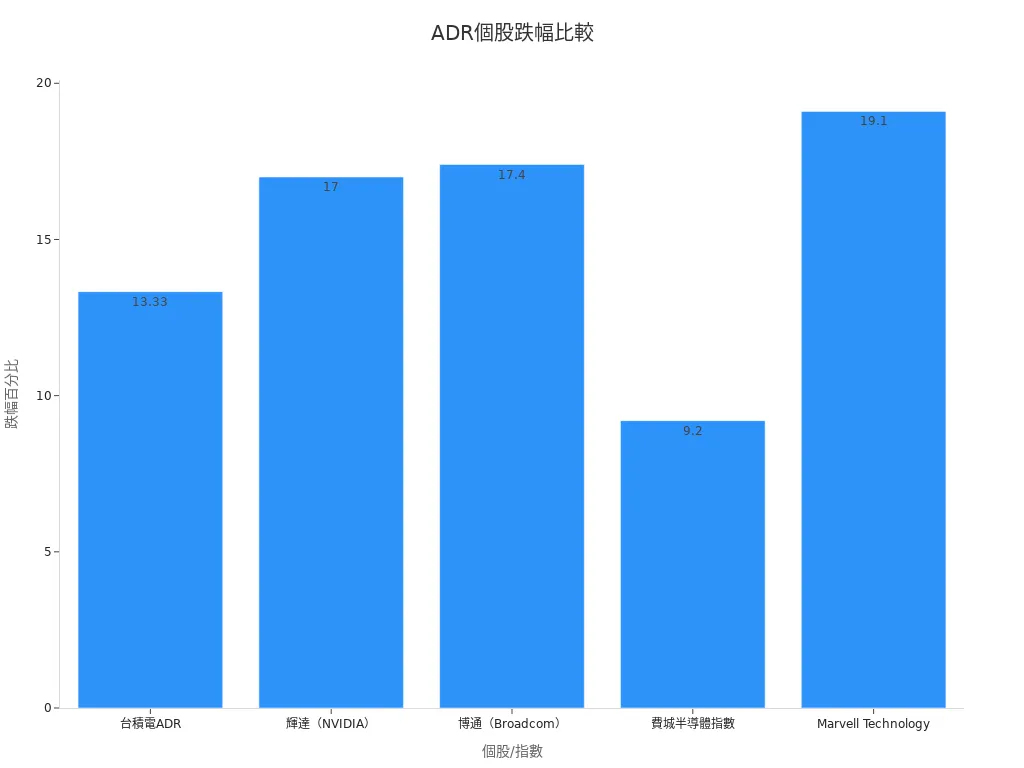
| Stock/Index | Decline Percentage |
|---|---|
| TSMC ADR | 13.33% |
| NVIDIA | Approx. 17% |
| Broadcom | 17.4% |
| Philadelphia Semiconductor Index | 9.2% |
| Marvell Technology | 19.1% |
Beyond tech and semiconductors, Hong Kong banking stocks like HSBC are often influenced by ADR movements. When HSBC’s ADR rises, HK banking stocks typically open higher. ADR fluctuations in Chinese tech stocks like Alibaba and Tencent also directly impact HK stock market openings. Hang Seng Index ADR real-time data has become a vital basis for investors to assess morning trends and sector rotations.
Experts recommend that investors closely monitor ADR and overnight futures data and combine historical sensitivity analysis to flexibly adjust portfolio strategies.
Market Dynamics
International and Local News
Market sentiment has recently improved significantly. Easing conflicts in the Middle East have driven a rebound in major global stock markets. U.S. markets stabilized quickly after geopolitical tensions, with reduced safe-haven sentiment and rising investor risk appetite. The U.S. April Consumer Price Index (CPI) annual growth rate was only 2.3%, below expectations, easing inflationary pressures. The Federal Reserve’s policy rate expectations remain unchanged, with markets focusing on future rate cut possibilities. Saudi Arabia pledged 600 billion USD in investments to the U.S., covering AI data centers, energy, military, and aircraft procurement, boosting tech stocks to lead U.S. market gains. NVIDIA’s chip supply plan also stimulated AI industry growth, with NVDA stock surging 5.63% in a single day.
| Indicator/Event | Specific Data | Market Reaction and Impact |
|---|---|---|
| Saudi Arabia’s U.S. Investment Pledge | 600 billion USD | S&P 500 rose 0.72% |
| NVIDIA Chip Supply | Hundreds of thousands over five years | NVDA stock surged 5.63% |
| U.S. April CPI Annual Growth Rate | 2.3% | Eased inflation pressure, boosted market confidence |
| Copper Futures Price | Up 0.78% | Warming industrial metal demand |
| Gold Price | Up 0.43% | Persistent safe-haven demand |
| 10-Year Treasury Yield | Slightly fell to 4.47% | Rising bond prices, increased risk appetite |
| Europe 600 Index | Up 0.12% | Boosted by positive U.S.-China trade negotiation progress |
| Japan Topix Index | Up 1.1% | Improved risk appetite |

Additionally, U.S. major indices recently showed divergence, with growth stocks leading gains. Market focus is shifting to upcoming U.S. retail sales reports and Federal Reserve policy meetings. Safe-haven assets like gold and long-term U.S. Treasuries fell in price, while Bitcoin rebounded, reflecting increased risk appetite. Israeli currency and the TA 125 Index have recovered from lows, indicating market stabilization. Crude oil prices rose about 5.5% since the Red Sea incident but have recently stabilized.
Investor Trends
Investor confidence has risen with easing international tensions. Alibaba’s ADR and HK stocks both gained over 1%, reflecting active capital inflows into the tech sector. Consumer confidence declined, with lingering concerns about economic prospects, but strong U.S. stock performance drove ADR prices higher. Policy issues and international news continue to influence TSMC ADR and overall tech stock trends. The Nasdaq fell 260 points, indicating that international market volatility directly impacts ADR prices.
- U.S. stock market rebound, reduced safe-haven sentiment, and increased investor risk appetite.
- Stabilized global energy supply chains, with strong rebounds in tech, non-essential consumer goods, and communication services stocks.
- Market expects Federal Reserve policy rates to remain unchanged, with investors anticipating future rate cuts.
- Gold prices hit a weekly high in Asia’s early session on June 12, 2024, reflecting persistent safe-haven demand.
Investors should closely monitor the timeliness of ADR data. Some ADR quotes are real-time streams, while others have over-the-counter trading delays. It’s recommended to cross-reference multiple data sources, exercise caution in judging market trends, and flexibly adjust investment strategies.
Expert Insights
Market Outlook
Multiple market analysts believe that HK stocks will be driven by global economic data and tech sector performance in the short term. Experts note that recent strong U.S. non-farm payroll data has driven capital toward risk assets. Analysts recommend investors closely monitor the following statistical data to validate market trend forecasts:
- Surveys and phone interviews can quickly capture consumer behavior and market structures, aiding in predicting capital flows.
- Using tools like Excel, Tableau, and Power BI to organize data helps uncover market trends and potential risks.
- Monitoring abnormal sales fluctuations and key business metrics can detect market turning points early.
- Churn rates and promotional strategy effectiveness reflect changes in corporate fundamentals.
Historical cases show that scenario analysis and PEST analysis effectively assess market risks. For example, the tech industry often uses big data to analyze consumer trends and adjust product strategies. War game analysis helps companies simulate different market scenarios, enhancing their ability to respond to sudden events.
Investment Recommendations
Experts suggest investors adjust portfolio structures based on individual stock risk volatility metrics. The following data helps assess stock risks:
- Standard Deviation: Reflects return volatility; higher values indicate higher risk.
- Sharpe Ratio: Evaluates return efficiency per unit of risk; higher values indicate better portfolio performance.
- Beta: Shows a stock’s volatility relative to the market; a Beta greater than 1 indicates higher volatility.
- Interest and Exchange Rate Risks: USD interest rates and exchange rate changes affect HK stocks and related asset prices.
- Default and Recovery Rates: Particularly relevant for bond investments; higher default rates increase risk.
Experts remind that during heightened market volatility, investors should closely monitor data update frequency, flexibly adjust strategies, and diversify investments to reduce risk. Continuously tracking ADR and overnight futures data helps capture the latest trends before the HK stock market opens.
Today’s Hang Seng Index ADR performance significantly influences the HK stock market opening. The table below shows key indicators and gains:
| Indicator | Value | Description |
|---|---|---|
| TSMC ADR Gain | 2.42% | Closed at 202.67 USD |
| UMC ADR Gain | 1.68% | Indicates ADR price increase |
| ASE ADR Gain | 2.42% | Indicates ADR price increase |
| Taiwan Index Futures Opening | Up 160 points | Closely tied to ADR gains |
These data reflect that Hang Seng Index ADRs can instantly signal market trends. Investors should continuously monitor market dynamics and data timeliness, refer to expert insights, and prudently formulate investment strategies.
FAQ
What is a Hang Seng Index ADR?
A Hang Seng Index ADR refers to depositary receipts listed on U.S. exchanges representing major HK stock constituents. Investors can use ADRs to observe the U.S. market’s real-time evaluation of HK stocks.
How do ADR prices affect HK stock market openings?
ADR prices reflect U.S. market expectations for related HK stocks. If ADRs rise, HK stocks are likely to open higher. If ADRs fall, HK stocks may face pressure at opening.
How should investors interpret the gap between ADR and HK stock closing prices?
Investors can compare ADR prices in HKD equivalent with yesterday’s HK stock closing prices. A large gap indicates significant market expectation changes, warranting attention to opening trends.
Are ADR quotes real-time? Is there a delay risk?
Some ADR quotes are real-time streams, while others have over-the-counter trading delays. Investors should cross-reference multiple data sources to reduce risks from information delays.
Are Hang Seng Index ADRs suitable for all investors?
Hang Seng Index ADRs are suitable for investors focused on HK stock market opening trends. Both novices and professionals can use ADR data as a market reference indicator.
In 2025, the dynamic Hong Kong stock market relies on Hang Seng Index ADR quotes as a critical pre-market indicator for tracking movements in key constituents like HSBC, Tencent, and Meituan. BiyaPay offers a seamless financial solution, enabling Hong Kong and U.S. stock trading with a single account, alongside a wealth management product offering up to 5.48% annualized return, accessible anytime with flexible withdrawals—no additional overseas accounts needed. Start now at BiyaPay!
BiyaPay supports real-time conversions across multiple fiat and digital currencies with transparent rate queries, minimizing costs with remittance fees as low as 0.5%. Regulated by international financial authorities, it ensures secure, reliable transactions, empowering you to adjust strategies based on ADR and after-hours data for enhanced trading efficiency. Visit BiyaPay today to seize financial opportunities!
*This article is provided for general information purposes and does not constitute legal, tax or other professional advice from BiyaPay or its subsidiaries and its affiliates, and it is not intended as a substitute for obtaining advice from a financial advisor or any other professional.
We make no representations, warranties or warranties, express or implied, as to the accuracy, completeness or timeliness of the contents of this publication.


Contact Us
Company and Team
BiyaPay Products
Customer Services


is a broker-dealer registered with the U.S. Securities and Exchange Commission (SEC) (No.: 802-127417), member of the Financial Industry Regulatory Authority (FINRA) (CRD: 325027), member of the Securities Investor Protection Corporation (SIPC), and regulated by FINRA and SEC.
registered with the US Financial Crimes Enforcement Network (FinCEN), as a Money Services Business (MSB), registration number: 31000218637349, and regulated by FinCEN.
registered as Financial Service Provider (FSP number: FSP1007221) in New Zealand, and is a member of the Financial Dispute Resolution Scheme, a New Zealand independent dispute resolution service provider.