What Is the Dow Jones Industrial Average? Investment Differences vs. S&P 500 and Nasdaq


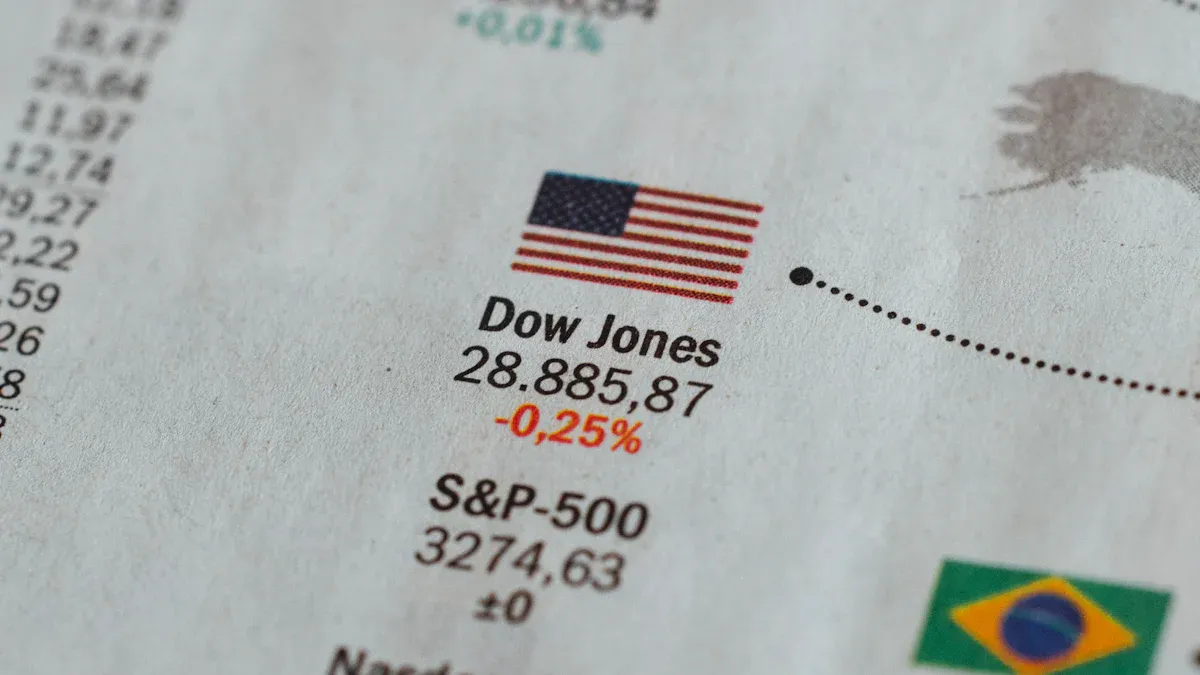
Image Source: unsplash
When you start investing in U.S. stocks, you will definitely hear about the “Dow Jones Industrial Average,” “S&P 500,” and “Nasdaq” — the three major indices. Many investors often hear these names but only have a vague understanding of the differences between them.
If the Dow is a steady cornerstone, the S&P 500 is the full landscape, and Nasdaq is the trend of the future — where should your money go?
Key Takeaways
- The Dow Jones represents 30 large blue-chip U.S. stocks and uses price weighting, making it suitable for investors seeking stability.
- The S&P 500 includes about 500 companies and best reflects the overall U.S. economy, ideal for those seeking market-average returns.
- The Nasdaq is dominated by technology and growth companies, offering higher volatility and suitable for aggressive investors chasing high returns.
- Investors cannot directly buy or sell indices but can invest through ETFs that track these indices.
- Choosing which index depends on the investor’s goals, risk tolerance, and view of the market.
Quick Overview of the Three Major Indices: Core Differences in One Table
Before diving into each index, let’s use a summary table to quickly grasp the most essential differences among the three major indices. This table helps you build a clear framework and understand the role each plays.
| Feature | Dow Jones Industrial Average (DJIA) | S&P 500 Index | Nasdaq Composite Index |
|---|---|---|---|
| Number of Constituents | 30 | ~500 | Over 3,000 |
| Weighting Method | Price-weighted | Market-cap weighted | Market-cap weighted |
| Represented Sectors | Large blue-chips covering finance, healthcare, industrials, etc. | Covers 11 major sectors, best reflecting the full U.S. economy | Dominated by technology, biotech, and growth companies |
| Market Coverage | Relatively low, limited representativeness | ~80% of total U.S. market cap | Covers most companies listed on Nasdaq exchange |
Number of Constituents and Selection Criteria
As shown in the table, the number of constituents varies dramatically. The Dow Jones Industrial Average includes only 30 companies, and its selection is done by a committee rather than strict quantitative standards, focusing more on reputation, sustained growth, and investor interest.
In contrast, the S&P 500 has much stricter inclusion criteria. Companies must meet clear financial requirements, such as an unadjusted market cap of at least $6.1 billion and positive total earnings over the most recent four quarters. This ensures that only sizable and financially sound companies enter the index.
Impact of Index Weighting Method
The “weighting method” determines how much influence a single company has on the index movement. Both the S&P 500 and Nasdaq use “market-cap weighting” — the larger the company (higher market cap), the greater its price change impacts the index.
The Dow’s unique “price weighting,” however, is completely different — it only looks at share price, regardless of company size.
A vivid analogy can help you understand:
- Price weighting (Dow) is like a dinner party — whoever brings the most expensive dish (highest price per share) has the loudest voice at the table, even if the portion is tiny.
- Market-cap weighting (S&P 500/Nasdaq) is like a community meeting — whoever owns the most assets has the strongest voice, more accurately reflecting real influence.
Thus, in the Dow, a $500 stock has ten times the influence of a $50 stock, even if the lower-priced stock belongs to a much larger company by market value.
Represented Sectors and Market Positioning
Finally, the three indices have very different market positioning:
- Dow: Represents America’s top, most mature “blue-chip” companies — a symbol of the industrial era.
- S&P 500: Widely regarded as the “thermometer” of U.S. stocks because it broadly covers all major sectors and best reflects overall economic health.
- Nasdaq: The synonym for “technology and innovation,” gathering numerous companies leading the future.
Dow Jones Industrial Average (DJIA): America’s Steady Industrial Cornerstone

Image Source: unsplash
The Dow Jones Industrial Average has a very long history — created in 1896, it is like a living fossil of the U.S. economy, witnessing countless market changes. However, you need to understand that it consists of only 30 large “blue-chip” companies. Although these companies are highly reputable, their small number means it cannot fully represent the entire U.S. economy.
Historic Blue-Chip Representative
The Dow Jones constituents are selected by a committee from The Wall Street Journal, with standards focusing more on long-term reputation, steady growth record, and status in investors’ minds. It represents America’s very top, most mature group of enterprises. Yet with only 30 companies, its representativeness is far less broad than the S&P 500.
Uniqueness of Price-Weighting Method
The most distinctive feature of this index is its unique “price-weighting method.” Unlike market-cap weighting that looks at total company size, its calculation only considers share price.
This creates an interesting phenomenon: the higher the share price, the greater the influence on the index, regardless of the company’s total market cap.
For example:
- A stock at $300 has ten times the influence of a $30 stock on a $1 price move.
- If higher-priced Apple falls 10% while lower-priced Intel rises 20%, the index may still fall overall due to Apple’s larger weighting despite Intel’s superior performance.
This calculation method is the most controversial aspect of the Dow because it may not truly reflect structural changes in the market.
Representative Constituents and Sector Distribution
Although the name includes “Industrial,” today’s Dow has long transcended traditional industry. Its constituents cover finance, technology, healthcare, consumer, and more. You can find giants like Microsoft, UnitedHealth (UnitedHealth Group), and Goldman Sachs across various sectors. Overall, it represents a group of mature, stable, globally influential high-quality companies.
S&P 500 Index: The Thermometer of the U.S. Economy
If the Dow is a hand-picked honor roll, the S&P 500 is the overall performance of the entire grade. It is widely regarded as the “thermometer” for gauging U.S. economic health because it covers about 80% of total U.S. market capitalization and is the benchmark most referenced by professional investors worldwide.
Broad Market Coverage
The S&P 500 includes about 500 top U.S.-listed companies across 11 major sectors. Unlike the Dow’s mere 30 names, the S&P 500’s breadth makes it far better at reflecting the true pulse of the overall U.S. market. Investing in the S&P 500 is essentially diversified exposure to a basket of America’s most representative companies.
Advantages of Market-Cap Weighting
The S&P 500 uses “market-cap weighting” — a very intuitive and fair mechanism. Simply put, the larger the company (higher market cap), the higher its weight in the index and the greater its price impact.
Market-cap weighting is like a shareholders’ meeting — those with more shares have louder voices. This ensures the index movement truly reflects the performance of the market’s most influential companies.
This weighting method sensitively captures shifts in economic structure. For example:
- Thirty years ago, consumer staples held significant weight.
- Today, technology has become dominant, accounting for about 30% of the index.
- The combined market cap of the top 20 companies is roughly equal to one quarter of U.S. GDP, showing the enormous economic influence of these giants.
Representative Constituents and Sector Distribution
The S&P 500 constituents include household names like Microsoft, Apple, and Amazon. Due to market-cap weighting, tech giants dominate. For instance, Nvidia’s weight changes can significantly move the index daily.
| Rank | Company | Weight |
|---|---|---|
| 1 | Nvidia | 7.06% |
Overall, the S&P 500 offers a broad yet realistic view of market structure and is an indispensable tool for understanding overall U.S. economic performance.
Nasdaq Index: The Future Indicator of Tech Innovation
When you hear “Nasdaq,” you probably think of world-changing tech giants like Apple, Nvidia, and Amazon. Exactly — the Nasdaq Composite Index is synonymous with global technology and growth companies, representing imagination about the future and investment trends.
Cradle of Technology and Growth Stocks
Unlike the Dow’s 30 blue-chips or the S&P 500’s 500 large firms, the Nasdaq Composite includes over 3,000 companies listed on the Nasdaq exchange. It is a vibrant market gathering numerous high-growth tech, biotech, and internet companies. If you are bullish on innovative technology’s future potential, the Nasdaq is the index you must watch.
Market-Cap Weighting and High Tech Concentration
The Nasdaq, like the S&P 500, uses “market-cap weighting” — larger companies have greater influence. However, Nasdaq’s biggest characteristic is its extremely high tech stock concentration.
In recent years, the so-called “Magnificent Seven” mega-cap tech stocks have vastly outperformed, even distorting index returns.
One analyst noted: “The Magnificent Seven and other companies causing high concentration have pushed market-cap-weighted indices to new highs while equal-weighted indices lag.”
This means the rise or fall of just a few giants can dictate the entire index. For example:
- Nvidia, Microsoft, and Apple alone account for over 30% of the index weight.
- In 2023, the Magnificent Seven collectively rose an astonishing 75.71%, while the broader S&P 500 returned 24.23%.
Representative Constituents and Sector Distribution
The Nasdaq constituents are star-studded, including nearly all well-known tech behemoths. The table below lists the top 10 by weight as of December 31, 2024, clearly showing tech dominance.
| Company Name | Ticker | Weight (as of Dec 31, 2024) |
|---|---|---|
| Apple | AAPL | 12.05% |
| Nvidia | NVDA | 10.47% |
| Microsoft | MSFT | 9.98% |
| Amazon | AMZN | 7.34% |
| Tesla | TSLA | 4.13% |
| Meta Platforms | META | 4.06% |
| Alphabet Class A | GOOGL | 3.52% |
| Broadcom | AVGO | 3.45% |
| Alphabet Class C | GOOG | 3.35% |
| Costco | COST | 1.29% |
Overall, technology companies account for about 60% of the Nasdaq Composite, with the rest spread across consumer, healthcare, etc. This high concentration makes it the best gauge of technology sector prosperity and growth potential.
Investment Pros & Cons Comparison: Which Index Should You Choose?

Image Source: pexels
After understanding the definitions of the three major indices, the most important question arises: from an investment perspective, which should you choose? There is no standard answer — it depends on your investment goals, risk tolerance, and market outlook. Let’s compare their pros and cons from four practical angles.
Risk and Volatility Analysis
In the investment world, risk and reward are two sides of the same coin. Generally, higher potential returns come with greater price swings.
- Nasdaq Index (High Risk, High Volatility): Due to heavy concentration in tech and growth companies, Nasdaq is the most volatile of the three. When the market is optimistic and chasing growth, it can deliver astonishing gains; but during panic or rate hikes, it often suffers the sharpest drops. For example, during the COVID-19 market crash in March 2020, the Dow Jones Industrial Averagefell 26% in four days, and the tech-heavy Nasdaq also experienced violent swings.
- Dow Jones Industrial Average (Lower Risk, Lower Volatility): Composed of 30 mature blue-chips with stable businesses and abundant cash flows, the Dow is seen as a relatively steady choice with better defensiveness during market turmoil.
- S&P 500 Index (Medium Risk, Medium Volatility): Sits between the two — more diversified than the Dow and less concentrated than Nasdaq.
Investment Tip: Although the Dow is known for stability, the S&P 500 — thanks to its broad sector diversification — is also viewed by many conservative and balanced investors as a core portfolio holding. It offers participation in overall market growth while spreading single-sector risk.
Long-Term Return Potential Assessment
Reviewing long-term historical returns helps reveal each index’s “personality.” While past performance is not indicative of future results, it remains highly valuable reference.
Historical data shows the power of technological innovation in long-term returns. Over the past 20 years, the Nasdaq Composite delivered an annualized return of 10.9%, the strongest performer; the S&P 500 achieved 9.8% (with dividends reinvested); while the Dow Jones returned 6.7% annualized.
The table below compiles longer-term return data to give you a clearer view of long-term market trends:
| Period | Average Annualized Return (incl. dividends reinvested, inflation-adjusted) |
|---|---|
| 10 Years (2014 – 2024) | 11.01% |
| 20 Years (2004 – 2024) | 8.87% |
| 30 Years (1994 – 2024) | 9.33% |
Looking ahead, corporate earnings growth is the core driver of stock prices. Analysts estimate 2025 S&P 500 earnings growth at around 9.5%, with some strategists forecasting 13% to 15% growth in 2026 and 2027. This shows continued optimism about the future profitability of large U.S. companies.
Sector Concentration vs. Diversification
“Don’t put all your eggs in one basket” perfectly captures the importance of diversification.
- Nasdaq Index (Highly Concentrated): This is both its strength and weakness. Over 60% weight in technology lets you directly ride the tech wave but also means huge pressure if the tech sector faces headwinds.
- S&P 500 Index (Broadly Diversified): This is the S&P 500’s biggest advantage. It covers 11 major sectors, effectively reducing reliance on any single industry and offering more stable performance during market stress. However, note that even the S&P 500 has seen increasing concentration in recent years.
As shown, the top 10 companies in the S&P 500 now account for ~40% of the index, meaning a few tech giants increasingly dominate overall index movement. - Dow Index (Few Companies but Sector-Diverse): Though only 30 names, the committee deliberately includes leaders from finance, healthcare, consumer, industrials, etc., providing reasonable sector diversity.
Correlation with Economic Cycles
Different economic phases affect different types of companies, thereby influencing index performance.
- Economic Expansion: In booming economies with low rates, investors are willing to pay for “the future.” Nasdaq, dominated by tech and growth stocks, typically performs best. In recent years, ChatGPT’s launch triggered billions in AI investment and drove the tech-heavy Nasdaq higher — a classic example of expansion combined with innovation.
- Economic Recession: When the outlook is unclear, investors seek safe havens. Blue-chips in the Dow and consumer staples, utilities, and healthcare in the S&P 500 — with stable demand and cash flows — tend to be more defensive. Interestingly, historical data shows stock performance does not perfectly sync with GDP changes. Across 31 recessions from 1869 to 2022, the correlation between stock returns and GDP changes was only 0.30, reminding us that stocks are a leading indicator reflecting future expectations, not current economic data.
Overall, corporate earnings are the ultimate support for stock prices. Consensus forecasts 14% S&P 500 earnings growth in 2026, continuing to outpace GDP growth — the main driver supporting long-term upward market movement.
In conclusion, the three major indices have clear positioning: the Dow is “select blue-chips,” the S&P 500 is “overall market representative,” and Nasdaq is “tech growth pioneer.” Index investing is an effective way to reduce single-stock risk — choose based on your style.
- Conservative & Balanced: Seeking diversification and market-average returns — S&P 500 is the ideal core holding.
- Value-Oriented: Preferring stable dividend-paying blue-chips — consider Dow-tracking investments. Related ETFs (e.g., DIA) offer about 1.48% dividend yield.
- Aggressive Growth: Pursuing high returns and able to tolerate high volatility — Nasdaq fits best. It has shown strong growth potential in AI and other tech waves.
Quick Decision Guide The table below summarizes key information for final decision-making to help you quickly find direction.
| Index Name | Suitable Investor Type | Risk Level | Represented Sectors | Representative ETF (Expense Ratio) |
|---|---|---|---|---|
| Dow Jones Industrial Average | Value-oriented, prefers mature firms | Lower | Finance, healthcare, industrials | DIA (0.16%) |
| S&P 500 Index | Conservative & balanced | Medium | Broadly diversified across 11 major sectors | VOO (0.03%) |
| Nasdaq Index | Aggressive growth-oriented | Higher | Technology, biotech, internet | QQQ (0.20%) |
FAQ
Which index should beginners invest in first?
If you are a new investor seeking a stable and diversified starting point, the S&P 500 is usually the top choice. It broadly represents the overall U.S. market, allowing participation in comprehensive economic growth with relatively balanced risk.
Why does the Dow Jones only have 30 companies?
The original purpose of the Dow Jones was to serve as a “barometer” of the market, not a comprehensive representation. A committee hand-picks 30 companies with the strongest reputation and influence to reflect the health of America’s top enterprises.
Can I directly buy and sell indices?
You cannot directly trade the index itself because it is just a number. But you can invest by buying “exchange-traded funds” (ETFs) that track these indices, such as VOO for the S&P 500 or QQQ for Nasdaq.
Do indices change their constituents?
Yes. All three major indices regularly review and adjust constituents.
- S&P 500 and Nasdaq adjust based on objective criteria like market cap and earnings.
- Dow is decided by a committee to ensure constituents always represent market-leading companies.
*This article is provided for general information purposes and does not constitute legal, tax or other professional advice from BiyaPay or its subsidiaries and its affiliates, and it is not intended as a substitute for obtaining advice from a financial advisor or any other professional.
We make no representations, warranties or warranties, express or implied, as to the accuracy, completeness or timeliness of the contents of this publication.
Related Blogs of
How Investors Can Navigate Dow Jones Volatility: Key Factors Analysis and Strategy Adjustment Guide


Master Dow Jones Futures Margin Rules: Risk Management Techniques to Avoid Margin Calls


Beyond NVIDIA and TSMC: These AI Supply Chain Hidden Champions Deserve More Attention


Think Like Buffett? Build Your Own Moat Using East Money Stock Data
Choose Country or Region to Read Local Blog

Contact Us
Company and Team
BiyaPay Products
Customer Services


BIYA GLOBAL LLC is a licensed entity registered with the U.S. Securities and Exchange Commission (SEC No.: 802-127417); a certified member of the Financial Industry Regulatory Authority (FINRA) (Central Registration Depository CRD No.: 325027); regulated by the Financial Industry Regulatory Authority (FINRA) and the U.S. Securities and Exchange Commission (SEC).
BIYA GLOBAL LLC is registered with the Financial Crimes Enforcement Network (FinCEN), an agency under the U.S. Department of the Treasury, as a Money Services Business (MSB), with registration number 31000218637349, and regulated by the Financial Crimes Enforcement Network (FinCEN).
BIYA GLOBAL LIMITED is a registered Financial Service Provider (FSP) in New Zealand, with registration number FSP1007221, and is also a registered member of the Financial Services Complaints Limited (FSCL), an independent dispute resolution scheme in New Zealand.