- EasyCard
- Trade
- Help
- Announcement
- Academy
- SWIFT Code
- Iban Number
- Referral
- Customer Service
- Blog
- Creator
How Can We Reliably Interpret the KDJ Indicator? A Comprehensive Analysis from Signal Analysis to Practical Techniques


In the market, “learning KDJ” is easy, but “using KDJ effectively” is not. You may have encountered situations like buying on a golden cross only to face a pullback, selling on a death cross and missing a big rally, or the indicator staying “overbought” or “oversold” in a strong trend, refusing to normalize. The issue isn’t that KDJ is “useless,” but rather knowing when to use it, how to filter signals, and how to execute with risk management.
This ultimate guide takes you from understanding the principles to applying them in practice:
- Why KDJ works or fails in different market conditions
- Which signals are reliable and how to confirm them
- How to adjust parameters, select timeframes, and adapt across markets
- A testable, executable minimal trading strategy unit with a risk management checklist
The article is practical and objective, and I recommend testing it alongside your chosen assets and timeframes as you read.
1. KDJ’s Role and Limitations: Understand What It Excels At and Where It Falls Short
In a nutshell: KDJ is a momentum/overbought-oversold oscillator based on the Stochastic indicator, excelling at capturing “extremes” and short-term turning points in range-bound markets; in strong trends, it tends to become “passivated,” generating many false reversal signals when used alone.
- KDJ essentially derives from the Stochastic Oscillator (KD), with the J line amplifying the difference between K and D for increased sensitivity. For its calculation logic and formulas, refer to Futu’s definition and examples. For calculation details, see the 2023 Futu Learning Center entry “What is KDJ” (Chinese) Futu Learning - What is KDJ (2023).
- Chinese quantitative resources provide detailed explanations of RSV, K, D, and J derivations and their significance, such as Quantit Tech’s 2024 formula breakdown and reasons for boundary crossings Quantit Tech KDJ Formula Explanation (2024).
My rule of thumb:
- First, assess the market environment (trend vs. range), then consider signals.
- KDJ is more reliable in “weak trend/range-bound/mean-reverting” environments.
- In strong trend phases, prioritize trend-following strategies, using KDJ as a reference for adjusting positions or gauging pullback strength, not as a “signal” for contrarian top/bottom picking.
2. From Formula to Intuition: What Are RSV, K, D, and J Measuring?
- RSV (Raw Stochastic Value): The position of the latest closing price within the “N-period price range,” ranging from 0–100, with higher values indicating proximity to the upper range.
- K: A smoothed version of RSV (commonly 1/3 new value + 2/3 old value), offering a steadier response.
- D: A further smoothed slow line of K.
- J: 3K − 2D, amplifying the difference between K and D, allowing J to exceed 100 or fall below 0.
You can think of them as:
- RSV: “How high/low is the current position?”
- K: “The short-term average of the position.”
- D: “The average of the short-term average.”
- J: “A magnifying glass for the difference between fast and slow lines.”
For a more systematic derivation and parameter origins, refer to the 2024 BigQuant Wiki entry on KDJ and KD/Stochastic background BigQuant Wiki-KDJ (2024).
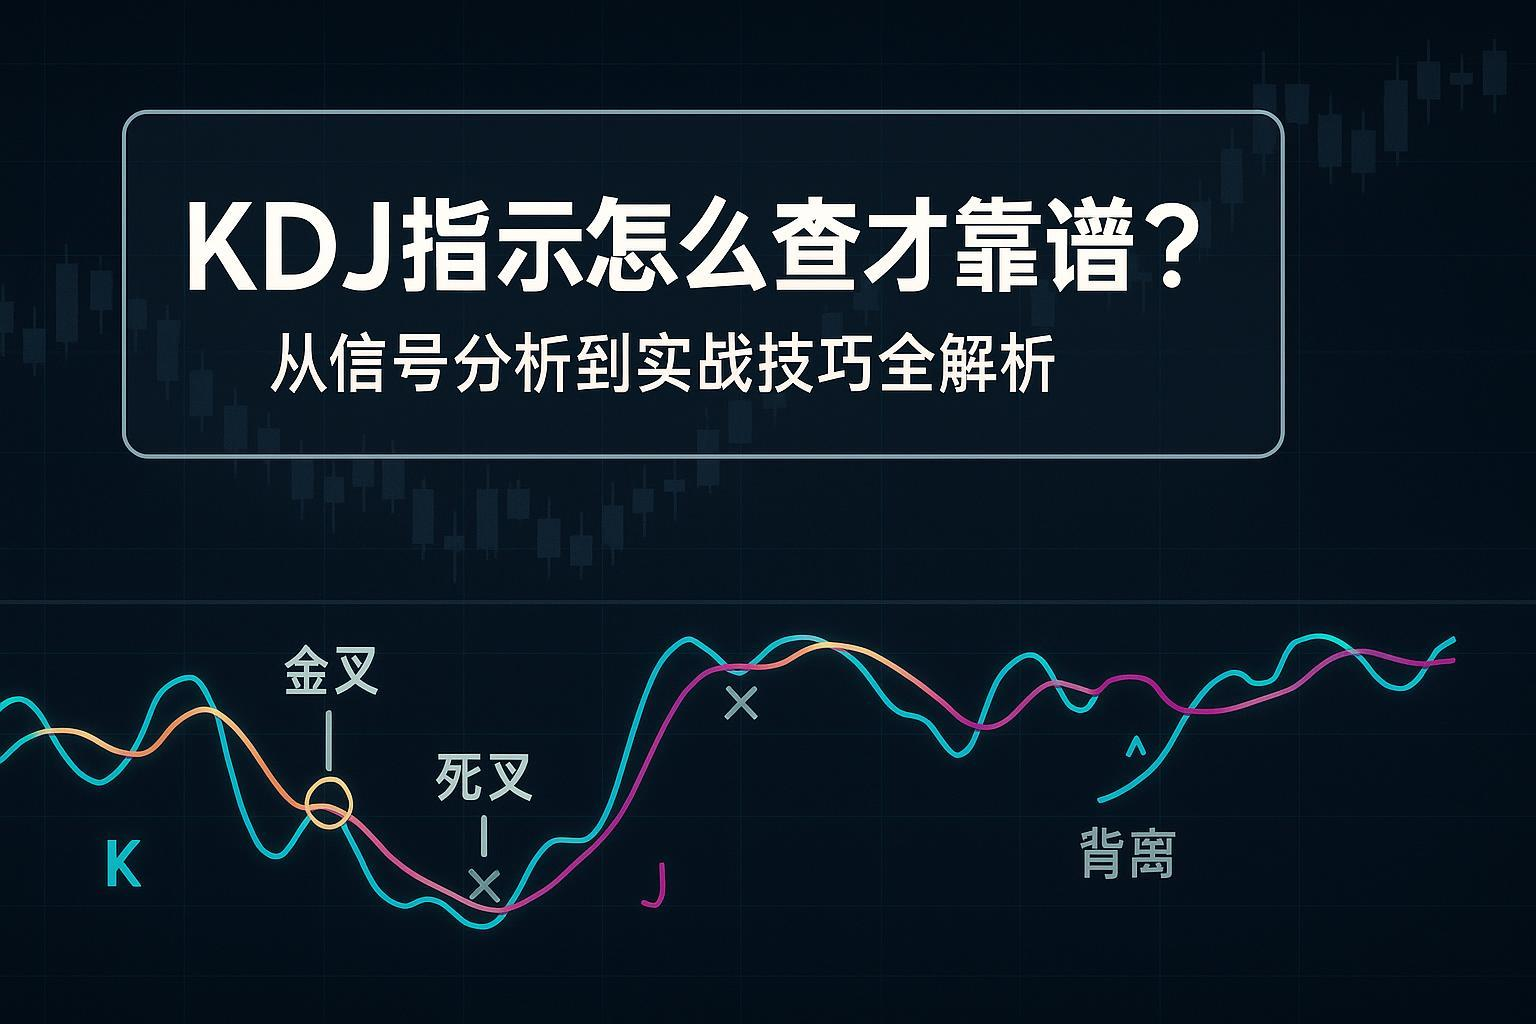
3. Signal System: Crosses, Threshold Zones, Divergences, and J-Value Extremes
- Cross Signals
- Golden Cross: K crosses above D from below, often a “buy trigger.”
- Death Cross: K crosses below D from above, often a “sell/close trigger.”
- Threshold Zones
- Common definition: K, D > 80 indicates overbought; K, D < 20 indicates oversold.
- Adjustment suggestion: For high-volatility assets, use more conservative thresholds (e.g., 30/70), with D thresholds slightly stricter than K to reduce noise.
- J-Value Extremes
- J > 100 or J < 0 signals short-term emotional or momentum extremes, suggesting potential “mean-reversion” opportunities, but not recommended as a standalone basis for contrarian trades.
- Divergences
- Top Divergence: Price makes a new high, but KDJ does not, indicating weakening momentum.
- Bottom Divergence: Price makes a new low, but KDJ does not, indicating weakening bearish momentum.
For mainstream definitions and examples of these thresholds and signals, the 2022–2024 Futu Help Center and Mitrade tutorials provide clear explanations for reference Futu Help Center KDJ Topic (2024); Mitrade Technical Article - KDJ Principles and Applications (2023).
My practical tips:
- Golden/death crosses are only “triggers,” not “confirmations.”
- Treat thresholds as “attention zones,” not strict lines, and confirm with trend/structure.
- Divergences are “rare but valuable” signals; prioritize quality over quantity and pair with volume-price or key candlestick patterns for stability.
4. When Is It More Reliable? Solving Passivation and False Signals with Triple Filtering
The most frustrating aspect of KDJ is its passivation in strong trends at high/low levels. The industry consensus is that KDJ is better suited for range-bound markets and requires filtering in trending markets. For descriptions of “effective in ranges, ineffective/passivated in trends,” refer to 2023–2024 platform educational materials and research summaries, such as Mitrade and Futu’s explanations, as well as broker timing reports discussing indicator suitability. For example, a 2023 Northeast Securities timing analysis highlighted significant performance differences of indicators in various scenarios, emphasizing the importance of combinations and filtering Northeast Securities - Technical Indicator Timing Analysis (2023).
Triple Filtering Framework:
- Trend Filtering (Highest Priority):
- Price above key moving average (e.g., MA60) + MA flat or rising: focus on golden crosses.
- Price below key moving average + MA flat or falling: focus on death crosses.
- Or use ADX > 25 to identify “strong trend phases,” reducing contrarian trades.
- Volatility Filtering:
- Reduce trading frequency during periods of abnormally high ATR.
- Combine with Bollinger Bands: KDJ extreme signals are more meaningful when price is near upper/lower bands, but still require structural confirmation.
- Structural Confirmation:
- Pin bars or engulfing patterns near support/resistance.
- Volume confirmation (surge on reversals or low volume on pullbacks).
Note: Rules like “price > MA60, only take golden crosses” are practical experience, not textbook standards. Always backtest and validate.
5. Multi-Timeframe Resonance and Execution SOP: Top-Down, Trigger-Confirm-Execute
An actionable framework:
- Start with weekly charts to gauge the broader trend: Check KDJ direction and zone to avoid trading against the trend.
- Move to daily charts for timing: Wait for golden/death crosses or J-value extreme reversions aligned with the weekly trend.
- Use 60-minute charts for execution: After a daily trigger, wait for secondary confirmation on the 60-minute chart to enter.
Execution SOP (Example):
- Trigger: Secondary timeframe (e.g., daily) shows a KDJ golden cross, ideally with K, D in the 20–40 range.
- Confirmation: Higher timeframe (weekly) is aligned, and price meets trend filtering (e.g., > MA60).
- Execution: Drop to 60-minute, wait for a pullback that holds above the trigger candlestick’s low (for longs) or high (for shorts) before entering.
- Risk Management: Initial stop-loss = 1.5–2.5×ATR (based on execution timeframe), single trade risk ≤ 1% of capital.
- Exit: Take profits at 2R/3R in batches, or reduce position early on a reverse death cross + abnormal volume-price action.
For multi-timeframe tools and system-building tutorials, refer to 2022–2024 trading platform guides (examples) OKX Multi-Indicator and Multi-Timeframe Practical (2024); Gate Trading System Building (2023).
6. Parameter Tuning and Variants: (9,3,3) Isn’t the Only Answer
- Default (9,3,3): Classic Stochastic setting, balancing sensitivity and noise.
- Sensitive (5,3,3 or 6,3,3): Better for T+0 or high-volatility assets, but generates more false signals.
- Robust (14,3,3): Smoother, suited for longer timeframes or assets with clearer trends.
- Smoothing periods (the two “3s”) are typically kept constant to reduce jitter.
- Stochastic Family: Fast/Slow/Full. Full allows custom smoothing; Slow is more robust. KDJ builds on KD by introducing J = 3K − 2D, emphasizing momentum differences.
For detailed explanations of variants and parameter trade-offs, cross-reference the 2024 ChartSchool’s comprehensive Stochastic entry with Chinese and English platform resources ChartSchool-Stochastic Overview (2024).
Practical Suggestions:
- Set a parameter grid based on your trading timeframe and asset volatility (ATR).
- Conduct in-sample/out-of-sample and rolling backtests, focusing on win rate, reward-to-risk ratio, maximum drawdown, and Sharpe ratio.
- Once parameters are chosen, maintain consistency to avoid “changing every two weeks based on recent performance.”
7. Synergy with Other Indicators: Boost Signal-to-Noise Ratio with Minimal Dimensions
Combine KDJ with 2–3 complementary dimensions to avoid indicator overload:
- Trend Indicators: MA/EMA, MACD, ADX.
- Volatility/Range Indicators: ATR, Bollinger Bands.
- Structure/Price-Volume: Support/resistance, candlestick patterns, volume.
Combination Examples:
- Trend-Following Pullback Entry: Price > MA60, ADX < 25 (trend present but not strong), KDJ golden cross in 20–40 zone, with a high-volume long lower shadow, then enter.
- Range Reversal: Near Bollinger lower band with J < 0 reverting, daily golden cross + 60-minute secondary confirmation, with ATR-based stop-loss.
For KDJ and threshold/combination insights, 2023 Mitrade and platform educational articles offer examples and precautions Mitrade-KDJ Practical Suggestions (2023).
8. Cross-Market Differences: A-Shares, Futures, and Crypto Rules and Rhythms
- A-Shares (T+1, Price Limits):
- Buy today, sell tomorrow, reducing intraday correction ability and increasing overnight risk.
- Price caps amplify KDJ’s “high/low passivation” during extreme volatility, increasing execution difficulty.
- Rule references: 2020 Securities Times T+1 guide and 2024 Futu A-Share Connect trading rules Securities Times-T+1 Guide (2020); Futu A-Share Connect Rules (2024).
- Futures/Crypto (T+0, High Volatility, Crypto 24/7):
- Allows same-day trading, suitable for shorter parameters (e.g., 6,3,3) and tighter stops.
- Leverage requires stricter position and ATR risk management.
- Key is “multi-timeframe confirmation + noise filtering” to avoid being whipsawed in choppy markets.
9. Risk Management and Trade Management: Make Your Strategy Last Longer
- Stop-Loss:
- Structural Stop: Set slightly beyond key support/resistance or pattern invalidation levels.
- ATR Stop: 1.5–2.5×ATR (based on execution timeframe); too tight risks being stopped out by noise, too wide reduces expectancy.
- Exit:
- Partial Profit-Taking: Lock in profits at 2R/3R, trail remaining position with a stop.
- Conditional Exit: Reverse death cross with abnormal volume-price action, or price hitting Bollinger mid-band/key moving average showing strength-to-weakness or vice versa.
- Position and Expectancy:
- Single trade risk capped at 0.5–1.5% of capital.
- Long-term win rate may not significantly exceed 50%; focus on positive expectancy (reward-to-risk > 1).
Refer to quantitative/programmatic trading community articles on ATR and exit management for practical insights, tailored to your timeframe/asset (example tutorials for framework understanding) CSDN-ATR Stop-Loss Ideas (2024); FMZ Strategy Example (2023).
10. “Minimal Reusable Strategy Unit”: Ready for Backtesting
Goal: In range-bound or weak-trend phases, use a “trend filter + KDJ trigger + ATR risk management + partial exit” combination to achieve a more stable signal-to-noise ratio and replicability.
Rule Template (Example for Backtesting):
- Environment Filter:
- Daily price within ±2% of MA60 (or near Bollinger mid-band), ADX < 25.
- Trigger:
- Daily KDJ golden cross in oversold zone (K < 20, D < 25, or J < 0).
- Confirmation:
- Same or next day shows a high-volume bullish candle or a false breakdown below range support with a long lower shadow recovery.
- Execution:
- Drop to 60-minute timeframe, enter long on pullback holding above trigger candle’s low.
- Risk Management:
- Initial stop-loss = 1.8×ATR (60-minute), position sized for single trade risk ≤ 1% of capital.
- Exit:
- Reduce position by half at +2R, further at +3R, trail remaining with 1.5×ATR stop.
- Exit Signal (Fallback):
- Death cross + high-volume bearish candle, or daily close below MA60 with volume surge.
Reverse (short/close) can be applied symmetrically, noting A-share index/stock shorting restrictions and leverage risks in crypto/futures.
11. Backtesting Suggestions and Data Reality: Beat Illusions with Data
Publicly available “authoritative large-sample backtest statistics” are scarce. The practical approach is to build rules on a quantitative platform and conduct grid testing:
- Parameter Grid: N ∈ {5,9,14}; thresholds ∈ {20/80, 30/70}; trend filters (MA20/60, ADX25); ATR multiples ∈ {1.5,2.0,2.5}.
- Metrics to Observe: Win rate, reward-to-risk ratio, maximum drawdown, annualized return, Sharpe ratio.
- Cross-Market Comparison: A-shares (daily/weekly), futures (60-minute/daily), crypto (15-minute/4-hour/daily).
- Out-of-sample and rolling window validation to prevent overfitting.
Industry research notes that “no single indicator works universally across all markets,” so combinations and filtering often outperform standalone signals. See the 2023 Northeast Securities timing report for framework insights Northeast Securities - Technical Indicator Timing Analysis (2023).
12. Common Pitfalls and Troubleshooting Checklist
Common Pitfalls:
- Going short on overbought or long on oversold (ignoring trend), getting crushed by passivation in strong trends.
- Acting on every golden/death cross without trend/volatility/structural filtering.
- Frequently changing parameters, leading to “optimal today, invalid tomorrow” due to insufficient sample size.
- Relying solely on one indicator, ignoring volume-price structure and risk/position management.
- Treating J-value boundary crossings as “guaranteed reversals” for bets.
Troubleshooting Checklist:
- Is the higher timeframe direction aligned? Do key moving averages and ADX indicate trend or range?
- Are thresholds too aggressive? Have you considered the asset’s volatility differences?
- Have you set clear stop-loss (ATR×N) and R-factor targets?
- Have you conducted out-of-sample and rolling backtests?
- Is there secondary confirmation from volume-price or patterns?
13. Advanced Notes: Conceptual Differences and Learning Path
- KD vs. KDJ: KDJ builds on KD by adding J, amplifying fast-slow differences, explaining J’s boundary crossings. For a visual distinction, see the 2022 Pocket School illustration Kitchen Pocket School - KD vs. KDJ Differences (2022).
- Systematic Learning: In the Chinese context, Futu’s KDJ topic page offers user-friendly content on concepts, calculations, and applications, bridging beginner to advanced Futu KDJ Topic Directory (2024).
- Classic Textbook: John J. Murphy’s Technical Analysis of the Financial Markets systematically covers Stochastic principles, patterns, and applicable scenarios. Read it alongside your backtest results to internalize the methodology.
14. Applicable Boundaries and Re-emphasis
- KDJ excels in “range-bound and weak-trend” markets; using it alone in strong trends often leads to distortion.
- Golden/death crosses = triggers; trend/volatility/structure = confirmation.
- J-value extremes and divergences = hints, requiring secondary confirmation before execution.
- No universally optimal parameters; prioritize backtesting and robustness.
Final Note: Turn KDJ into a Stable, Reusable Process
Start practicing today:
- Select your asset and primary execution timeframe.
- Create an “environment-trigger-confirmation-execution-risk management-exit” SOP card.
- Confirm parameter grid and threshold ranges, conduct in-sample/out-of-sample and rolling backtests.
- Use 2–3 complementary dimensions (trend/volatility/structure) to improve signal-to-noise ratio.
- Manage positions by R-factor and review every trade.
When you can consistently execute a small, elegant process, KDJ becomes truly “reliable.”
Risk and Compliance Disclaimer (Important)
This article is for educational and discussion purposes only and does not constitute investment advice. Financial markets carry risks, and past performance does not guarantee future results. A-share T+1 and price limits, as well as leverage and 24/7 trading in futures and digital assets, significantly impact execution and risk levels. Please make independent judgments and validate through backtesting based on your situation, and act within your means.
References and Further Reading (in order of appearance, links listed only once):
- Futu Learning - What is KDJ (2023): https://www.futunn.com/learn/detail-what-is-kdj-64858-220831019
- Quantit Tech KDJ Formula Explanation (2024): https://www.quantit.tech/guide/indicators/kdj.html
- BigQuant Wiki-KDJ (2024): https://bigquant.com/wiki/doc/5ayA6F6FqX
- Futu Help Center KDJ Topic (2024): https://support.futunn.com/topic149
- Mitrade-KDJ Principles and Applications (2023): https://www.mitrade.com/cn/insights/others/technical-analysis/kdj-0526
- Northeast Securities - Technical Indicator Timing Analysis (2023): https://nesc.cn/timerfiles/upload/report/2023/11/14/15813317.pdf
- OKX Multi-Indicator and Multi-Timeframe Practical (2024): https://www.okx.com/zh-hans/learn/zero-basic-science-bitcoin-analysis-index-10-multi-index-integrated-practical-application
- Gate Trading System Building (2023): https://www.gate.com/zh/learn/articles/how-to-build-a-trading-system/8275
- CSDN-ATR Stop-Loss Ideas (2024): https://blog.csdn.net/baidu_24190413/article/details/146997827
- FMZ Strategy Example (2023): https://www.fmz.com/strategy/488889
- Securities Times-T+1 Guide (2020): https://news.stcn.com/sd/202007/t20200724_2161762.html
- Futu A-Share Connect Rules (2024): https://www.futuhk.com/support/topic2_108
Mastering KDJ indicators reveals that real trading success lies beyond mere signals—it’s about efficient capital flow and risk management. Traders often struggle with false breakouts in ranging markets, indicator stagnation in strong trends, and the drain of high remittance fees plus exchange rate hits during cross-market shifts. These hurdles frequently turn promising golden crosses into losses, especially when juggling overseas accounts and slow transfers across global assets.
The good news? A platform like BiyaPay streamlines it all: conversions between 30+ fiat currencies and 200+ cryptos at fees as low as 0.5%, with same-day remittances to most countries and regions. For A-share day trading, futures scalping, or crypto’s nonstop action, quick signup lets you handle funds on the fly. Best of all, trade US and Hong Kong stocks right there without foreign accounts; zero-fee contract orders make executing KDJ momentum cues swift and cost-free.
Ready to level up? Sign up at BiyaPay and use the Real-time Exchange Rates tool to snag optimal conversion moments, dodging volatility pitfalls. Check out the Stocks section too, to blend KDJ multi-timeframe resonance with broader markets. With top-tier security and compliance, focus on your edge, not logistics. Turn KDJ reliability into profits with BiyaPay—test small, scale smart, starting today.
*This article is provided for general information purposes and does not constitute legal, tax or other professional advice from BiyaPay or its subsidiaries and its affiliates, and it is not intended as a substitute for obtaining advice from a financial advisor or any other professional.
We make no representations, warranties or warranties, express or implied, as to the accuracy, completeness or timeliness of the contents of this publication.


Contact Us
Company and Team
BiyaPay Products
Customer Services


is a broker-dealer registered with the U.S. Securities and Exchange Commission (SEC) (No.: 802-127417), member of the Financial Industry Regulatory Authority (FINRA) (CRD: 325027), member of the Securities Investor Protection Corporation (SIPC), and regulated by FINRA and SEC.
registered with the US Financial Crimes Enforcement Network (FinCEN), as a Money Services Business (MSB), registration number: 31000218637349, and regulated by FinCEN.
registered as Financial Service Provider (FSP number: FSP1007221) in New Zealand, and is a member of the Financial Dispute Resolution Scheme, a New Zealand independent dispute resolution service provider.