- EasyCard
- Trade
- Help
- Announcement
- Academy
- SWIFT Code
- Iban Number
- Referral
- Customer Service
- Blog
- Creator
How Important is the PPI to the Market? An Analysis of Inflation Early Warnings and Investment Strategies


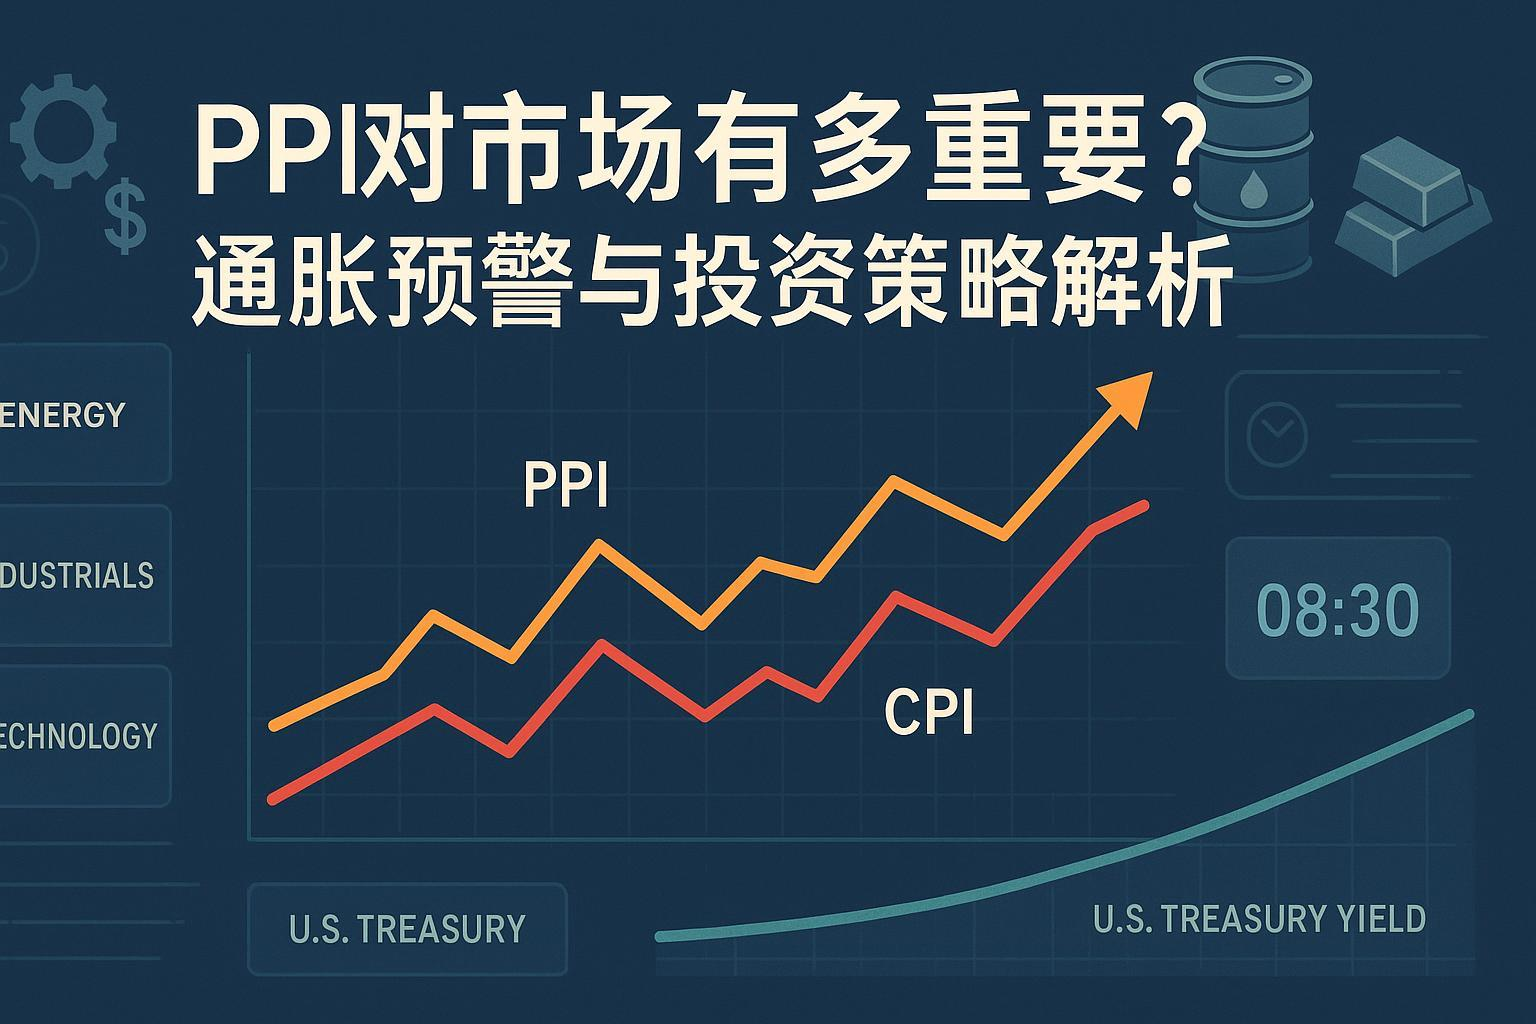
You may have been tracking CPI for years, but what often moves markets first is a Producer Price Index (PPI) report. PPI is an upstream signal in the price transmission chain: it first reflects price changes in raw materials, energy, semi-finished goods, and upstream services, which may later partially pass through to consumers. This article clarifies three things from an investor’s perspective:
- What exactly PPI measures and how it’s compiled (key points to focus on)
- Its relationship with CPI and asset prices (when it works, when it doesn’t)
- How to translate a PPI data release into actionable investment decisions before and after its publication
We avoid grand narratives and stick to authoritative sources and replicable processes, supplemented by real 2024–2025 case studies and actionable checklists.
1. What Is PPI: Definition, Scope, and Key Points to Watch
If you bookmark only one page, make it the U.S. Bureau of Labor Statistics’ PPI homepage (BLS). BLS defines PPI as an index measuring price changes in the U.S. production sector across different stages, covering goods and services. Three points are most critical for investors:
- Multiple index systems exist: Beyond traditional goods/industry metrics, BLS introduced the “Final Demand–Intermediate Demand (FD-ID)” system in 2014, which better aligns with the “upstream-to-downstream transmission” analysis perspective. For a comprehensive understanding of classifications and components, refer to BLS’s FD-ID system explanation.
- Seasonal adjustments and revisions: PPI releases seasonally adjusted (SA) and non-seasonally adjusted (NSA) data; initial values may be revised in subsequent months. Short-term trading and backtesting must account for seasonal adjustment metrics and revision policies, see BLS seasonal adjustment and revision explanation.
- Release schedule and timing: Typically monthly, at 8:30 AM Eastern Time. Add it to your macroeconomic calendar; see BLS PPI release calendar.
In China, the National Bureau of Statistics refers to PPI as the “Producer Price Index for Industrial Products,” which reflects trends and magnitudes of factory-gate price changes for industrial enterprises. For methodology and weight update frequency, see the National Bureau of Statistics’ PPI page and methodology overview. In 2025 statements, officials repeatedly emphasized signals like narrowing year-on-year PPI declines and stable month-on-month trends; refer to PPI-related content from the August 2025 press conference (see National Bureau of Statistics August 2025 press conference excerpt).
Investor’s Summary:
- Where to look: In the U.S., focus on “Final Demand” and “Intermediate Demand” subcomponents in FD-ID; in China, observe divergence between mining, raw materials, processing, and downstream industries.
- Choosing metrics: Use seasonally adjusted (SA) data for strategy backtesting for stability; for commodity chain studies, supplement with non-seasonally adjusted (NSA) data to observe seasonal fluctuations.
- Timing: Gather market consensus expectations a week in advance; on release day at 8:30 AM (ET), focus on subcomponents and the magnitude of “above/below expectations.”
2. PPI and CPI: Why It “Sometimes Leads, Sometimes Fails”
Textbooks often claim “PPI leads CPI.” The real world is more complex: industry structures, demand strength, policy environments, and corporate pricing power all affect the strength and lag of transmission. International institutions also note “variable lags and differentiated transmission.” For instance, the Bank for International Settlements’ 2024 annual report highlights that price shock transmission is constrained by structural factors, with distinct paths for services and goods (see BIS 2024 annual report relevant sections). Chinese macroeconomic and trade research also suggests that upstream costs may not smoothly pass to end consumers during weak demand or overcapacity (see Chinese Academy of Social Sciences IWEP 2025 research report excerpt).
Investor Takeaways:
- The “3–6 month fixed lead” is a myth. Treat it as a rule of thumb, not a law.
- Watch industry chain asymmetries: Energy and metals quickly impact upstream PPI, but transmission to services CPI is slow and weak.
- Demand as a “gatekeeper”: When downstream consumption and services demand are weak, PPI increases may not push up CPI.
3. Market Impact Mechanisms: From “Above/Below Expectations” to Asset Prices
Market reactions to PPI often transmit through the “policy expectation” amplifier to interest rates, exchange rates, and asset prices.
- If PPI significantly exceeds expectations (rising inflation pressure): Markets raise expectations for rate hikes or prolonged high rates, short-end Treasury yields rise, the dollar strengthens, gold faces pressure, growth assets see valuation compression, and value/cyclical assets outperform.
- If PPI falls below expectations (easing inflation pressure): Markets increase rate cut probabilities or expect earlier cuts, Treasury yields decline, the dollar weakens, gold rebounds, and rate-sensitive sectors benefit relatively.
Two contrasting snapshots from 2025 (based on Chinese media and Reuters coverage):
- In July 2025, U.S. PPI month-on-month and year-on-year both significantly exceeded expectations, with media noting rising Treasury yields, declining rate cut probabilities, and markets reassessing inflation risks (see Reuters’ TradingView entry; China Daily’s Chinese website also discussed market logic on resurgent U.S. inflation, see China Daily Chinese August 2025 commentary).
- In August 2025, U.S. PPI unexpectedly turned negative month-on-month, with reports indicating 10-year Treasury yields breaking below key levels, a weaker dollar, and stronger gold prices (see United Daily News market review, September 10, 2025).
My Macro Tip: Beyond the data, focus on the magnitude of “above/below expectations,” the direction of core and services subcomponents, and FedWatch’s repricing of future rate paths—these three signals often determine the week’s asset direction.
4. Translating PPI into Investment Actions: Scenario-Based Strategies and Tools
First, a disclaimer: The following is educational information, not individualized investment advice; use it cautiously in conjunction with your risk tolerance, investment horizon, and liquidity needs.
4.1 Three Common Scenarios and Responses
- Above Expectations (Rising Inflation Pressure)
- Bonds: Reduce duration exposure moderately; prefer short-duration or floating-rate assets; consider inflation-protected bonds (see TIPS insights below).
- Equities: Shift defensively toward value/cyclical and cash-flow-stable assets; beware of high-valuation growth stocks facing valuation compression from rising rates.
- Commodities and Gold: Energy and select raw materials benefit relatively; gold may face pressure from rising real rates (consider dollar and geopolitical risks).
- Forex: Dollar strength probability increases.
- Meets Expectations (No Change in Direction)
- Bonds: Maintain baseline allocation, monitor yield curve shape (steepening/flattening) changes.
- Equities: Focus on structure and subcomponents; if services/core subcomponents rise, rate expectations remain tight, and growth stocks stay pressured.
- Commodities and Gold: Driven primarily by inventory and supply-demand dynamics, with macro disturbances secondary.
- Below Expectations (Easing Inflation Pressure)
- Bonds: Moderately increase duration exposure and rate-sensitive asset allocations.
- Equities: Rate-sensitive sectors outperform relatively; growth styles benefit from lower real rates at the valuation end.
- Commodities and Gold: Gold benefits relatively; energy and upstream sectors require caution amid demand-weakening concerns.
- Forex: Dollar weakness probability increases.
Practical Tip: For any scenario, set upper limits and trigger conditions for “positions” and “stop-loss/risk management” to avoid amplification of noise from monthly data.
4.2 TIPS’ Role and Common Misconceptions
U.S. Treasury Inflation-Protected Securities (TIPS) have principal and interest linked to CPI-U, not PPI. For official details, see U.S. Treasury’s TreasuryDirect TIPS page.
- Insight: When you judge that “PPI increases may lead CPI higher,” TIPS can serve as a portfolio hedge against inflation, but allocation should be based on CPI path judgments and TIPS valuations.
- Misconception: Mechanically mapping PPI changes to TIPS returns is often invalid.
4.3 Using CME FedWatch to Calibrate “Policy Expectations”
After a PPI release, the first task is to see how markets reassess rate paths. In practice, I recommend immediately checking the CME FedWatch Chinese tool to observe how rate hike/cut probabilities shift for upcoming FOMC meetings, then cross-reference:
- Immediate changes in 2-year/10-year Treasury yields and curve steepness
- Dollar Index (DXY) and major currency pairs
- Gold and WTI/Brent
This quickly translates “data interpretation” into a quantitative basis for “position adjustments.”
5. Data Access and Interpretation: A Replicable Workflow (Checklist)
The following checklist is suitable for monthly rolling use.
-
Pre-Release (T-3 to T-1)
- Gather consensus expectations: Focus on core PPI (excluding food and energy) and services subcomponent expectations; note market focus and divergences.
- Set three scenarios: Above/meets/below expectations, and predefine bond duration, style preferences, and gold/energy position ranges for each.
- Prepare observation panel: UST 2Y/10Y, Dollar Index, WTI and gold prices, S&P sectors, and A-share upstream/midstream/downstream representative sectors.
- Mark key times: 8:30 AM (ET) is the release time; arrange trading and risk management windows.
-
Release Day (T)
- Verify immediately: Whether total PPI, core PPI, and services/goods subcomponents’ month-on-month and year-on-year figures are “above/below expectations” and by how much.
- Observe instantly: Minute-to-hour-level directions and strengths of rates, dollar, gold, oil, and equity sector indices.
- Calibrate policy expectations: Whether FedWatch probability shifts are significant and if they alter the policy baseline for the current or next month.
- Record media and institutional commentary keywords for post-market review material.
-
Post-Release (T+1 to T+3)
- Track persistence: Whether initial reactions extend to daily levels; watch for data revisions or secondary impacts from subcomponent interpretations.
- Review template: Record the magnitude of “above/below expectations,” market reaction strength, duration, subcomponent contributions, and weekly policy expectation changes, adding to your “event-reaction” model library.
- Strategy evaluation: If markets overreact, consider mean reversion; if trends solidify, consider phased position adjustments.
Key Data Sources:
- U.S. data and calendar: BLS’s PPI homepage and release calendar
- Chinese metrics and methodology: National Bureau of Statistics’ PPI page
- Cross-country comparisons: OECD’s OECD.Stat portal
6. Common Misinterpretations and Risk Boundaries
- Misinterpretation 1: “TIPS are tied to PPI” — Incorrect. TIPS are linked to CPI-U; see U.S. Treasury’s TIPS official explanation.
- Misinterpretation 2: “PPI always leads CPI by 3–6 months” — No universal evidence supports this. International studies emphasize differentiated transmission and variable lags; see BIS 2024 annual report relevant sections.
- Misinterpretation 3: Ignoring adjustments and revisions — Short-term strategies must consider both SA/NSA data and track subsequent revisions; see BLS seasonal adjustment and revision explanation.
Risk Boundaries (Please Read):
- This article does not constitute individualized investment advice or guarantee any returns; markets are volatile and uncertain.
- Any allocation or position adjustments must align with your risk tolerance, investment goals, horizon, and liquidity needs.
- Beware of additional risks from unexpected policy changes, geopolitical and energy supply disruptions, data revisions, and statistical metric differences.
7. Further Reading and Case Study Index (Anchor Links)
- Methodology and Metrics: BLS’s PPI homepage, FD-ID system explanation, seasonal adjustment and revision explanation; National Bureau of Statistics’ PPI page and methodology overview.
- Cross-Country Perspective: OECD’s OECD.Stat portal.
- Transmission Studies: BIS 2024 annual report relevant sections; Chinese Academy of Social Sciences IWEP 2025 research report excerpt.
- Strategy Tools: U.S. Treasury TIPS official explanation, CME’s FedWatch Chinese tool.
- Market Cases: Reuters’ TradingView entry, United Daily News September 10, 2025 review, China Daily Chinese August 2025 commentary.
Conclusion
Truly excellent macro investing isn’t about “guessing next month’s PPI” but about running a disciplined process to connect “data → policy expectations → asset prices.” Solidify this article’s workflow into your monthly routine, consistently logging “event-reaction-review,” and you’ll gradually build your own reusable model.
Important Disclaimer: This article is for investment education and market research purposes only and does not constitute individualized investment advice or return guarantees. Investing involves risks; proceed with caution.
Understanding PPI’s role in inflation alerts shows how upstream price shifts ripple through markets, demanding sharp capital mobility and exchange management. Traders often grapple with issues like volatile rates inflating remittance costs during PPI spikes, cumbersome foreign account setups for global assets, and transfer delays missing rate-cut timings. These snags disrupt strategies, particularly when dollar strength or gold pressures arise from policy repricing.
Fear not—BiyaPay is tailored for this: enabling conversions across 30+ fiat currencies and 200+ cryptos at fees as low as 0.5%, with same-day transfers to most global regions. Sign up swiftly to trade US and Hong Kong stocks on one platform, no overseas accounts needed, and enjoy zero-fee contract orders—ideal for acting on PPI-driven commodity or bond shifts.
Take the step! Register at BiyaPay to leverage the Real-time Exchange Rates feature, tracking key currencies like the dollar to sidestep transmission losses. Explore the Stocks area too, broadening portfolios with PPI insights. Prioritizing compliance and security, BiyaPay turns macro signals into gains. Sign up now, transform alerts into advantages, and navigate markets with ease.
*This article is provided for general information purposes and does not constitute legal, tax or other professional advice from BiyaPay or its subsidiaries and its affiliates, and it is not intended as a substitute for obtaining advice from a financial advisor or any other professional.
We make no representations, warranties or warranties, express or implied, as to the accuracy, completeness or timeliness of the contents of this publication.


Contact Us
Company and Team
BiyaPay Products
Customer Services


is a broker-dealer registered with the U.S. Securities and Exchange Commission (SEC) (No.: 802-127417), member of the Financial Industry Regulatory Authority (FINRA) (CRD: 325027), member of the Securities Investor Protection Corporation (SIPC), and regulated by FINRA and SEC.
registered with the US Financial Crimes Enforcement Network (FinCEN), as a Money Services Business (MSB), registration number: 31000218637349, and regulated by FinCEN.
registered as Financial Service Provider (FSP number: FSP1007221) in New Zealand, and is a member of the Financial Dispute Resolution Scheme, a New Zealand independent dispute resolution service provider.