- EasyCard
- Trade
- Help
- Announcement
- Academy
- SWIFT Code
- Iban Number
- Referral
- Customer Service
- Blog
- Creator
How to Use the ADX Trend Indicator? Key Techniques for Mastering Trading Strength and Weakness Signals


Important Note: This article is for educational and informational purposes only and does not constitute investment advice or trading recommendations. Please backtest in historical data and simulated environments first, then conduct small-position trials, and independently bear trading risks.
You will learn:
- How to use ADX to determine “whether a tradable trend exists” and use +DI/-DI to determine “trend direction”.
- How to set 20/25/40 thresholds as a “filter” to reduce false entries during consolidation periods.
- How to integrate ADX into a complete trading process: loading and setup → reading signals → two reusable strategies → multi-timeframe coordination → risk management and backtesting.
Who this is for: Intermediate traders who can read candlestick charts and understand basic indicators like EMA/ATR. Completing this guide, including practical exercises and basic backtesting, is expected to take 60–90 minutes.
1. Quick Overview: ADX Measures Strength, Not Direction
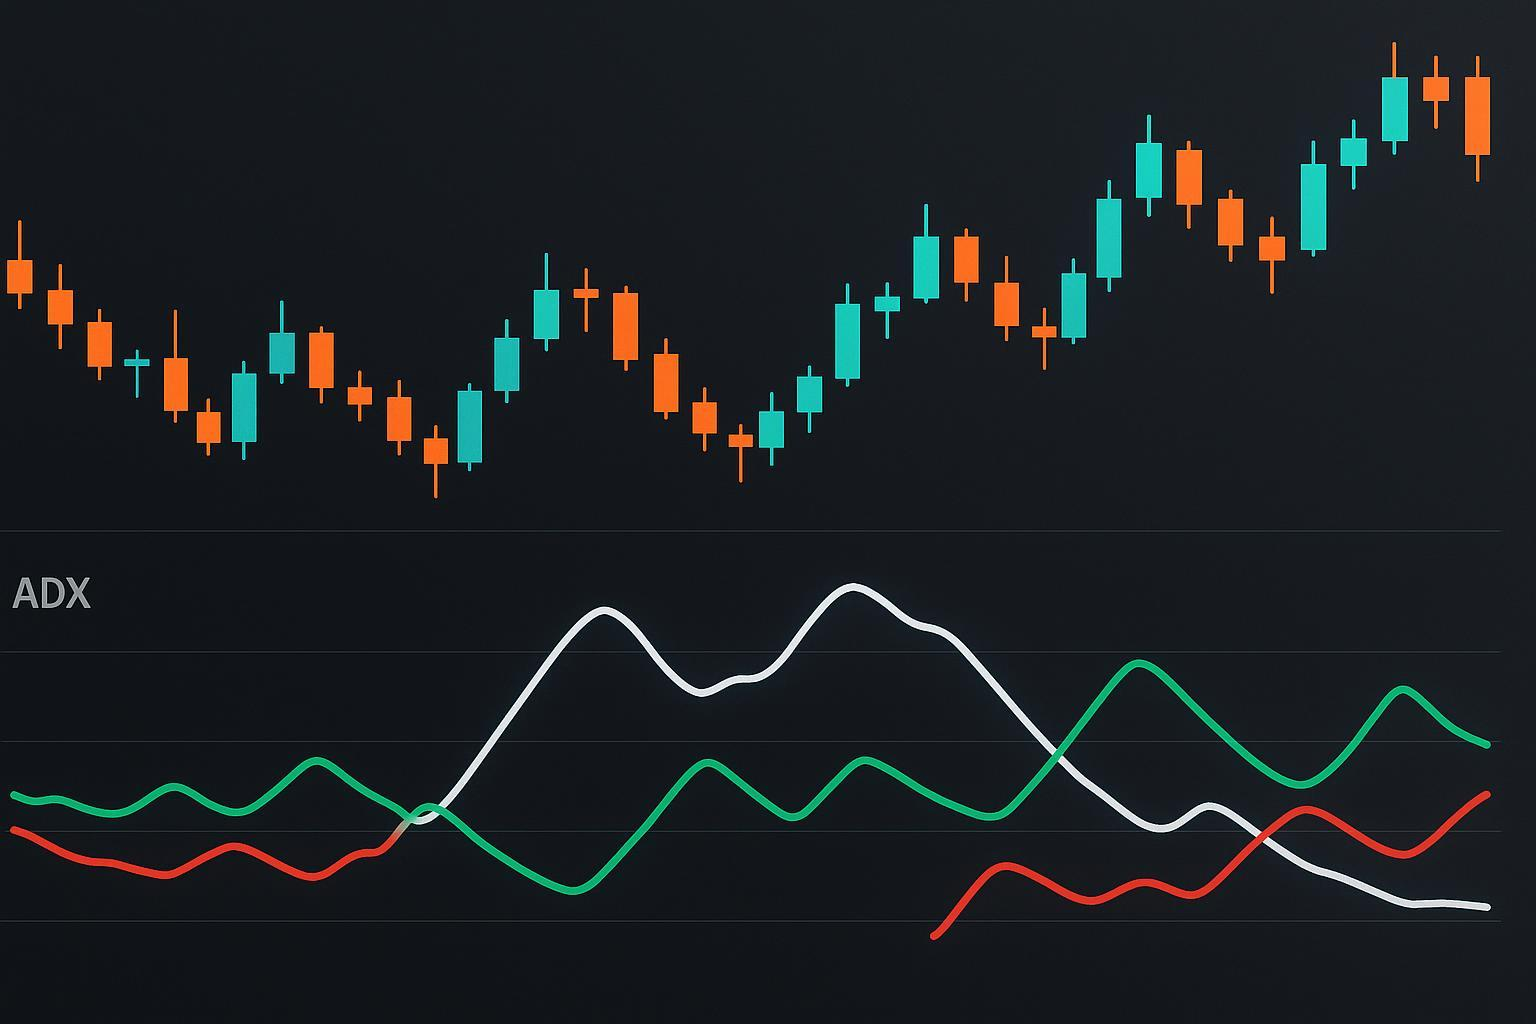
- ADX (Average Directional Index) measures trend “strength”; higher values indicate stronger trends, but it does not indicate bullish or bearish direction; direction is determined by +DI and -DI. See TradingView’s Chinese definition: “ADX is used to assess trend strength, typically used with +DI/-DI” — refer to TradingView’s Chinese support page for Average Directional Index (ADX).
- DMI (Directional Movement Index) is a set that includes ADX, +DI, and -DI lines. +DI represents upward momentum, -DI represents downward momentum; their crossovers and relative positions are used to determine direction. Refer to TradingView’s Chinese page for Directional Movement Index (DMI).
- The industry-standard default period is 14 (Welles Wilder method), which is the default setting on many platforms. Adjust based on the asset and timeframe, refer to TitanFX’s overview of DMI/ADX calculation and interpretation (Chinese).
Common threshold bands (used as a “whether to follow the trend” filter):
- ADX < 20: Typically consolidation/range-bound, trend strategies have lower success rates, better to observe or use range strategies.
- ADX 20–25: Trend may be emerging, requires further confirmation with structure and +DI/-DI.
- ADX > 25: Tradable trend is clearer, trend-following strategies are more meaningful.
- ADX > 40: Strong trend, but may come with amplified pullbacks.
The above threshold explanations are cross-referenced in multiple sources; readers can refer to TitanFX’s Chinese research page on threshold ranges, ZForex’s ADX range and strategy explanation (Chinese), and Gate.com’s Chinese tutorial for crypto traders.
Practical suggestions:
- Use 25 as a stricter trend confirmation line to reduce false signals.
- Use 20 as an “observation line” (early warning), but execute only with structural breakouts and consistent +DI/-DI direction.
2. Before You Start: Preparation Checklist
- Platform: TradingView (web or app), or MT4/MT5 terminal.
- Basic indicators: EMA (e.g., 10/30), ATR (for stop-loss/trailing stop).
- Preset: Add horizontal lines at 20/25/40 on the ADX panel in the subchart for easy visual judgment of strength zones.
3. Platform Practice: Correctly Adding ADX/DMI to Charts
A) TradingView
- Open any asset chart → Indicators → Search for “Average Directional Index” or “Directional Movement Index”.
- Parameters: Set Period to 14 as a starting point; check to display +DI/-DI (if using DMI component).
- Add horizontal lines to the ADX subchart: 20, 25, 40 (right-click subchart area → add horizontal line → input values).
- Verification: Review 3–5 recent periods of obvious trends and consolidations, confirm that “ADX rises during trends” and “ADX stays below 20 during consolidations” align with visual observations. Refer to TradingView’s Chinese ADX support page for indicator panel details.
B) MT4/MT5
- MT4 path: Insert → Indicators → Trend → Average Directional Movement Index.
- Set Period=14, customize style as needed; add Levels at 20/25/40.
- MT5 follows similar logic (menu items may slightly differ in Chinese). For illustrated Chinese tutorials, refer to LiteFinance’s ADX Chinese step-by-step guide and OANDA’s MT5 Chinese FAQ on adding/removing indicators.
Checkpoints (meet at least two):
- ADX panel displays ADX, +DI (green), -DI (red) simultaneously.
- Horizontal lines at 20/25/40 are added.
- Switching timeframes (e.g., daily, 4-hour, 1-hour) shows ADX significantly higher in trend periods than consolidation periods.
4. How to Read Signals: Strength, Direction, and “When to Stand Aside”
Memorize two key points:
- “Is there a trend?” Look at ADX; “Which direction?” Look at +DI/-DI; “Is it trend-following?” Check price relative to moving averages/structure.
- “No sufficiently strong direction = no trade.”
Chart reading essentials (check in order):
- Strength threshold:
- If ADX < 20: Stand aside, lean toward range strategies or avoid trend trades.
- If ADX > 25: Consider trend strategies; if between 20–25: Require additional confirmation (structure/breakout/moving averages).
- Direction confirmation:
- +DI crosses above -DI and stays above → Bullish dominance.
- -DI crosses above +DI and stays above → Bearish dominance.
- Background trend/structure:
- Is the price above rising moving averages (e.g., 10EMA > 30EMA and closing above the averages)?
- Has a range breakout or new structural high/low just occurred?
For a more systematic understanding of the above logic, refer to TradingView’s DMI/ADX Chinese definition page on the roles of the three lines and TitanFX’s explanation of strength and direction roles.
5. Two Reusable Execution Frameworks (Including Entry-Exit-Risk Control)
Framework A: Trend Following (Suitable for Established Trends)
- Filter: ADX > 25, and ADX does not weaken significantly in recent bars.
- Direction:
- Bullish: +DI crosses above -DI and stays above; price is above 10EMA and 30EMA, with 10EMA > 30EMA.
- Bearish: -DI crosses above +DI and stays above; price is below 10EMA and 30EMA, with 10EMA < 30EMA.
- Entry: Enter on the close of the next candlestick after the trigger or on a small pullback (avoid chasing when price is too far from moving averages).
- Stop-loss: Recent structural low/high, or 1–1.5×ATR.
- Management and exit:
- When ADX flattens or declines from a high, and +DI/-DI converge, reduce position gradually.
- Fully exit when moving averages are breached in the opposite direction or structure breaks.
Framework B: Range to Breakout (Suitable for Breakouts After Consolidation)
- Background: Identify the consolidation range; ADX is typically <20 during consolidation.
- Trigger: Price breaks range boundary decisively, while ADX rises from <20 and crosses 25; +DI/-DI aligns with breakout direction.
- Entry and stop-loss: Enter after breakout confirmation close; place stop-loss inside the range (or ATR × multiplier).
- Failure handling: If price quickly falls back into the range after breakout, exit immediately to avoid being trapped.
Note: Both frameworks use ADX as a filter and confirmation tool; details can be fine-tuned based on asset and timeframe. For more examples of “ADX with other indicators,” refer to ZForex’s Chinese explanation of ADX combination strategies.
6. Multi-Timeframe Coordination: Set the Tone, Then Find the Entry
- Higher timeframe sets the context: Check daily (or 4-hour) ADX to confirm “trend/no trend” environment.
- Lower timeframe finds entry: On 1-hour or 15-minute charts, wait for +DI/-DI triggers and structural signals aligned with the higher timeframe.
- Avoid “big trend, small countertrend”: If the higher timeframe shows no trend (ADX consistently <20), lower timeframe signals are prone to false breakouts, so exercise caution.
Practical tip: Multi-timeframe alignment of “direction + ADX threshold” is often more robust than single-timeframe signals but produces fewer signals—a trade-off.
7. Risk Management: Turning “Strong Trends” into “Controlled Positions”
- Fixed stop-loss:
- Structural: Place below recent significant low for longs; above recent significant high for shorts.
- ATR method: Use 1–1.5×ATR at entry as a base (adjust multiplier upward for higher-volatility assets).
- Trailing stop:
- In strong trend segments (ADX > 40), use trailing moving averages (e.g., 10EMA) or ATR-based trailing stops to let profits run.
- When ADX declines from a high and +DI/-DI converge, consider partial profit-taking.
- Position sizing:
- ADX only addresses “when to enter trends,” not win rates.
- Use a fixed risk model (e.g., 1R per trade) and evaluate strategy expectancy with data.
8. Parameter Optimization and Backtesting: Start with 14, Fine-Tune by Market
- Period suggestion: Start with 14 as default; shorter periods are more sensitive but noisier; longer periods are smoother but lag more.
- Threshold suggestion: For high-volatility assets (some commodities/crypto), raise thresholds to 25–30 to filter noise; for low-volatility assets, use 20 as an observation line.
- Crypto market experience: Practitioners suggest using longer periods (e.g., 30) on 4-hour charts for stability, but backtesting is essential; see Digtime’s explanation of Freqtrade-ADX period selection.
- Simple backtesting process:
- Select samples: Cover trending, ranging, and high-volatility periods.
- Grid parameters: Period ∈ {14, 21, 28, 30}; Thresholds ∈ {20, 25, 30, 40}.
- Fixed rules: Define entry, exit, and stop-loss.
- Evaluation metrics: Total return, maximum drawdown, profit factor, return/drawdown ratio.
- Robustness: Conduct walk-forward/rolling backtests to find “parameter plateaus” (areas insensitive to minor tweaks) to avoid overfitting.
- For quantitative frameworks, use hyperparameter optimization (Hyperopt) for systematic testing; refer to Freqtrade’s Chinese Hyperopt guide.
9. Common Mistakes and Troubleshooting (If X, Then Y)
- Mistake 1: Using ADX as a “direction” indicator → Correction: Direction comes from +DI/-DI and structure; strength comes from ADX. Review TradingView’s ADX and DMI Chinese role definitions.
- Mistake 2: Repeatedly trying trend trades during consolidation → Solution: Set minimum ADX threshold (20/25) + moving average direction filter; wait for breakout and ADX rise alignment.
- Mistake 3: Applying uniform parameters across all assets → Solution: Calibrate thresholds and periods with ATR/historical volatility; backtest small samples before scaling up.
- Mistake 4: Lagging signals leading to chasing highs or selling lows → Solution: Use multi-timeframe and structural entries; avoid chasing when price is too far from moving averages; use partial entries and tighter stops.
- Mistake 5: Focusing only on entries, ignoring exits → Solution: Predefine exits when “ADX declines, +DI/-DI converge, structure breaks, or moving averages are breached” to lock in profits or reduce positions.
10. Self-Assessment Checklist: Ensure You’ve Truly Learned
After completing this chapter, you should be able to:
- Add ADX/DMI to TradingView or MT4/5, set periods, and add 20/25/40 horizontal lines.
- Stand aside when ADX < 20, and act on ADX > 25 with +DI/-DI and moving average/structure alignment for trend trades.
- Independently write “filter-entry-stop-loss-take-profit” rules and run a comparative backtest on historical samples.
- Explain why 20 is an observation line, 25 is a strict line, and adjust thresholds and periods based on asset volatility.
For further concept or operation checks, revisit TradingView’s Chinese ADX support page, TradingView’s Chinese DMI page, and ZForex’s Chinese overview.
11. Common Q&A (Brief)
- Q: Must ADX be paired with +DI/-DI?
- A: Strongly recommended. ADX only indicates “strength,” not direction. Direction relies on +DI/-DI and price structure; see TradingView’s DMI component definition.
- Q: Should I use 20 or 25 for thresholds?
- A: 25 is stricter and more robust; 20 is earlier and more sensitive. Combine with breakout and moving average direction for reliability. Calibrate with backtesting for different assets.
- Q: Which period is most suitable?
- A: Start with 14, adjust based on trading timeframe and asset volatility. For crypto 4-hour charts, many traders try longer periods (e.g., 30), but validate with historical data.
References and Further Reading (Selected)
- Basis for using ADX to measure trend strength and pairing with +DI/-DI: See TradingView’s Chinese ADX support page and TradingView’s Chinese DMI page.
- Chinese explanations and examples of thresholds and ranges: Browse TitanFX’s Chinese research page, ZForex’s Chinese page, and Gate.com’s Chinese tutorial.
- Platform operation steps (MT4/MT5): See LiteFinance’s Chinese illustrated tutorial and OANDA’s MT5 Chinese FAQ.
- Parameter optimization and quantitative backtesting: Refer to Digtime’s explanation of Freqtrade-ADX period selection and Freqtrade’s Chinese Hyperopt guide.
Reminder: Markets are inherently uncertain. This article is for educational purposes only and does not constitute investment advice. Validate in historical data and simulated environments before cautiously transitioning to live trading.
After mastering the ADX indicator, you’ll realize that successful trading hinges on spotting trends while efficiently managing capital flows. Many traders face common pain points like high cross-border remittance fees, exchange rate volatility causing unexpected losses, and the hassle of opening overseas accounts to access global markets. These issues can derail decisions at crucial moments, letting potential trend-following opportunities slip away.
Picture a platform that simplifies all this: BiyaPay supports conversions between over 30 fiat currencies and 200+ cryptocurrencies, with fees as low as 0.5%, and offers same-day transfers reaching most countries and regions worldwide. Whether you’re into forex, crypto, or stocks, quick registration lets you handle funds seamlessly. Even better, you can trade US and Hong Kong stocks directly on the platform without needing foreign accounts; contract orders come with zero fees, enabling efficient execution when ADX signals align.
Why not give it a shot now? Sign up via BiyaPay to instantly access the Real-time Exchange Rates tool for monitoring optimal fiat exchange rates. Plus, dive into the Stocks section to broaden your portfolio. All operations prioritize security and compliance, keeping your capital steady amid market trends. Don’t let fees and delays hold you back—register with BiyaPay today and turn trend strength signals into real gains. Start your smarter capital management journey now.
*This article is provided for general information purposes and does not constitute legal, tax or other professional advice from BiyaPay or its subsidiaries and its affiliates, and it is not intended as a substitute for obtaining advice from a financial advisor or any other professional.
We make no representations, warranties or warranties, express or implied, as to the accuracy, completeness or timeliness of the contents of this publication.


Contact Us
Company and Team
BiyaPay Products
Customer Services


is a broker-dealer registered with the U.S. Securities and Exchange Commission (SEC) (No.: 802-127417), member of the Financial Industry Regulatory Authority (FINRA) (CRD: 325027), member of the Securities Investor Protection Corporation (SIPC), and regulated by FINRA and SEC.
registered with the US Financial Crimes Enforcement Network (FinCEN), as a Money Services Business (MSB), registration number: 31000218637349, and regulated by FinCEN.
registered as Financial Service Provider (FSP number: FSP1007221) in New Zealand, and is a member of the Financial Dispute Resolution Scheme, a New Zealand independent dispute resolution service provider.