- EasyCard
- Trade
- Help
- Announcement
- Academy
- SWIFT Code
- Iban Number
- Referral
- Customer Service
- Blog
- Creator
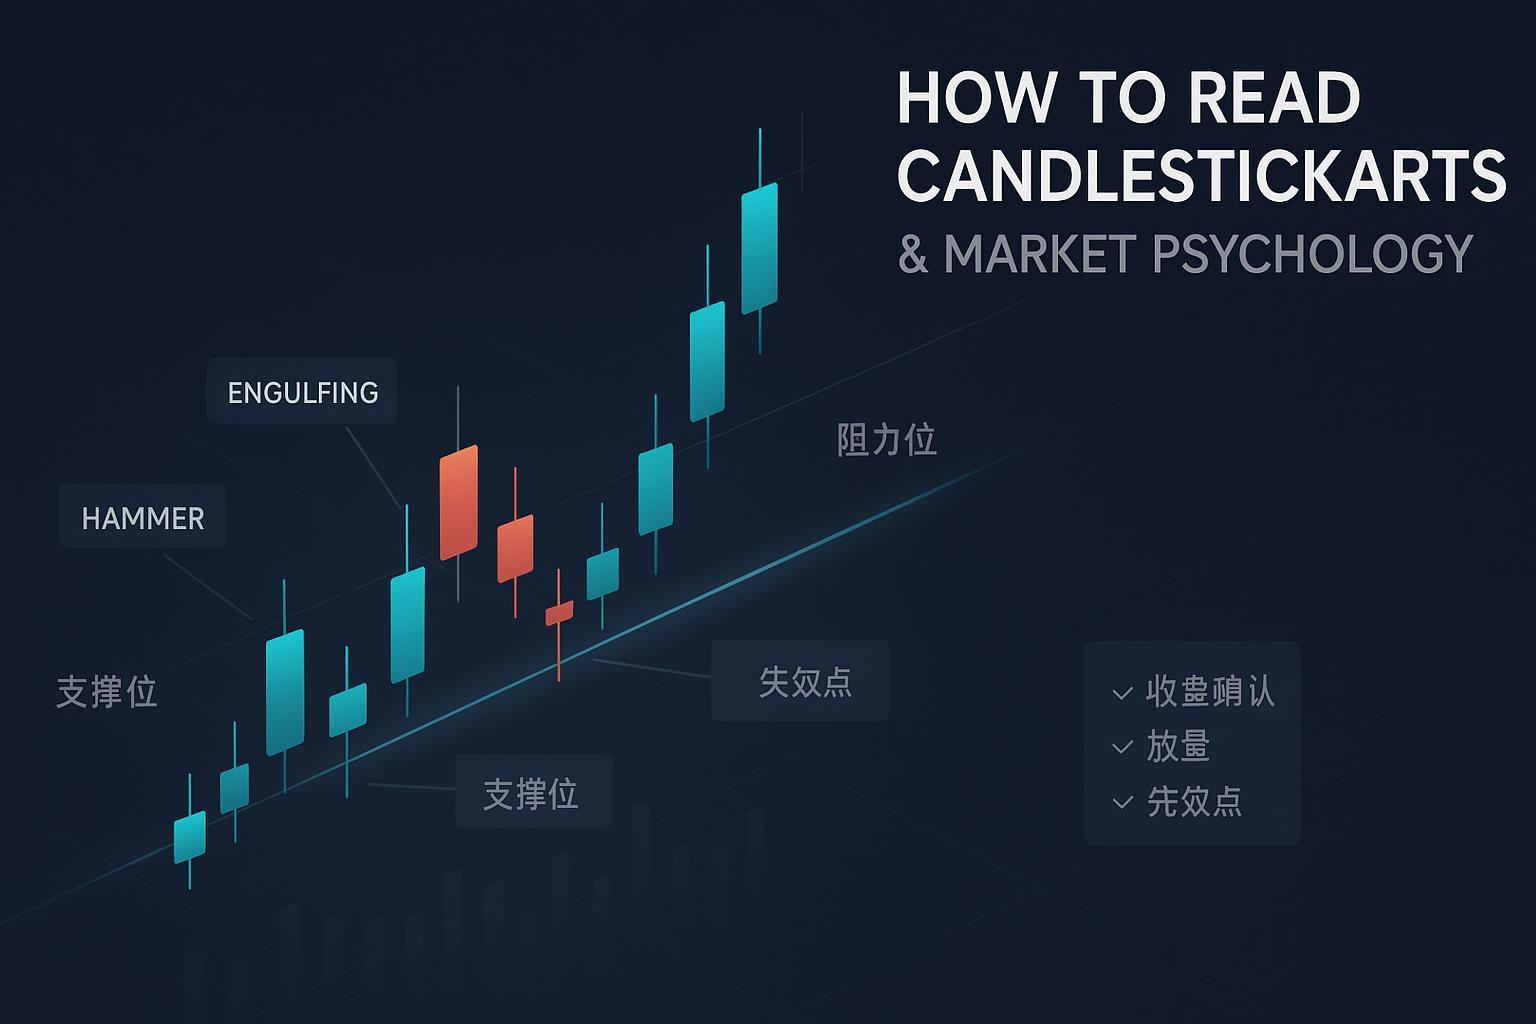
How to Read Candlestick Charts? Mastering the Market Psychological Logic behind Price Movements


Risk and Compliance Statement: This guide is for educational and informational purposes only and does not constitute investment advice or an invitation to buy or sell. Markets carry risks, and past performance does not predict future results. Please verify in a demo account or with small positions before making decisions.
You will learn: How to understand the meaning of single and combined K-lines (candlestick charts), read bullish and bearish forces and emotional shifts; how to judge “patterns” in the context of trends, key price levels, and volume; how to improve discipline with “close confirmation + invalidation conditions”; and how to use a small-sample template to test whether your chart reading has marginal value.
- Difficulty: Medium (beginners can start, advanced skills come from review)
- Estimated Time: 30–60 minutes to get started; 1–2 hours to master common patterns; 1–2 weeks to review with the template
- Required Tools: Any charting software with K-lines, volume, drawing tools, and multi-timeframe switching (broker apps or TradingView, etc.); note-taking/spreadsheet tools; optional demo account functionality
1. First, Understand: The Structure of K-Lines and “Market Psychology”
A single K-line consists of the opening price, highest price, lowest price, and closing price (OHLC). The body represents the difference between the open and close, while the wicks represent intraday probes that did not sustain:
- Long bullish body: Bulls dominated the period, with optimistic sentiment;
- Long bearish body: Bears dominated the period, with pessimistic sentiment;
- Long upper wick: Upward move met resistance, with notable selling pressure; Long lower wick: Downward probe met strong buying support, with buyers returning;
- Doji (very short body): Bulls and bears are temporarily balanced, hesitant, requiring subsequent K-lines to confirm direction.
To quickly build a foundation, refer to CMC Markets’ explanation of candlestick structure and reading: Forex Candlestick Charts and Common Uses (CMC Markets), and Moomoo’s beginner article: How to Read Candlestick Charts (Moomoo).
Tip: The significance of a single K-line comes from its “position and context.” A long lower wick near significant support carries far more weight than one in “mid-range.”
2. How to “Read + Use” Common Patterns? A Verifiable Reading Method
Each pattern below follows the same structure to help you execute: Identification Points → Psychological Meaning → More Reliable Context → Confirmation Method → Invalidation/Abandonment Conditions.
To avoid disputes over absolute thresholds due to different schools of thought, this article uses “range/relative” descriptions. For pattern definitions and diagrams, refer to TitanFX’s education page: Candlestick Charts and Common Patterns (TitanFX).
1) Hammer (Bottom) / Hanging Man (Top)
- Identification: Body located at the upper end of the price range, lower wick typically ≥ body by about 2x, short or no upper wick.
- Psychology: Strong buying after a downward probe (bottom) or visible selling pressure at the top (top).
- More Reliable Context:
- Hammer appears at the end of a downtrend or near significant support;
- Hanging man appears at the end of an uptrend or near significant resistance.
- Confirmation: The next candle closes in the pattern’s direction (bullish for bottom, bearish for top), ideally with higher volume, preferably “closing beyond the key level.”
- Invalidation/Abandonment: The next candle is engulfed by a strong opposite body; no volume or follow-through; closes back inside the key level.
2) Engulfing Pattern (Bullish/Bearish)
- Identification: The second K-line’s body completely engulfs the first candle’s body (bullish: bullish engulfs bearish; bearish: bearish engulfs bullish).
- Psychology: Dramatic shift in power, with control switching between bulls and bears.
- More Reliable Context: Bullish engulfing is more reliable at the end of a downtrend/support; bearish engulfing is more reliable at the end of an uptrend/resistance.
- Confirmation: Accompanied by higher volume, with the close effectively breaking the key level or continuing in the pattern’s direction. See Pepperstone’s practical advice: 5 Key Candlestick Patterns and Confirmation Ideas (Pepperstone).
- Invalidation/Abandonment: No follow-through volume or continuation; the next candle is engulfed in the opposite direction.
3) Doji (Including Dragonfly, Gravestone, etc.)
- Identification: Open and close are nearly equal, with a very short body.
- Psychology: Bulls and bears are hesitant, awaiting new information or a power shift.
- More Reliable Context: More sensitive at the top/bottom of a clear trend or near key levels.
- Confirmation: Wait for the direction of subsequent K-lines with volume support; doji in consolidation is often noise.
- Invalidation/Abandonment: No clear direction or continued oscillation, with no volume or breakout.
4) Morning Star / Evening Star (3-Candle Combination)
- Identification: Long body → small body/doji → opposite long body (morning star at bottom, evening star at top).
- Psychology: Trend slows → hesitation → opposite force takes over.
- More Reliable Context: Trend end, significant key levels, with volume gradually aligning.
- Confirmation: The third candle preferably has higher volume and closes beyond the midpoint of the first candle’s body.
- Invalidation/Abandonment: The third candle lacks volume or fails to meet the target close; subsequent K-lines negate the breakout.
5) Shooting Star / Inverted Hammer (Long Upper Wick, Small Body)
- Identification: Small body, long upper wick; called shooting star at tops, inverted hammer at bottoms.
- Psychology: Upward move lacks strength (top) or probes a counterattack at the bottom.
- Context and Confirmation/Invalidation: Similar to “hammer/hanging man,” focus on position + close + volume.
6) Three Black Crows / Three White Soldiers (3 Consecutive Bearish/Bullish)
- Psychology: Continuous dominance by one side, reflecting trend continuation or reversal acceleration.
- Context: Better suited as a “continuation confirmation” or “top/bottom acceleration” signal, still requiring key level/volume validation.
- Confirmation/Invalidation: Higher volume + key level breakout is more reliable; shrinking volume or divergence requires caution.
7) Three Inside/Outside (Continuation Pattern)
- Identification: A large body in a trend, followed by several small-body pullbacks/consolidation, then continued by a same-direction large body, with the two large bodies “sandwiching” the small K-lines.
- Psychology: Trend continuation with a brief balance before resuming.
- Confirmation: Breaks out of the consolidation zone in the trend direction with higher volume.
- Invalidation/Abandonment: Breaks out in the opposite direction or shows abnormal volume-price divergence.
3. Place Patterns in the “Trend—Key Level—Volume—Close” Framework
First trend, then position, then pattern, and finally confirm with volume and close. This sequence significantly reduces noise.
- Step 1 | Identify Trend: Switch to a higher timeframe (e.g., 4H to daily, daily to weekly), using high/low structures, trendlines, and moving average slopes to determine the main direction.
- Step 2 | Mark Key Levels: Previous highs/lows, historical dense trading zones, trendline touchpoints, major moving averages (e.g., 50/200), gaps, etc. For support/resistance drawing, refer to: How to Draw Support and Resistance (TioMarkets).
- Step 3 | Examine Patterns: Patterns are only “hints/triggers”; prioritize trend-following signals; counter-trend signals require stricter conditions (stronger position + fuller confirmation).
- Step 4 | Volume and Close Confirmation: Breakouts or reversals with higher volume are more reliable; wait for the current or next candle’s close to confirm, observing before the close. CMC and other brokers’ educational materials emphasize “using in combination with other tools” for robustness, see: Candlestick Charts and Combined Use Suggestions (CMC Markets).
- Step 5 | Risk Control: Set invalidation points in advance (pattern high/low or opposite side of key level), calculate risk-reward ratio, use small position sizes for testing, and enter in batches.
Mini Decision Tree (Text Version):
- If the higher timeframe trend aligns with the current timeframe → proceed to “observe near key levels.”
- If near significant support/resistance → consider patterns; mid-range patterns are often noise.
- If a pattern appears with higher volume → wait for close confirmation;
- If the close holds above/below the key level or continues in the direction → evaluate entry; otherwise, abandon.
Quick Checklist (Must-Read Before Placing Orders):
- Is the trend consistent? (Abandon if higher timeframe conflicts)
- Is it at a key level? (Support/resistance/trendline/moving average/gap)
- Does the pattern qualify? (Relative proportions met, no extreme wick distortions)
- Is there volume support? (Higher volume is better for breakouts/reversals)
- Has the close confirmed? (Current or next candle)
- Is the invalidation point defined? (Price level for admitting error and exiting)
4. Confirmation and Invalidation: Clarify with If/Then
- If a pattern appears but hasn’t closed, Then mark and observe, don’t enter;
- If the pattern completes and the next candle closes in the pattern’s direction (preferably holding the key level), Then consider it preliminarily confirmed;
- If accompanied by higher volume, Then credibility increases; if volume shrinks or diverges, Then reduce weight;
- If the next candle strongly closes in the opposite direction or returns inside the key level, Then deem it invalidated and handle per preset stop-loss;
- If the higher timeframe trend conflicts with the current signal, Then prioritize the higher timeframe and screen strictly, abandoning if necessary.
Pepperstone’s tutorials also emphasize “waiting for pattern completion with volume/key level alignment to filter noise,” see their advanced guide: Advanced Candlestick Charts and Confirmation Ideas (Pepperstone).
5. 7–14 Day Practice Plan (With Daily Actions)
- Days 1–2: Use 6-month charts (any asset and timeframe) to “read psychology” candle by candle, annotating without trading: Who dominated? What do wicks indicate about probes? Where did it close?
- Days 3–4: Focus on 2–3 patterns (e.g., hammer, engulfing, doji), annotating “appearance → context → confirmation/invalidation” on charts.
- Days 5–6: Add trendlines and key levels, recording the distance of each pattern from key levels and outcome changes.
- Days 7–10: Include volume observation, especially noting “higher volume + close confirmation” sample performance.
- Days 11–14: Run small-rule tests in a demo account (enter only with confirmation; define clear invalidation points and fixed risk amounts).
6. Small-Sample Backtest/Review Template (Copy Directly)
Steps: Fix market and timeframe → define rules → filter samples → simulate per rules → analyze → review and optimize. Discussions on “verifying pattern value with samples” are common in communities; combine your rules with methodological insights, e.g., YouQuant’s backtest discussion: Pattern Backtesting and Methodology (YouQuant).
Suggested Sample Size: 20–50 to start; cover uptrends, downtrends, and consolidation; avoid cherry-picking.
Backtest Record Table (Example Fields):
| Sample ID | Date | Asset | Timeframe | Pattern | Position (Support/Resistance/MA/Trendline/Gap) | Volume (Higher/Shrinking/Divergence) | Confirmation (Close/Key Level) | Entry Price | Invalidation Price | Exit Price | Result ® | Notes |
|---|---|---|---|---|---|---|---|---|---|---|---|---|
| 001 | 2024-05-10 | EURUSD | 4H | Bullish Engulfing | Support Zone | Higher | Next candle closed above support | 1.0720 | 1.0685 | 1.0790 | +2.0 | Key level confluence |
| … | … | … | … | … | … | … | … | … | … | … | … | … |
Analysis Suggestions: Win rate, risk-reward ratio, maximum drawdown, average holding period; categorize failure reasons (e.g., “poor position/no volume/higher timeframe conflict/early entry”).
7. Common Misuses and Troubleshooting
- Misuse 1: Over-relying on single candles or patterns.
- Solution: Combine with trend, key levels, volume, and close confirmation; abandon if incomplete.
- Misuse 2: Mechanically applying ratios in low-liquidity/gap-heavy markets.
- Solution: Reduce reliance on wick/body ratios, prioritize “close position and gap structure”; extend timeframe if needed.
- Misuse 3: Chasing false breakouts.
- Solution: Wait for close + volume confirmation; set clear invalidation points; don’t hold overnight if conditions aren’t met.
- Misuse 4: Multi-timeframe signal conflicts.
- Solution: Prioritize higher timeframe; stay out if signals conflict.
- Misuse 5: Heavy positions without risk control.
- Solution: Limit single-trade risk to a fixed account percentage; write down “exit on invalidation” as a hard rule before entering.
8. Applicability and Limitations Across Markets
- Stocks: Frequent gaps and news-driven moves; prioritize close and gap structures; volume-price relationships are more direct.
- Forex: Continuous trading, fewer gaps, coherent trends; structure and moving average signals are more stable.
- Crypto: High volatility, frequent false breakouts; wait for stronger “higher volume + close confirmation + multi-timeframe alignment.” For crypto-specific candlestick reading, refer to Gate’s beginner materials: How to Read Candlestick Charts: Sentiment and Patterns (Gate Learn).
Always remember: Candlestick patterns are not causal prediction tools; their reliability depends on context and confirmation. For a rational overview of “pattern statistical effectiveness,” see Capital.com’s neutral educational document: Candlestick Patterns Overview and Rational Use (Capital.com).
Conclusion: Make “Understand—Judge—Abandon” Muscle Memory
- Understand: Use OHLC and wicks/body to interpret bullish/bearish psychology;
- Judge: Place patterns in trend and key level context, waiting for volume and close confirmation;
- Abandon: Don’t act if conditions aren’t met; the next opportunity is always coming.
Reminder: This content is for educational and informational purposes only and does not constitute investment advice or an invitation to buy or sell. Verify your rules in a demo account or with small positions, strictly implementing stop-loss and capital management.
Candlestick patterns are a micro-projection of market psychology. However, the entire process—from pattern recognition and confirmed entry to stop-loss on failure—is constantly tested by transaction friction. If every pattern capture is diminished by commissions and slippage, even a high win rate may not translate into profit.
BiyaPay provides the perfect execution environment for your global asset allocation. You can trade US and Hong Kong stocks on one platform without a foreign account, benefiting from zero commission on contract order placement. This significantly reduces the trading friction incurred when capturing patterns and making short-term entries/exits. Furthermore, BiyaPay offers real-time exchange rate checks and conversion services, supporting seamless exchange between 30+ fiat currencies and 200+ cryptocurrencies, with remittance fees as low as 0.5%, ensuring same-day transfer and arrival of funds. Register quickly with BiyaPay today to eliminate execution barriers with FinTech and focus purely on the psychological logic behind candlestick patterns.
*This article is provided for general information purposes and does not constitute legal, tax or other professional advice from BiyaPay or its subsidiaries and its affiliates, and it is not intended as a substitute for obtaining advice from a financial advisor or any other professional.
We make no representations, warranties or warranties, express or implied, as to the accuracy, completeness or timeliness of the contents of this publication.


Contact Us
Company and Team
BiyaPay Products
Customer Services


is a broker-dealer registered with the U.S. Securities and Exchange Commission (SEC) (No.: 802-127417), member of the Financial Industry Regulatory Authority (FINRA) (CRD: 325027), member of the Securities Investor Protection Corporation (SIPC), and regulated by FINRA and SEC.
registered with the US Financial Crimes Enforcement Network (FinCEN), as a Money Services Business (MSB), registration number: 31000218637349, and regulated by FinCEN.
registered as Financial Service Provider (FSP number: FSP1007221) in New Zealand, and is a member of the Financial Dispute Resolution Scheme, a New Zealand independent dispute resolution service provider.