- EasyCard
- Trade
- Help
- Announcement
- Academy
- SWIFT Code
- Iban Number
- Referral
- Customer Service
- Blog
- Creator
How to Interpret the PCE Index? Unveiling the True Influence behind the Inflation Barometer


You may often hear about CPI, but in the eyes of the Federal Reserve, the core indicator for measuring inflation is often the PCE index. This article explains in a clear yet rigorous manner: what PCE is, how it differs from CPI, how to quickly interpret its readings, and its typical impact pathways on monetary policy and markets (not investment advice).
What Exactly is the PCE Index (and What It’s Not)
- What It Is: The PCE Price Index (Personal Consumption Expenditures Price Index) measures price changes in goods and services purchased by consumers or paid for by third parties (e.g., employer/government-provided health insurance), serving as a core price indicator in the U.S. National Income and Product Accounts (NIPA) system. This index is released monthly in the “Personal Income and Outlays” report, using a chained Fisher index methodology. The authoritative definition can be found on the Bureau of Economic Analysis (BEA)’s “PCE Price Index Data Page” (continuously updated) and the NIPA methodology handbook (see BEA’s “NIPA Handbook Chapter 5: Personal Consumption Expenditures” PDF, 2024 edition).
- What It’s Not: PCE is not a “cost-of-living index,” as its coverage and weighting differ from CPI; it is also not a trading signal, nor a direct indicator for individual stocks/assets.
Why Does the Federal Reserve Prefer PCE?
The Federal Reserve’s long-term inflation target is 2%, explicitly communicated using the PCE’s year-over-year change. According to the Federal Open Market Committee’s updated “Statement on Longer-Run Goals and Monetary Policy Strategy” in August 2025, reasons for choosing PCE include:
- Broader Coverage: It includes third-party paid consumption (e.g., healthcare), aligning with economic accounting.
- Dynamic Weights: The chained index reflects the “substitution effect” (e.g., switching to chicken if beef prices rise), closer to real consumption patterns.
- Policy Communication Consistency: It integrates with the GDP accounting system, facilitating consistent macroeconomic analysis.
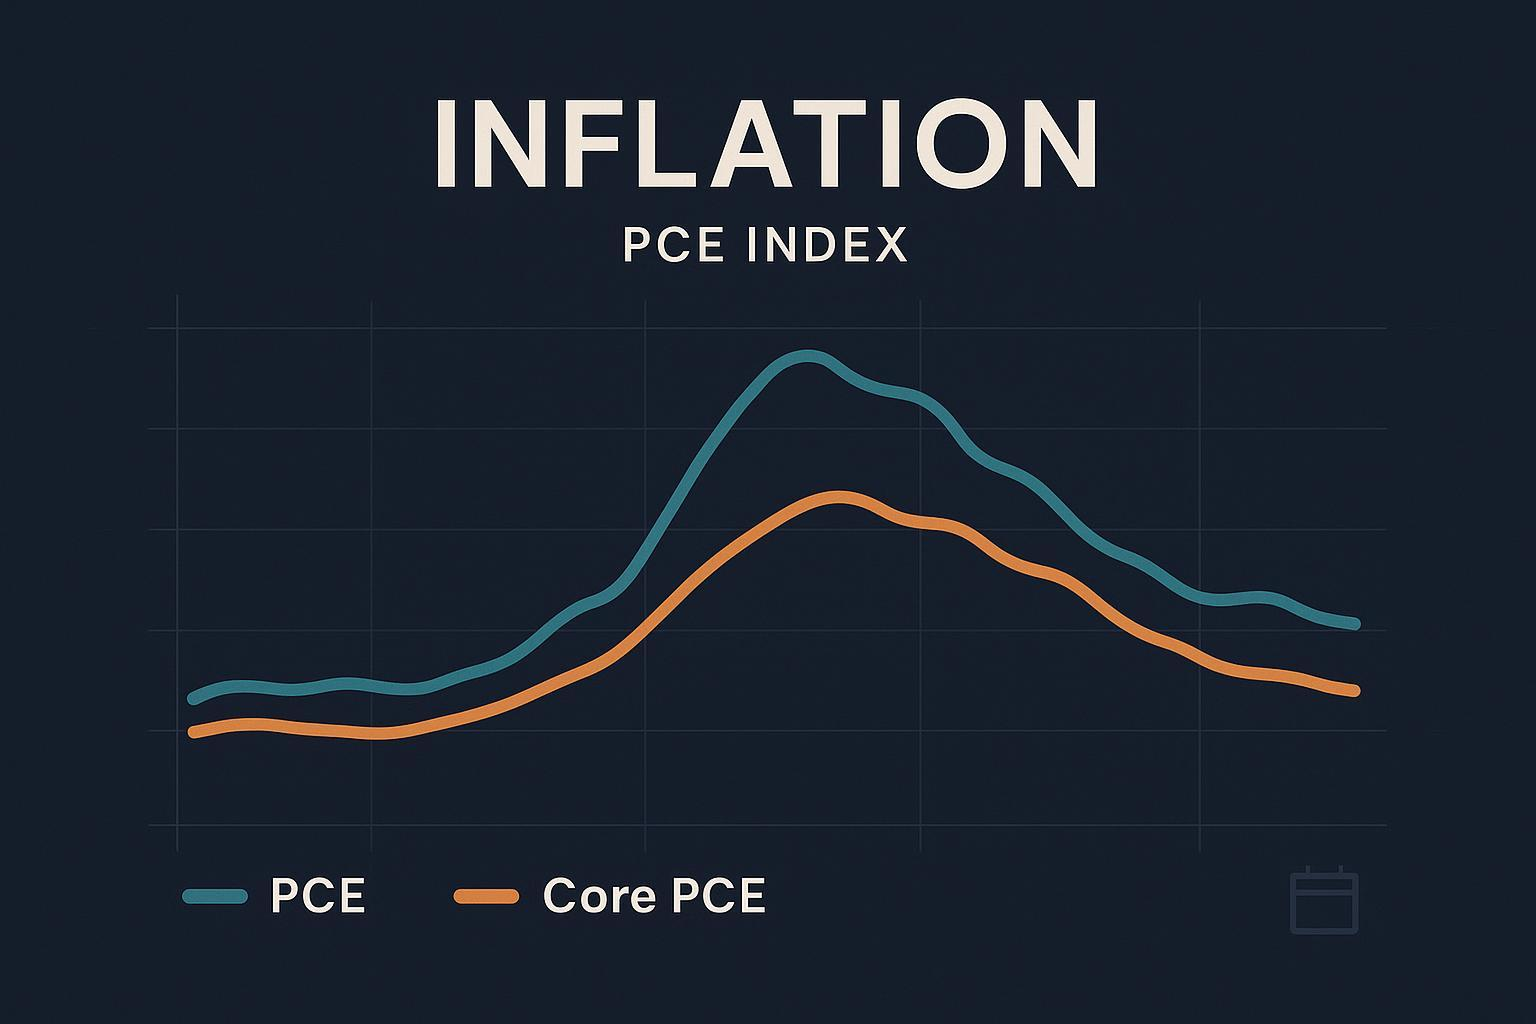
Headline PCE vs. Core PCE: Which Should You Focus On?
- Headline PCE includes all components, directly reflecting “the overall price changes you face in consumption.”
- Core PCE excludes food and energy, not to be “lower” or “better,” but to reduce noise, making it easier to observe underlying inflation trends. In practice, both should be examined: when energy or food shocks are significant, headline and core may diverge temporarily.
Four Steps to Quickly Read PCE (Practical Guide)
The monthly “Personal Income and Outlays” report provides PCE’s month-over-month, year-over-year, and component breakdowns. Here’s how to read it (data access via BEA’s “Personal Income and Outlays” page, continuously updated):
- First, check if core and headline PCE move “in the same direction and magnitude.” If they diverge, initially assess whether high-volatility components like energy/food are driving it.
- Look at monthly month-over-month (m/m) changes: These capture short-term momentum and turning points but are more affected by seasonality and single-month noise.
- Look at 12-month year-over-year (y/y) changes: These identify medium- to long-term trends, with the “distance” from the 2% target typically communicated in y/y terms.
- Look at “three-month annualized” or “recent three/six-month trends”: Convert recent m/m changes to an annualized rate to gauge current inflation momentum. But note, this annualized calculation assumes “future months maintain the current/recent pace.”
PCE vs. CPI: Three Key Differences (and Common Misconceptions)
Understanding the differences helps explain why “CPI may be higher (or lower) than PCE in the same month.”
- Coverage Scope: PCE has broader coverage, including third-party paid expenditures; CPI is closer to urban residents’ “out-of-pocket” consumption.
- Weighting Methodology: PCE weights come from expenditure accounts, dynamically updated over time; CPI weights primarily come from household survey baskets. Healthcare and housing weights differ significantly between the two.
- Index Methodology: PCE uses a chained Fisher index, capturing substitution effects; CPI historically used a Laspeyres index (though improved). Empirically, CPI readings are “often” slightly higher than PCE, but the gap is not constant, influenced periodically by energy, housing, and healthcare estimates. For a discussion on their “similar yet distinct” trends, see the St. Louis Fed’s 2023 FRED Blog “Watching CPI and PCE Inflation in FRED”.
Release Schedule and Revisions: Be Mindful of “Later Changes”
- Release Frequency: PCE and core PCE are released monthly by BEA in the “Personal Income and Outlays” report (typically at the end of the month for the prior month’s data).
- Revision Mechanism: As more underlying data becomes available, monthly figures are routinely revised; BEA also conducts annual benchmark updates and periodic “comprehensive revisions,” backdating multi-year data to incorporate new methods and fuller samples. When making historical comparisons, pay attention to base period and weight changes.
Typical Impact Pathways on Markets and Policy (Not Investment Advice)
- Data → Expectations: If core PCE’s m/m or three-month annualized rate significantly exceeds market expectations, nominal and real interest rates, the dollar, and risk assets may rapidly reprice; the reverse also applies.
- Components → Context: If services (especially housing and healthcare) are the main drivers, markets may interpret this as “sticky inflation”; if driven by energy, it’s typically seen as more “exogenous” volatility.
- Nonlinear Decisions: A single-month “surprise” does not automatically equate to rate hikes/cuts. The FOMC considers employment, growth, financial conditions, and inflation expectations holistically. Risk Warning: This article is for informational and educational purposes only and does not constitute investment advice or guarantees about future policy/market behavior.
Common Misconception Checklist
- Treating PCE as a “cost-of-living index”? Wrong. Its scope differs from CPI and cannot be used interchangeably.
- Thinking “core is always lower/better”? Wrong. Core is merely a less volatile tool for tracking trends.
- Drawing conclusions from single-month m/m changes? Not robust enough. Also observe y/y and three-month annualized trends, alongside components.
- Ignoring revisions and base periods? Before historical comparisons, verify if methodology or weights have been updated.
Data Access and Further Learning
- Official Source: Monthly reports and details are available on BEA’s “Personal Income and Outlays” data page. PCE definitions, scope, and long-term series are on BEA’s “PCE Price Index Data Page”.
- Authoritative Methodology: Statistical scope, weights, and chained index methods are detailed in BEA’s “NIPA Handbook Chapter 5: Personal Consumption Expenditures” PDF (2024).
- Policy Framework: The Federal Reserve targets 2% y/y PCE as its long-term goal, detailed in the 2025-updated “FOMC Statement on Longer-Run Goals and Monetary Policy Strategy”.
- Practical Tips: To create charts or backtest, search for series IDs “PCEPI” (headline PCE) and “PCEPILFE” (core PCE) in the Fed’s FRED database, and use FRED’s charting tools for segmented annualized and component comparisons. For a visual discussion of their relationship, see the St. Louis Fed’s FRED Blog (2023).
As of 2025-10-14, the above scope and links are sourced from publicly available official and Federal Reserve system materials; if sources are updated subsequently, refer to the latest pages.
The PCE index is crucial for identifying the true path of inflation and anticipating monetary policy shifts. Yet, regardless of the inflation data, your investment decisions ultimately require a low-cost, highly efficient execution platform. Every shift in macro trends may demand rapid adjustment of your stocks allocation or optimization of cross-border capital flow. In a volatile market, high remittance fees and opaque exchange rates can be your biggest hurdles.
BiyaPay provides you with a robust tool to navigate macro changes. We offer real-time exchange rate checks and conversion services, ensuring you can convert between fiat and digital currencies at the most transparent rates, whether inflation is rising or falling. Our remittance fees are as low as 0.5%, supporting most countries and regions globally, and facilitating same-day transfer and arrival—effectively eliminating cross-border capital friction. For added convenience, you can trade US and Hong Kong stocks on one platform without a foreign account, benefiting from zero commission on contract order placement. Register quickly with BiyaPay today to translate your macro insights into effective global asset allocation.
*This article is provided for general information purposes and does not constitute legal, tax or other professional advice from BiyaPay or its subsidiaries and its affiliates, and it is not intended as a substitute for obtaining advice from a financial advisor or any other professional.
We make no representations, warranties or warranties, express or implied, as to the accuracy, completeness or timeliness of the contents of this publication.


Contact Us
Company and Team
BiyaPay Products
Customer Services


is a broker-dealer registered with the U.S. Securities and Exchange Commission (SEC) (No.: 802-127417), member of the Financial Industry Regulatory Authority (FINRA) (CRD: 325027), member of the Securities Investor Protection Corporation (SIPC), and regulated by FINRA and SEC.
registered with the US Financial Crimes Enforcement Network (FinCEN), as a Money Services Business (MSB), registration number: 31000218637349, and regulated by FinCEN.
registered as Financial Service Provider (FSP number: FSP1007221) in New Zealand, and is a member of the Financial Dispute Resolution Scheme, a New Zealand independent dispute resolution service provider.