- EasyCard
- Trade
- Help
- Announcement
- Academy
- SWIFT Code
- Iban Number
- Referral
- Customer Service
- Blog
- Creator
What Do Option Trading Volume and Open Interest Mean? A Deep Dive into the Two Core Indicators of the Options Market


Why Are These Two Indicators Worth Your Time?
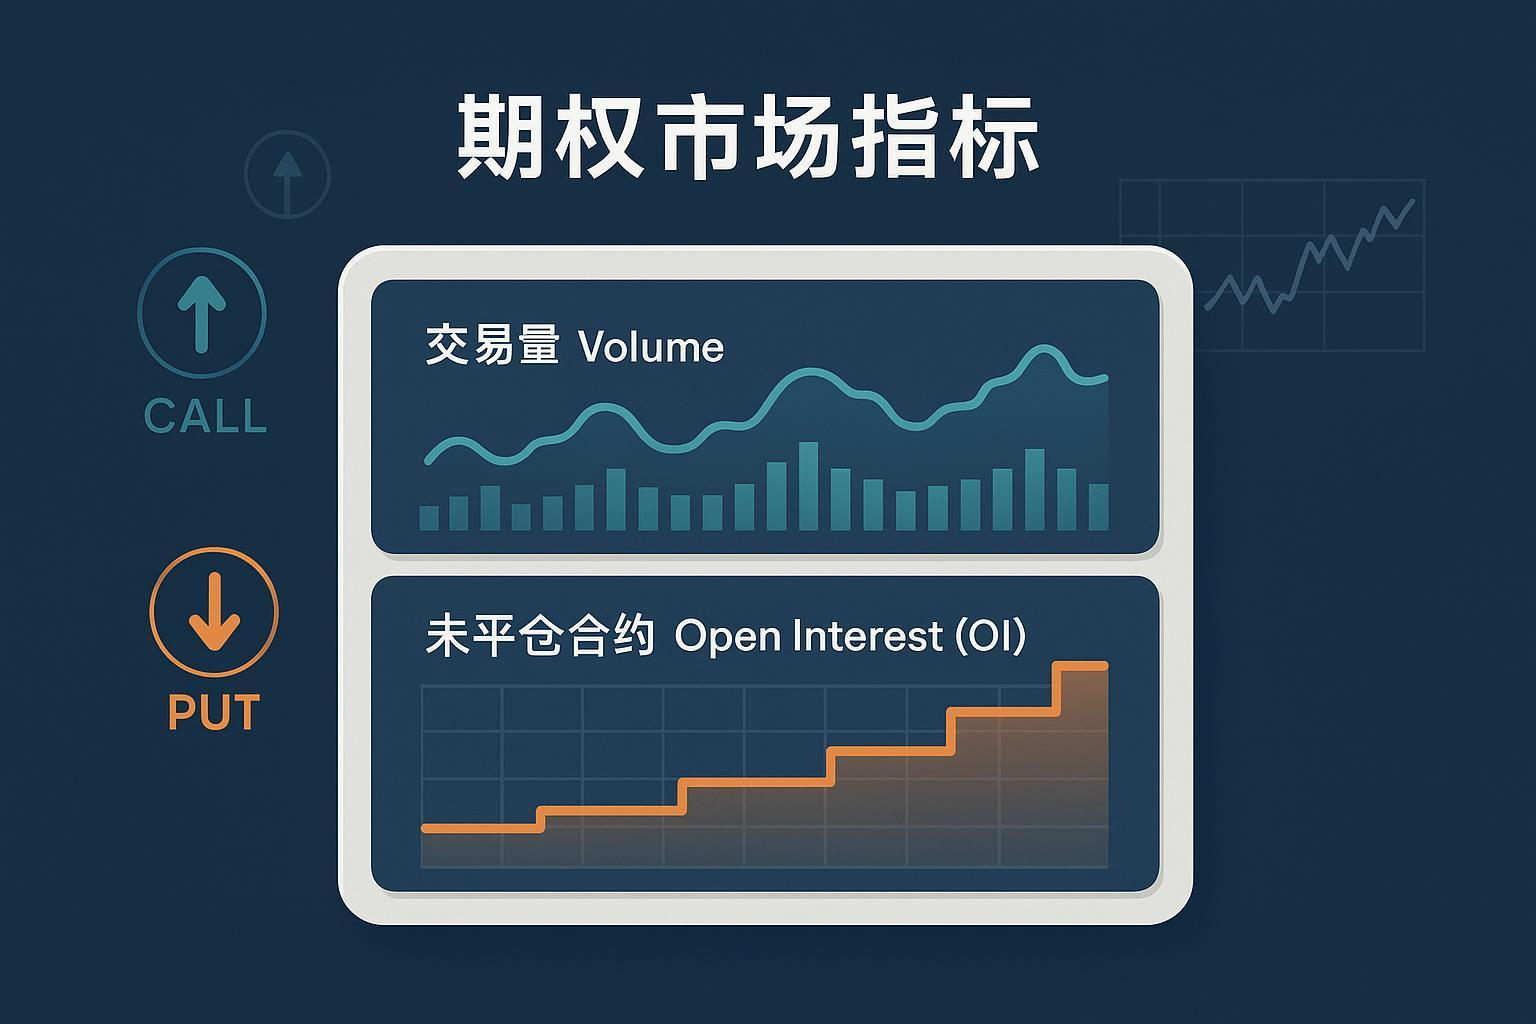
In the world of options, Volume and Open Interest (OI) are like a river’s “flow rate” and “water storage.” The former tells you how fast the water is flowing today, while the latter shows how much water remains in the river at this moment. Only by looking at both together can you better judge: Are funds entering, exiting, or just changing hands?
This article breaks down these two indicators in plain language, covering their definitions, calculation and update mechanisms, typical scenario interpretations, common pitfalls, and new changes in the 0DTE trend, supported by authoritative exchange and clearinghouse materials.
One-Sentence Definitions (Build Intuition First)
- Volume: The number of option contracts traded within a specific period, a “flow” indicator. It accumulates during the trading day and is finalized after market close.
- Open Interest (OI): The number of contracts still open (not offset, exercised, or settled) at the end of the trading day, a “stock” indicator. For an authoritative definition, refer to CME’s educational materials, which clarify that OI is measured at the “end of the trading day,” distinct from intraday volume, serving as a measure of outstanding positions. See CME Group’s Open Interest Education Page.
Calculation and Updates: Why Is Volume Fast and OI Slow?
- How Volume is Calculated: Every matched trade during the day contributes to volume, accumulating intraday and finalizing as the day’s total volume after market close.
- How OI Changes: It can be roughly understood as “previous day’s OI + new positions opened today − positions closed today ± contracts settled due to expiration/exercise.” If trades are merely transferred between accounts (e.g., A sells, B buys) without increasing or decreasing total contracts, OI may remain unchanged. CME emphasizes its “end-of-day stock” nature, not a sum of intraday trades, as noted in the aforementioned CME Open Interest Education Page.
- Release Schedule: Many markets publish daily official data after market close, with volume and OI available at the same source. Refer to CME Group’s Daily Volume and Open Interest Page, which consistently aggregates “Daily Exchange Volume and Open Interest.”
- Regulatory and Statistical Basis: The end-of-day metric aligns with reporting requirements for large trader positions. CME’s compliance rules mandate daily reporting, providing the regulatory backdrop for OI’s end-of-day calculation, see CME Group Rule 561 (Regulatory Notice, Updated 2023–2025).
In the Chinese market context, open positions are settled or closed at the delivery settlement price after the last trading day, further illustrating OI’s “post-settlement stock” nature. Refer to the China Financial Futures Exchange’s rules (2024–2025 versions), such as CFFEX Settlement/Delivery Rules (Official PDF).
Core Differences and Connections (Quick Mastery Through Comparison)
- Different Meanings:
- Volume is “how much was traded today.”
- OI is “how many contracts remain open at day’s end.”
- Time Attributes:
- Volume accumulates instantly intraday, fluctuating quickly.
- OI is typically based on end-of-day settlement, updating slowly.
- Market Signals:
- High Volume doesn’t always mean “new funds entering”; it could be existing positions offsetting or rolling over.
- OI changes better indicate whether “funds are truly adding or reducing positions.”
- Typical Uses:
- Volume is often used to identify “event-day activity” or “short-term trading intensity.”
- OI is used to assess “trend continuation” or “potential exercise/settlement pressure zones.”
Reading the Market with a Three-Way Combo: Price × Volume × OI
You might wonder: How do you interpret these three together? Use this empirical framework to “read market dynamics” (not deterministic signals, requires multi-dimensional validation):
- Price Up + OI Up + Volume Surge: Often driven by “new long positions,” increasing the likelihood of continued upward momentum, but check if implied volatility (IV) rises concurrently.
- Price Up + OI Down + Volume Surge: More likely “short covering” or short-term handoff rallies, with questionable sustainability.
- Price Down + OI Up + Volume Surge: Typically driven by “new short positions,” potentially strengthening downward pressure.
- Price Down + OI Down + Volume Surge: Likely triggered by long-position stop-losses or reductions, with potential stabilization if volume later declines.
Real-World Example:
- Around earnings weeks, a company’s call option Volume spikes, but OI remains nearly unchanged—often indicating intense short-term trading without significant overnight positions.
- On a day of index breakdown, prices fall with both OI and Volume rising—more likely “new short positions,” signaling potential trend continuation.
This methodology aligns with exchange educational materials distinguishing “Volume as trade flow, OI as position stock,” as seen in the CME Open Interest Education Page (English).
Common Pitfalls and Risk Reminders (Must Avoid)
- Does High Volume Equal New Funds Entering? Not necessarily. High volume could stem from new openings, closings, or handoffs between accounts. To gauge fund flows, check if OI changes concurrently. Refer to CME’s “end-of-day stock” definition and examples.
- Ignoring OI’s “End-of-Day Metric.” Intraday OI is often estimated or delayed; strategy reviews should use official end-of-day data. Verify finalized data at CME’s Daily Volume and OI Portal (based on the day’s timestamp).
- Slippage and Spread Risks in Low-OI Contracts. Low OI often means thin liquidity and wider spreads, especially during event-driven markets or expiration weeks.
- 0DTE Causing “High Volume but Stable OI.” Zero-day-to-expiration contracts see extremely active intraday trading but expire at close, leaving little to no end-of-day OI. Cboe’s 2025 quarterly data provides context: SPX total option average daily volume (ADV) was about 3.7 million contracts, with SPX 0DTE around 2.1 million, roughly 57% of the total, see Cboe’s June 2025 Trading Volume Press Release.
- Data Discrepancies and Aggregation Errors. Different platforms’ timestamps, deduplication, and aggregation methods may vary. Stick to original exchange or clearinghouse data, such as the Options Clearing Corporation’s Market Data Portal for authoritative volume and OI overviews (based on the year accessed).
Structural Changes Post-0DTE Rise: Why Are “Volume” and “OI” More Decoupled?
With 0DTE strategies gaining popularity in U.S. stock index options, intraday trading’s “short-term nature” has intensified:
- Intraday Trading Dominance. Many trades open and close within the day, boosting Volume, but since they expire same-day, they rarely contribute to end-of-day OI.
- Risk Peaks Not Always Reflected at Day’s End. Intraday risk exposure may peak significantly, but if hedged or expired by close, end-of-day OI may not reflect this peak.
- Thus, analyzing market structure requires combining IV, term structure, and position distribution (by strike price and expiration). This aligns with Cboe’s 2025 SPX 0DTE and total ADV figures, as noted in the Cboe June 2025 Trading Volume Press Release.
How to Pair with Other Key Indicators?
- Implied Volatility (IV): Reflects market pricing of future volatility. Combining Price × Volume × OI signals with significant IV spikes often indicates shifts in risk appetite or hedging demand.
- Put/Call Ratio: When used with Volume or OI, it reveals sentiment bias and potential crowding.
- Position Distribution (by Strike/Expiration): Helps identify potential “exercise/settlement pressure zones” and “maximum pain points.”
Practical Checklist: Apply the Framework to Your Screen
- Observation Sequence: First check “if daily Volume is significantly abnormal” → compare “if OI changes concurrently” → then overlay “price direction and IV changes.”
- Scenario Matching:
- Event Days (Earnings, Macro Data): Volume often spikes first; use OI to judge if overnight positions remain.
- Trend Tracking: Price and OI moving in the same direction with strong volume increase the likelihood of continuation (not guaranteed).
- Expiration Weeks and 0DTE: Be cautious with “high volume” signals, focus on IV and market-making depth; avoid heavy positions in low-OI contracts to prevent slippage.
- Data Source Management: Prioritize exchange or clearinghouse data, such as CME’s Daily Data Page, OCC Market Data Portal; when cross-referencing platforms, note timestamp and aggregation method differences.
Summary
- Volume is “flow,” OI is “stock.” The former is fast, reflecting daily activity; the latter is slow, revealing whether funds stay in the market.
- Analyze markets using the “Price × Volume × OI” combo, validated with IV, position distribution, and term structure.
- In the 0DTE era, “rising volume without rising OI” is more common. Strategy decisions should respect exchange statistical standards and update schedules (based on the day), avoiding mistaking intraday noise for trend signals.
To ensure accuracy, this article’s key definitions, metrics, and data examples reference authoritative public materials: CME’s education and daily data, CME Rule 561’s end-of-day reporting framework, CFFEX’s settlement/delivery rules (2024–2025), and Cboe’s 2025 trading volume press release.
In the 0DTE era, interpreting Option Volume and Open Interest is crucial for judging market sentiment and capital flow. However, regardless of whether your analysis points to new long entry or short covering, the ultimate profit depends on the cost of execution. In volatile markets, high commissions and slippage can directly negate the accuracy of your Volume/OI analysis.
BiyaPay provides the perfect execution environment for your global asset allocation. You can trade US and Hong Kong stocks on one platform without a foreign account, benefiting from zero commission on contract order placement. This significantly reduces your transaction costs, whether dealing with high Volume or low OI contracts. Furthermore, BiyaPay offers real-time exchange rate checks and conversion services, supporting seamless exchange between 30+ fiat currencies and 200+ cryptocurrencies, with remittance fees as low as 0.5%, ensuring same-day transfer and arrival of funds. Register quickly with BiyaPay today to leverage financial technology and translate your deep understanding of the two core option market metrics into optimized global asset allocation returns.
*This article is provided for general information purposes and does not constitute legal, tax or other professional advice from BiyaPay or its subsidiaries and its affiliates, and it is not intended as a substitute for obtaining advice from a financial advisor or any other professional.
We make no representations, warranties or warranties, express or implied, as to the accuracy, completeness or timeliness of the contents of this publication.


Contact Us
Company and Team
BiyaPay Products
Customer Services


is a broker-dealer registered with the U.S. Securities and Exchange Commission (SEC) (No.: 802-127417), member of the Financial Industry Regulatory Authority (FINRA) (CRD: 325027), member of the Securities Investor Protection Corporation (SIPC), and regulated by FINRA and SEC.
registered with the US Financial Crimes Enforcement Network (FinCEN), as a Money Services Business (MSB), registration number: 31000218637349, and regulated by FinCEN.
registered as Financial Service Provider (FSP number: FSP1007221) in New Zealand, and is a member of the Financial Dispute Resolution Scheme, a New Zealand independent dispute resolution service provider.