- EasyCard
- Trade
- Help
- Announcement
- Academy
- SWIFT Code
- Iban Number
- Referral
- Customer Service
- Blog
- Creator
The Barometer of the US Stock Market Economy: Why the S&P 500 is Regarded as the Gold Standard


Image Source: unsplash
The S&P 500 index has long been regarded as the U.S. stock market barometer. It represents major U.S. listed companies and holds significant market authority. Investors and analysts typically use the S&P 500 as a benchmark to gauge U.S. economic performance. Compared to other market indices, the S&P 500’s broad coverage accurately reflects the overall state of the U.S. economy.
Key Points
- The S&P 500 index covers the 500 largest U.S. companies by market capitalization, accurately reflecting the overall health of the U.S. economy.
- The S&P 500’s market-cap-weighted design ensures that larger companies have a greater impact on the index, helping investors track market changes promptly.
- Investors and analysts widely use the S&P 500 as a benchmark to compare portfolio performance and optimize asset allocation.
- The S&P 500’s diversified industry distribution reduces the risk of single-sector volatility, offering more stable investment returns.
- Policymakers analyze S&P 500 fluctuations to assess economic conditions and formulate corresponding economic policies.
U.S. Stock Market Barometer and Gold Standard

Image Source: unsplash
Representativeness and Authority
The S&P 500 index is called the U.S. stock market barometer primarily due to its high representativeness. It covers the 500 largest U.S. listed companies across major industries. These companies play a central role in the U.S. economy, reflecting its overall health. The S&P 500’s authority also stems from its historical significance:
- In 1957, the S&P 500 was officially launched as the first computer-generated stock index. This innovation made index calculations more scientific and transparent.
- In the 1980s and 1990s, the rise of technology and financial services industries drove changes in the index’s structure, aligning it more closely with U.S. economic realities.
- During the 2008 financial crisis, the S&P 500 experienced sharp declines. Post-crisis, new companies in healthcare and technology joined, further enhancing its representativeness.
These historical events have solidified the S&P 500 as the widely accepted U.S. stock market barometer. Whenever the U.S. economy fluctuates, markets focus on the S&P 500’s performance. It not only reflects the operating conditions of major companies but also indirectly reveals broader U.S. economic trends.
Market Influence
The S&P 500 index holds significant influence in global financial markets. Many investment funds, pension plans, and insurance companies use it as a benchmark for asset allocation. U.S. market investors widely regard it as a key measure of investment returns and risks. The S&P 500’s movements often guide global capital flows, influencing market sentiment in other countries and regions.
Many economists and policymakers also refer to the S&P 500’s performance to determine whether the U.S. economy is in an expansion or contraction phase. Its authority and widespread use make the S&P 500 the gold standard for the U.S. stock market barometer.
The S&P 500 is more than just a number; it symbolizes U.S. economic vitality and market confidence. Every fluctuation captures the attention of global investors, making it an indispensable tool for interpreting the U.S. economy.
Index Composition and Coverage
Industry Distribution
The S&P 500 index covers major U.S. economic sectors. Technology, healthcare, financials, consumer goods, and industrials all hold significant weight. Technology companies, such as software and hardware manufacturers, have a substantial share. Healthcare includes pharmaceuticals, biotechnology, and medical equipment firms. Financials encompass banks, insurance, and investment companies. Consumer goods are divided into staples and discretionary, reflecting U.S. consumer spending and lifestyles. Industrials cover manufacturing, transportation, and infrastructure.
The S&P 500’s industry distribution helps investors gain a comprehensive view of U.S. economic diversity. Each sector’s performance impacts the index’s overall trend, making it a true barometer of economic changes.
Market-Cap Weighting
The S&P 500 uses a market-cap-weighted methodology. Companies with larger market capitalizations have greater influence on the index. For example, tech giants with higher market caps impact the index more significantly. This weighting ensures the index reflects market changes promptly. As a company’s market cap rises, its weight increases automatically; as it falls, its weight decreases.
The table below shows the market-cap weight distribution of select S&P 500 sectors (data for illustrative purposes):
| Sector | Market-Cap Weight (%) |
|---|---|
| Technology | 28 |
| Healthcare | 14 |
| Financials | 11 |
| Consumer Goods | 13 |
| Industrials | 8 |
This market-cap weighting ensures the index’s representativeness. Investors can track weight changes to understand shifts in the U.S. economic structure.
Comparison with Other Indices and Assets

Image Source: pexels
Dow Jones and Nasdaq
The U.S. market features several key indices. The Dow Jones Industrial Average, Nasdaq Composite, and S&P 500 each have distinct characteristics. The Dow includes only 30 large U.S. companies, primarily from traditional industries. The Nasdaq Composite covers nearly all stocks traded on Nasdaq, with a heavy technology focus. The S&P 500 selects 500 of the largest listed companies, offering broader industry coverage and a more comprehensive reflection of the U.S. economy.
The table below compares the composition and calculation methods of the three indices:
| Index Name | Number of Companies | Calculation Method |
|---|---|---|
| Nasdaq Composite | Nearly all Nasdaq stocks | Heavily influenced by tech performance |
| Dow Jones Industrial Average | 30 | Tracks 30 major U.S. companies |
| S&P 500 | 500 | Provides a broader view of U.S. market |
The S&P 500’s market-cap weighting reflects market structure changes promptly. In contrast, the Dow is more susceptible to individual company impacts, and the Nasdaq is heavily influenced by tech sector volatility. As a U.S. stock market barometer, the S&P 500 more accurately reflects the overall economy.
Gold and Diversification
Gold is considered a safe-haven asset with low correlation to stock markets. Investors often turn to gold for preservation during uncertainty. However, gold doesn’t reflect corporate earnings or economic growth. The S&P 500, by contrast, represents the performance of major U.S. companies, directly reflecting economic vitality.
The S&P 500 also offers diversification benefits. Its multi-sector coverage reduces single-industry risks. Investors can capture overall U.S. economic growth through the S&P 500, while gold primarily serves as a risk hedge. Both play distinct roles in asset allocation, but the S&P 500 is more representative for measuring economic performance and long-term investment value.
Applications in Investment and Economic Analysis
Investment Decisions
The S&P 500 plays a central role in investment decisions. Many institutional investors use it as a benchmark for portfolios. By comparing portfolio returns to the S&P 500, investors can assess strategy effectiveness. For example:
- Actual return is the profit an investor earns.
- Relative return compares portfolio performance to the S&P 500.
- If a portfolio yields 12% while the S&P 500 returns 28%, the portfolio underperforms the benchmark.
This comparison helps investors adjust asset allocations and optimize strategies. The S&P 500’s diversification reduces single-sector volatility risks. Many U.S. market funds, pensions, and insurers use it as a benchmark to ensure scientific and rational asset allocation. By tracking S&P 500 trends, investors can make more informed decisions.
Policy Reference
Policymakers also prioritize the S&P 500’s performance. The U.S. government and agencies regularly analyze its fluctuations to assess economic conditions. As a U.S. stock market barometer, the S&P 500 reflects corporate profitability and market confidence. Policymakers observe index changes to determine whether the economy is expanding or contracting.
For instance, during economic downturns, S&P 500 declines may prompt stimulus measures. Sustained rises indicate robust economic vitality, allowing stable policies. The S&P 500’s data provides critical input for economic analysis and policy adjustments, making it a vital tool for U.S. economic management.
Case Studies on Barometer Role
Recent Market Performance
The S&P 500 holds a prominent position in global financial markets. After the COVID-19 pandemic, global stock markets faced significant volatility. As a U.S. stock market barometer, the S&P 500’s performance drew particular attention. During the pandemic, average returns across all market indices were negative, with significantly increased volatility. U.S. investors closely monitored S&P 500 changes. Key observations from the pandemic period include:
- After COVID-19 was declared a pandemic, all selected indices performed significantly better than pre-pandemic levels.
- Stock markets worldwide were impacted, with Brazil, India, Russia, and Spain hit hardest.
- The S&P 500 showed strong recovery among global indices, attracting substantial capital inflows.
By tracking S&P 500 movements, investors could promptly gauge market sentiment and economic shifts. Its performance provided a reference for global markets, serving as a key tool for analyzing economic recovery.
Economic Cycle Correlation
The S&P 500 exhibits some correlation with U.S. economic cycles. Historical data shows that the index typically declines during recessions, though the correlation isn’t absolute. The table below illustrates S&P 500 performance across economic cycles:
| Economic Cycle | S&P 500 Performance | Correlation |
|---|---|---|
| 2020 Pandemic | Market loss of 63.4% | 0.30 |
| Other 31 Recessions | Near-zero correlation | N/A |
During the 2020 pandemic, the S&P 500’s correlation with the economic cycle was higher, but in other recessions, it was minimal. Investors and analysts use the S&P 500 to observe economic cycle trends. As a U.S. stock market barometer, it continues to provide reference value, helping market participants understand economic dynamics.
Future Outlook
Sustained Prominence
The S&P 500 maintains its core position in global financial markets. Several factors reinforce its dominance as a market benchmark:
- The S&P 500 uses market capitalization weighting, accurately reflecting the performance of major U.S. listed companies.
- High concentration among top companies significantly influences overall market trends.
- Significant assets flow into the S&P 500 through index-based investing, enhancing its market influence.
- Modern Portfolio Theory (MPT) uses the S&P 500 as a key reference for optimizing asset allocation.
- The index evolves continuously, forming a diversified investment ecosystem that attracts global investors.
Global investors widely recognize the S&P 500’s historical dominance. They view its long-term performance as stable but acknowledge future uncertainties. Historical patterns show market leadership rotates—energy in the 1980s, Japan’s Nikkei 225 from 1980-1989, and emerging market stocks from 2003-2007 once led markets. Valuation changes drive long-term returns, and no single asset class or country dominates indefinitely.
Challenges and Changes
The S&P 500 faces multiple future challenges. U.S. labor market growth is slowing, with recent nonfarm payrolls far below expectations, averaging just 35,000 jobs added over three months. Corporate earnings are uneven—while overall earnings growth exceeds 9%, only three sectors achieved double-digit growth. Inflation pressures are rising, with core CPI growing at 2.9% annually, projected to reach 3.3%.
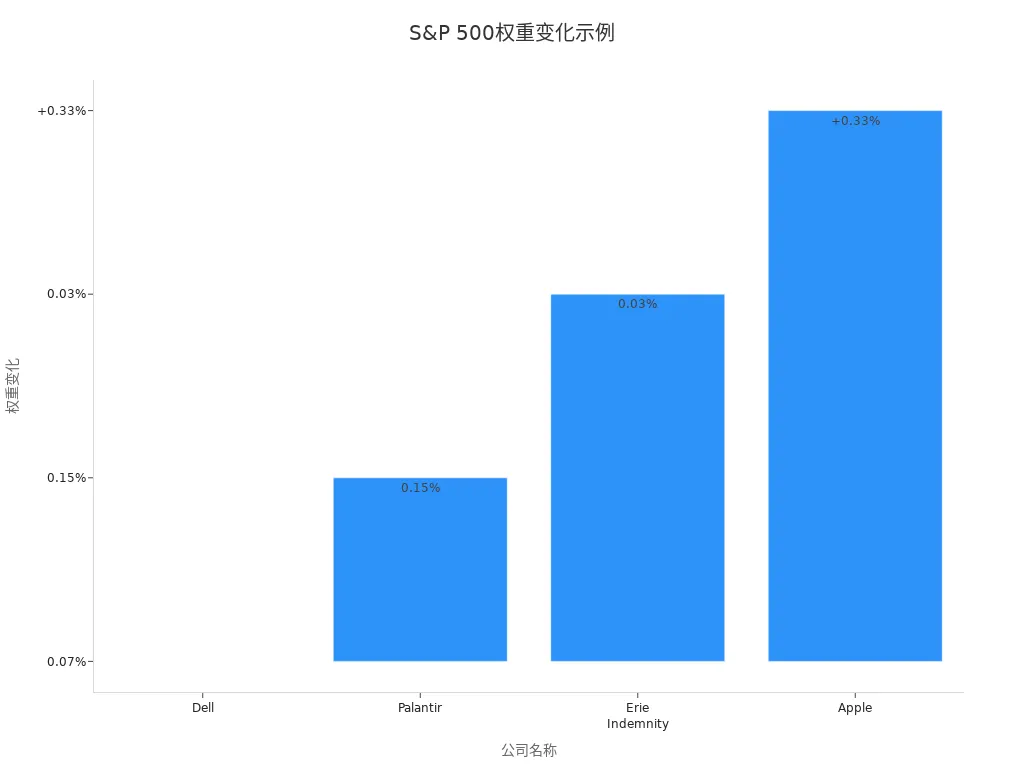
Technological innovation and regulatory changes continue to reshape the S&P 500’s composition. The table below shows weight changes for select companies:
| Company Name | Weight Change | Sector |
|---|---|---|
| Dell | 0.07% | Information Technology |
| Palantir | 0.15% | Information Technology |
| Erie Indemnity | 0.03% | Property & Casualty Insurance |
| Apple | +0.33% | Information Technology |
Technology companies’ rising weights drive structural changes in the index. Going forward, innovation and industry shifts will continue to influence the S&P 500’s composition and performance.
As the U.S. stock market barometer, the S&P 500 must navigate economic cycles, market volatility, technological advancements, and industry changes. Investors and analysts need to monitor these shifts to stay attuned to U.S. economic and market dynamics.
The S&P 500, as the U.S. stock market barometer, continues to play a central role in global financial markets. Experts believe economic growth and corporate earnings drive long-term market performance. U.S. stock valuations are high, with greater potential in international markets. Global investors are reassessing asset allocations. The S&P 500 remains indispensable in investment, economic analysis, and policymaking. Investors should track its structural changes to capture long-term value.
FAQ
How are companies selected for the S&P 500 index?
The S&P 500 is curated by a professional committee that periodically reviews companies based on market capitalization, liquidity, and sector representativeness, selecting 500 U.S. listed firms.
What are common ways to invest in the S&P 500?
Investors can participate through ETFs or index funds tracking the S&P 500, listed on major U.S. exchanges for convenient trading.
How does the S&P 500 differ from the Dow Jones?
The S&P 500 includes 500 companies with broad sector coverage, while the Dow covers 30 large firms, mainly in traditional industries. The S&P 500 better reflects the U.S. economy.
Is the S&P 500 suitable for long-term investment?
Many analysts view the S&P 500’s historical performance as stable. Long-term holding diversifies risk and captures U.S. economic growth.
How does the S&P 500 compare to gold investing?
The S&P 500 reflects corporate earnings and economic growth, while gold serves as a risk hedge. They play different roles in asset allocation, chosen based on investor needs.
The S&P 500, as the gold standard for gauging the U.S. economy, empowers investors to track market trends and optimize asset allocation, but challenges like high cross-border remittance fees, exchange rate volatility, and platform complexities can increase costs or limit trading efficiency.
BiyaPay offers a seamless financial platform to overcome these hurdles. Our real-time exchange rate queries provide instant access to fiat and digital currency conversion rates across various currencies, ensuring transparency and efficiency. With remittance fees as low as 0.5%, covering most countries globally and enabling same-day transfers, BiyaPay supports your S&P 500-related investments with swift fund access. Plus, you can trade US and Hong Kong stocks via our stocks feature without needing an overseas account, leveraging S&P 500 trends to enhance your portfolio. Sign up with BiyaPay today to boost your trading efficiency, seize U.S. market opportunities, and achieve steady wealth growth!
*This article is provided for general information purposes and does not constitute legal, tax or other professional advice from BiyaPay or its subsidiaries and its affiliates, and it is not intended as a substitute for obtaining advice from a financial advisor or any other professional.
We make no representations, warranties or warranties, express or implied, as to the accuracy, completeness or timeliness of the contents of this publication.


Contact Us
Company and Team
BiyaPay Products
Customer Services


is a broker-dealer registered with the U.S. Securities and Exchange Commission (SEC) (No.: 802-127417), member of the Financial Industry Regulatory Authority (FINRA) (CRD: 325027), member of the Securities Investor Protection Corporation (SIPC), and regulated by FINRA and SEC.
registered with the US Financial Crimes Enforcement Network (FinCEN), as a Money Services Business (MSB), registration number: 31000218637349, and regulated by FinCEN.
registered as Financial Service Provider (FSP number: FSP1007221) in New Zealand, and is a member of the Financial Dispute Resolution Scheme, a New Zealand independent dispute resolution service provider.