- EasyCard
- Trade
- Help
- Announcement
- Academy
- SWIFT Code
- Iban Number
- Referral
- Customer Service
- Blog
- Creator
Non-Farm Payrolls Report: Interpreting the Key Data of the US Labor Market


Image Source: unsplash
The Non-Farm Payroll Report, published monthly, provides key data on U.S. non-farm job creation, unemployment rate, and average hourly earnings. The table below summarizes the main data points in the report:
| Data Point | Description |
|---|---|
| Non-Farm Job Creation | Shows the number of jobs added by U.S. businesses, government, and institutions, excluding agriculture. |
| Unemployment Rate | Measures the overall health of the labor market; changes in the unemployment rate reflect economic conditions. |
| Average Hourly Earnings | Reflects wage growth for workers, serving as a key indicator for observing inflationary pressures. |
These data points help gauge the health of the U.S. economy. Job creation and wage growth typically lead to higher consumption, reflecting economic vitality. Rising unemployment or stagnant wages may signal economic risks. Changes in the Non-Farm Payroll Report influence Fed policies and financial markets, providing critical insights for investment decisions.
Key Highlights
- The Non-Farm Payroll Report, released monthly, provides key data on U.S. job creation, unemployment rate, and average hourly earnings, helping to analyze the health of the economy.
- Changes in job creation directly impact economic growth and market sentiment; below-expectation job growth may indicate an economic slowdown.
- The unemployment rate is a critical indicator of labor market health; the current rate is below the historical average, but a decline in job creation could lead to a future increase in unemployment.
- Changes in average hourly earnings reflect workers’ income levels; when wage growth exceeds the rise in living costs, consumer spending power increases, supporting economic growth.
- Investors should monitor the release timing and data changes of the Non-Farm Payroll Report to adjust investment strategies promptly and optimize asset allocation.
Core Data of the Non-Farm Payroll Report

Image Source: pexels
Job Creation
Job creation is one of the most closely watched indicators in the Non-Farm Payroll Report. It reflects how many new jobs U.S. businesses, government, and institutions have created in a month. Changes in job creation directly impact economic growth and market sentiment.
The table below shows U.S. non-farm job creation over the past three months:
| Month | Non-Farm Job Creation |
|---|---|
| June | -13,000 |
| July | 79,000 |
| August | 22,000 |
August’s addition of 22,000 jobs fell far below market expectations, indicating that the labor market is struggling to rebound strongly in the short term. Last year, job creation was 911,000 lower than expected, making markets more cautious about the U.S. economic outlook.
A weak jobs report typically increases market expectations for Fed rate cuts, impacting investor confidence and market reactions.
- August’s job creation fell below expectations, reflecting a slowdown in hiring.
- Economic uncertainty, tariffs, and inflationary pressures may lead to a rise in unemployment.
- Economists believe weak employment data can affect consumer and business confidence.
Unemployment Rate
The unemployment rate is a key indicator of the health of the U.S. labor market. It shows the percentage of people actively seeking work but unable to find employment.
The table below compares the current unemployment rate with the historical average:
| Time | Unemployment Rate | Historical Average |
|---|---|---|
| Current (2025) | 4.30% | 5.67% |
| Last Month | 4.20% | N/A |
| Last Year | 4.20% | N/A |
- From 1948 to 2025, the U.S. unemployment rate averaged 5.67%.
- The unemployment rate peaked at 14.90% in April 2020.
- The lowest rate was 2.50% in May 1953.
The current unemployment rate is below the historical average, but a decline in job creation may signal a future rise in unemployment. Changes in the unemployment rate in the Non-Farm Payroll Report often become a focal point for markets and policymakers.
Average Hourly Earnings
Average hourly earnings reflect the income levels of U.S. workers and are a key indicator for observing inflationary pressures and consumer spending power.
The table below shows the latest average hourly earnings data:
| Time | Average Hourly Earnings | Monthly Change | Annual Change |
|---|---|---|---|
| August 2025 | $36.53 | +$0.10 | +3.7% |
| July 2025 | $36.43 | N/A | +3.9% |
- As of June, U.S. workers’ average hourly earnings grew by 3.7%, while the Consumer Price Index (CPI) rose by only 2.7% during the same period.
- Consumer income growth outpacing rising living costs leads to real wage increases, sustaining strong consumer spending.
- Real wage growth provides consumers with more disposable income, supporting economic growth.
Changes in average hourly earnings not only affect inflation expectations but also directly impact U.S. residents’ spending power. The wage data in the Non-Farm Payroll Report provides critical insights for market analysis.
Labor Force Participation Rate
The labor force participation rate measures the proportion of the population aged 16 and older participating in the labor market, including those employed and actively seeking work.
The table below shows the latest U.S. labor force participation rate data:
| Time | Labor Force Participation Rate |
|---|---|
| August 2025 | 62.30% |
| July 2025 | 62.20% |
| August 2024 | 62.70% |
| January 2000 | 67.30% |
| December 1954 | 58.10% |
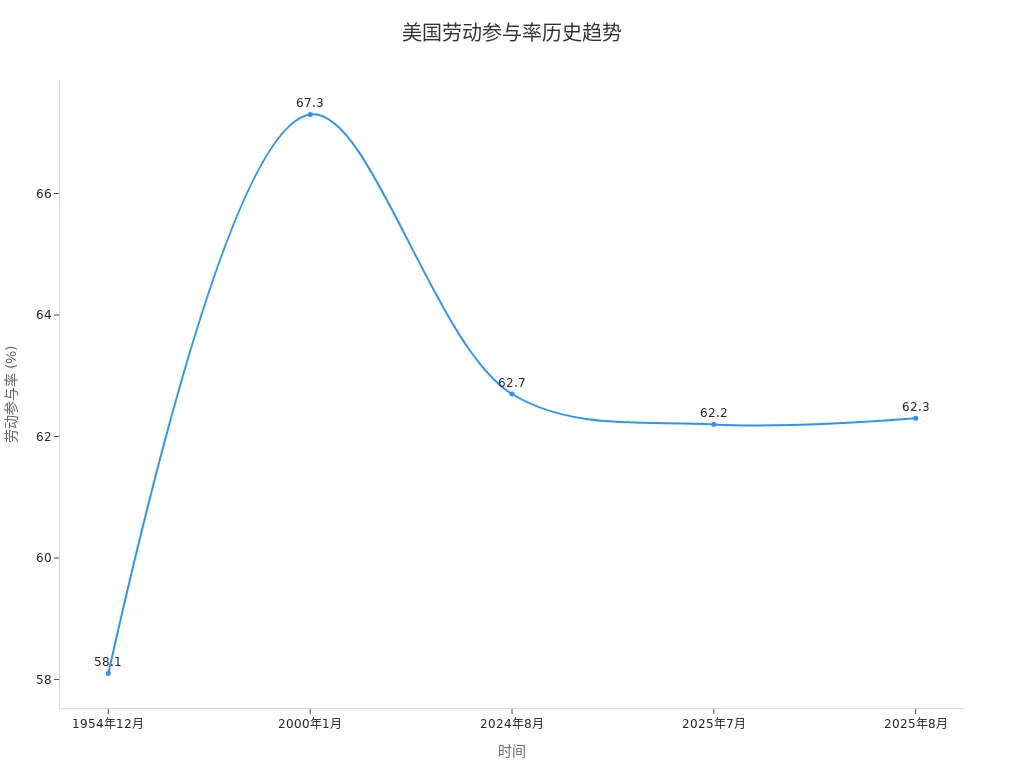
- The current U.S. labor force participation rate is 62.30%, slightly lower than in 2024.
- The labor force participation rate has been on a downward trend since 2000, primarily due to an aging population.
- Changes in the labor force participation rate can indicate trends in economic growth or recession.
The decline in the labor force participation rate is mainly due to an aging population and structural factors, significantly impacting the potential growth rate of the U.S. economy. Policymakers need to monitor this indicator to assess the true state of the job market.
Average Workweek
The average workweek reflects the number of hours U.S. employees work per week and is a key indicator of labor market activity and economic cycles.
The table below shows the latest average workweek data:
| Category | Average Workweek Hours |
|---|---|
| All Employees | 34.2 hours |
| Manufacturing | 40.0 hours |
| Production and Non-Supervisory Employees | 33.7 hours |
The table below shows changes in the U.S. average weekly work hours over the past two decades:
| Year | Average Weekly Work Hours |
|---|---|
| 2006 | 34.47 |
| 2009 | 33.9 |
| 2021 | 34.8 |
| 2025 | 34.2 |
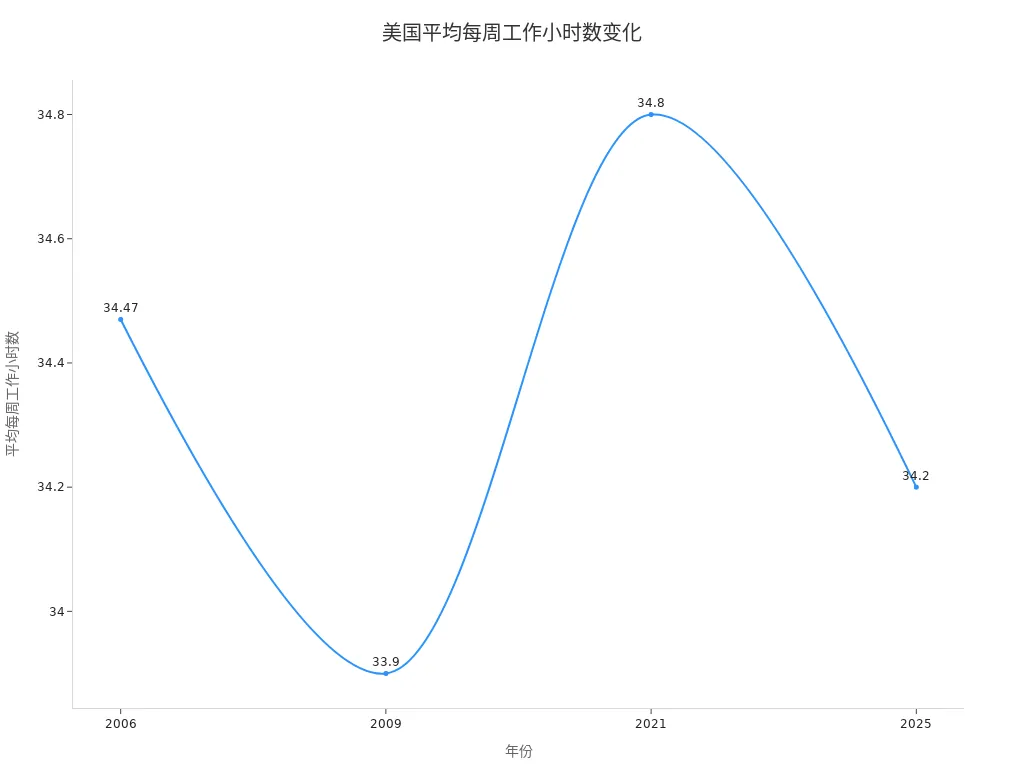
- Economic fluctuations affect working hours.
- Employment patterns changed during the pandemic.
- Workers’ preferences for work-life balance also impact the average workweek.
Changes in the average workweek reflect the flexibility of the U.S. labor market and the impact of economic cycles. The Non-Farm Payroll Report uses this data to help analyze labor market activity and business hiring needs.
Data Interpretation
Trend Analysis
Over the past year, the U.S. non-farm job market has maintained moderate growth. Data shows that in August 2025, non-farm employment reached 159.54 million, a 0.93% increase from the previous year. Monthly changes were small, with August showing a mere 0.01% month-on-month increase.
The table below shows changes in non-farm employment over the past year:
| Time | Non-Farm Employment (Million) | Monthly Change (%) | Annual Change (%) |
|---|---|---|---|
| August 2025 | 159.54 | 0.01 | 0.93 |
| July 2025 | 159.52 | - | - |
| August 2024 | 158.07 | - | - |
August’s job creation of only 22,000 was well below the previous figure and market expectations. The healthcare sector performed strongly, adding 31,000 jobs, while the social assistance sector saw 16,000 jobs added. Meanwhile, federal government and energy-related industries experienced job losses.
- Healthcare and social assistance continue to expand, reflecting an aging population and rising demand for social services.
- Federal government and mining industries saw declines in employment, indicating significant impacts from policy and market fluctuations.
The employment trends reflected in the Non-Farm Payroll Report are closely tied to U.S. economic performance. Job growth drives increases in disposable income, promoting consumption and investment. Sustained job expansion may also push up wage levels, increasing inflationary pressures.
| Evidence Point | Description |
|---|---|
| Correlation between Non-Farm Payroll Data and Economic Performance | Non-farm payroll data provides insights into labor market health, influencing consumer spending and business investment. |
| Job Growth and Consumer Spending | Job growth increases disposable income, promoting spending and economic growth. |
| Impact of Employment Data on Business Confidence | Strong employment data typically boosts business confidence, encouraging capital spending and expansion plans. |
| Sustained Job Growth and Inflation | Sustained job growth may tighten the labor market, increasing wages and inflationary pressures. |
Comparison with Expectations
The latest Non-Farm Payroll Report shows that actual job creation and unemployment rates fell short of market expectations.
The table below compares key indicators with market expectations:
| Indicator | Latest Data | Market Expectation | Change Status |
|---|---|---|---|
| Non-Farm Job Creation | 115,000 | 147,000 | Below last month and 12-month average |
| Unemployment Rate | 4.2% | 4.3% | Above last month and 12-month average |
Job creation fell below market expectations, indicating weaker hiring intentions among businesses. The unemployment rate was slightly higher than expected, reflecting increased pressure in parts of the labor market.
- When non-farm payroll data falls below expectations, financial markets typically experience significant reactions.
- Stock indices may rise by 0.5% to 1.5%, bond yields increase by 5 to 10 basis points, the dollar appreciates by 0.3% to 0.8%, and trading volumes surge to 3 to 5 times normal levels.
| Market Type | Reaction | Change Magnitude |
|---|---|---|
| Stock Indices | Rise | 0.5% to 1.5% |
| Bond Yields | Increase | 5 to 10 basis points |
| Dollar | Appreciate | 0.3% to 0.8% |
| Trading Volume | Surge | 3 to 5 times normal levels |
The market is highly sensitive to the Non-Farm Payroll Report. When data deviates from expectations, investors quickly adjust asset allocations, impacting short-term trends in U.S. stocks, the dollar, and bond markets.
Industry Divergence
Employment changes across industries show significant divergence. Some service and healthcare sectors continue to expand, while manufacturing, trade, and leisure and hospitality industries experience job losses.
The table below summarizes employment changes in major industries:
| Industry | Employment Change |
|---|---|
| Trade, Transportation, and Utilities | -226,000 jobs |
| Leisure and Hospitality | -176,000 jobs |
| Professional and Business Services | -158,000 jobs |
| Manufacturing | -95,000 jobs |
| Construction | -29,000 jobs |
| Mining and Logging | -4,000 jobs |
| Private Education and Health Services | -35,000 jobs |
| Other Services | -51,000 jobs |
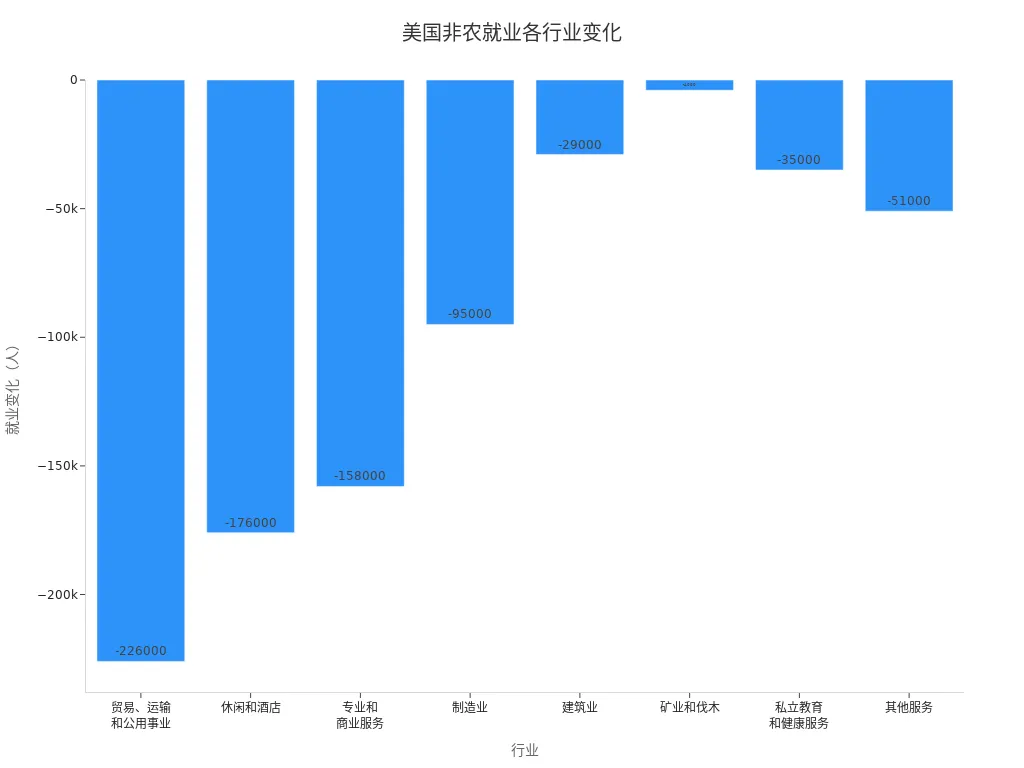
The reasons for industry divergence are complex and include the following aspects:
- More people are choosing self-employment, leading to some employment data not being fully reflected in payroll statistics.
- The rise in marginal and multiple job holdings results in duplicated or underestimated job counts.
- Economic cycle changes affect the pace of job creation and loss, with faster growth during expansions and more significant declines during recessions.
Industry restructuring and changes in employment patterns make the industry divergence trends in the Non-Farm Payroll Report more pronounced. Policymakers and market analysts need to monitor these changes to assess economic transformation and future job market trends.
Market Impact

Image Source: pexels
Federal Reserve Policy
The U.S. Federal Reserve places significant emphasis on the data from the Non-Farm Payroll Report. Monthly data on job creation, unemployment rates, and wage levels provide direct signals about economic performance.
- Non-farm payroll data reveals employment trends, helping the Fed determine whether the economy is in an expansion or contraction phase.
- When employment data is strong, the Fed may raise interest rates to control inflation. When employment data is weak, the Fed may lower rates to stimulate economic activity.
- Changes in the jobs report directly influence monetary policy decisions, serving as a critical basis for interest rate adjustments.
| Impact Factor | Description |
|---|---|
| Labor Market Conditions | When labor market tightness eases, the FOMC uses non-farm payroll data to assess risks to employment and inflation goals. |
| Inflation Target | The FOMC aims to restore inflation to 2%, carefully evaluating upcoming employment data when adjusting rates. |
| Risk Assessment | The committee closely monitors inflation risks, recognizing the significant challenges high inflation poses to low-income groups. |
The Fed analyzes the jobs report to adjust policy tools promptly, ensuring economic stability.
Financial Market Performance
The release of the Non-Farm Payroll Report triggers significant volatility in U.S. financial markets.
- Forex Market: When employment data exceeds expectations, the dollar typically rises; when it falls below expectations, the dollar weakens.
- Gold Market: Strong job growth depresses gold prices, while weak data pushes gold prices higher.
- Stock Market: When job creation falls below expectations, investors anticipate potential Fed rate cuts, leading to stock price increases. Rising unemployment signals economic slowdown, impacting market confidence.
- Bond Market: Strong employment data leads investors to expect rate hikes, increasing bond yields; weak data leads to declining yields.
| Event | Data | Market Reaction |
|---|---|---|
| U.S. Non-Farm Payroll Release | 22K vs 75K expected | Dollar falls, stocks rise |
| Unemployment Rate Rises to 4.3% | Signals U.S. economic slowdown | |
| Revisions to July and June Data | 79K (vs 74K) and -12K (vs 14K) | Indicates market expectations for monetary policy adjustments |
The Non-Farm Payroll Report is one of the most closely watched economic indicators for forex traders and investment institutions, directly impacting the dollar and gold trends.
Investor Focus
Institutional investors closely monitor multiple key data points in the Non-Farm Payroll Report.
- Total non-farm employment reflects the overall health of the job market.
- The unemployment rate indicates labor market tightness.
- The labor force participation rate reveals the activity level of the working population.
- Average hourly earnings reflect wage levels and their impact on the economy.
- Industry-specific data helps investors assess growth or contraction in various sectors.
- Revisions to previous reports influence market expectations for economic growth.
| Key Component | Description |
|---|---|
| Total Non-Farm Employment | Provides an overview of the job market’s health. |
| Unemployment Rate | Reflects the tightness of the labor market. |
| Labor Force Participation Rate | Shows how many people are active in the labor market. |
| Average Hourly Earnings | Reflects overall wage levels and their potential economic impact. |
Investors adjust asset allocations based on these data points, optimizing investment strategies to respond promptly to market changes.
Investment Insights
Data Release Timing
The release timing of the U.S. Non-Farm Payroll Report is highly significant for market participants. The report is typically released on the first Friday of each month. Investors and analysts closely monitor market dynamics before the release.
- The U.S. Non-Farm Payroll Report is typically released on the first Friday of each month.
- The release timing significantly impacts market volatility, with investors adjusting expectations for monetary policy based on the report’s data.
On the day of the release, the dollar, gold, and U.S. stock markets often experience sharp fluctuations. Many traders position themselves in advance, quickly adjusting strategies after the data is released. The high volatility in U.S. markets presents both opportunities and risks for investors.
Investors should pay attention to the report’s release timing and plan trading strategies accordingly to avoid unnecessary losses due to sharp market fluctuations.
Forward-Looking Indicators
When analyzing the Non-Farm Payroll Report, investors often combine it with other forward-looking economic indicators to more comprehensively predict U.S. economic trends. The table below lists several key indicators and their roles:
| Economic Indicator | Description |
|---|---|
| Unemployment Rate | Estimates the percentage of unemployed Americans through monthly surveys, reflecting labor market health. |
| Inflation Reports | Includes CPI and PPI, used to measure price changes and inflation. |
| Consumer Confidence | Published by the Conference Board, reflects consumer confidence in the economy and future spending expectations. |
| Retail Sales | Released monthly, measures consumer spending, typically correlated with economic growth. |
| Durable Goods Orders | Measures industrial activity, reflecting manufacturing health, often linked to economic growth and stock market performance. |
In addition to the above indicators, the JOLTS report provides investors with in-depth insights into the labor market. Although the JOLTS report is released with a one-month lag, its industry and regional data are highly detailed. The ADP National Employment Report has a relatively weak correlation (0.61) with the Non-Farm Payroll Report, limiting its predictive power. Post-pandemic, U.S. job openings and quit rates have significantly increased, indicating labor market tightness and economic optimism.
Investors should combine multiple forward-looking indicators to comprehensively assess the direction of the U.S. economy and job market, thereby optimizing asset allocation and risk management strategies.
The Non-Farm Payroll Report helps analysts and investors understand the true state of the U.S. economy and labor market.
- The report is released monthly, serving as a critical signal for market volatility.
- Data includes job creation, unemployment rates, and wage levels, influencing Fed policies and financial market performance.
- By interpreting the report, investors can optimize asset allocation and enhance market judgment capabilities.
Continuously monitoring the Non-Farm Payroll Report helps grasp economic trends and develop more informed investment strategies.
FAQ
When is the Non-Farm Payroll Report released each month?
The U.S. Department of Labor typically releases the Non-Farm Payroll Report on the first Friday of each month. Investors and analysts closely monitor this timing.
How does the Non-Farm Payroll Report impact Fed policy?
The Fed adjusts interest rate policies based on the report’s employment and wage data. Strong employment may lead to rate hikes, while weak employment may prompt rate cuts.
What does the average hourly earnings data in the report indicate?
Average hourly earnings reflect changes in U.S. workers’ income. When wage growth outpaces price increases, consumer spending power strengthens, making the economy more vibrant.
How do licensed banks in Hong Kong utilize the Non-Farm Payroll Report?
Licensed banks in Hong Kong analyze the report’s data to adjust strategies for dollar-related products and services, helping clients capitalize on U.S. market changes.
How does the Non-Farm Payroll Report differ from other economic indicators?
The Non-Farm Payroll Report primarily focuses on employment and wages. Other indicators like CPI and retail sales reflect prices and consumption. Combining multiple data points provides a more comprehensive analysis.
Delving into the nonfarm payrolls report reveals how subtle shifts in U.S. job data can ripple into major headaches for international investors: the frenzy of market volatility right after release, exorbitant remittance fees for cross-border flows, and the uncertainty of exchange rates when sourcing real-time economic insights. These hurdles not only chip away at returns but can also cause missed opportunities amid Fed policy pivots, particularly when soft job figures signal impending rate cuts. Envision a unified platform that secures your funds with live rates, caps remittance costs at just 0.5%, and waives fees on limit order contracts—transforming reactive trading into proactive mastery?
BiyaPay is engineered for time-sensitive global traders, facilitating instant swaps between fiat and digital currencies to keep your capital agile post-report. Leverage the real-time exchange rate query for on-the-spot USD tracking, dodging unseen currency drags. Spanning most countries, it guarantees same-day transfers for immediate market plays. Standout: no offshore account required to trade U.S. and Hong Kong stocks in one seamless space, hedging nonfarm-induced swings effortlessly.
Be it refining bond portfolios via unemployment trends or positioning in consumer equities on wage surges, BiyaPay delivers steadfast tools. Sign up now and head to stocks to probe payroll-fueled U.S. trends— in moments, turn insights into execution. Elevate with top-tier investors in a streamlined, compliant global finance arena!
*This article is provided for general information purposes and does not constitute legal, tax or other professional advice from BiyaPay or its subsidiaries and its affiliates, and it is not intended as a substitute for obtaining advice from a financial advisor or any other professional.
We make no representations, warranties or warranties, express or implied, as to the accuracy, completeness or timeliness of the contents of this publication.


Contact Us
Company and Team
BiyaPay Products
Customer Services


is a broker-dealer registered with the U.S. Securities and Exchange Commission (SEC) (No.: 802-127417), member of the Financial Industry Regulatory Authority (FINRA) (CRD: 325027), member of the Securities Investor Protection Corporation (SIPC), and regulated by FINRA and SEC.
registered with the US Financial Crimes Enforcement Network (FinCEN), as a Money Services Business (MSB), registration number: 31000218637349, and regulated by FinCEN.
registered as Financial Service Provider (FSP number: FSP1007221) in New Zealand, and is a member of the Financial Dispute Resolution Scheme, a New Zealand independent dispute resolution service provider.