- EasyCard
- Trade
- Help
- Announcement
- Academy
- SWIFT Code
- Iban Number
- Referral
- Customer Service
- Blog
- Creator
Understand Trading Jargon in One Article: A Classified Analysis of Core Terms


Image Source: unsplash
When you engage in investing, you often encounter many specialized terms, and different markets and asset classes have different expressions. You can quickly understand and look up these terms by categorizing them. The table below shows common trading jargon used in global financial markets and their main categories:
| Category | Term | Definition |
|---|---|---|
| Animal-Related | Bull Market | Refers to a market with an upward trend, usually indicating optimistic speculators. |
| Animal-Related | Bear Market | Refers to a market with a downward trend, usually indicating pessimistic investors. |
| Animal-Related | Wolf of Wall Street | Refers to a trader who achieves success unethically on Wall Street. |
| Animal-Related | Black Swan | Refers to an unpredictable market event with significant impact. |
| Animal-Related | Dead Cat Bounce | A brief recovery during a market downturn followed by further decline. |
| Market Movement | Short Squeeze | A sharp price increase forcing short-sellers to cover their positions. |
| Market Movement | Long Squeeze | A sharp price drop forcing long position holders to close their positions. |
| Market Movement | To the Moon | A rapid and significant price surge of an asset. |
| Market Movement | Tank | A rapid and significant price drop of an asset. |
| Trading Techniques | Pump and Dump | Manipulating the market using false information. |
| Trading Techniques | Contrarian | A trading strategy that goes against prevailing market trends. |
| Trading Techniques | Curve | An informal term for technical indicators. |
| Market/Asset Nicknames | Aussie | Nickname for the Australian Dollar. |
| Market/Asset Nicknames | Kiwi | Nickname for the New Zealand Dollar. |
| Market/Asset Nicknames | DAX | Common name for the German stock index. |
| Market/Asset Nicknames | Cable | Nickname for GBP/USD. |
| Market/Asset Nicknames | Loonie | Nickname for CAD/USD. |
| Market/Asset Nicknames | Mate | Nickname for AUD/USD. |
| Market/Asset Nicknames | Ninja | Nickname for USD/JPY. |
| Market/Asset Nicknames | Swissy | Nickname for USD/CHF. |
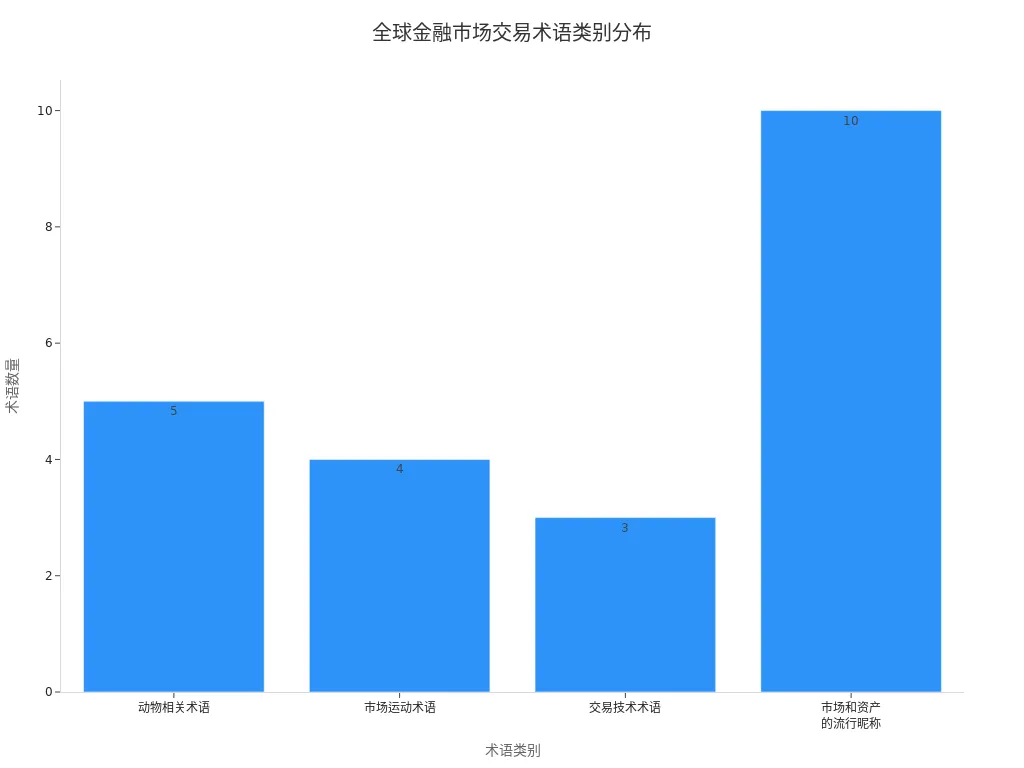
By mastering categorized terms, you can improve your understanding and decision-making efficiency. Data shows that investors are more likely to choose industries and terms they are familiar with, and categorized learning can reduce systematic errors:
| Statistic | Description |
|---|---|
| Investor Stock Purchase Tendency | More likely to buy stocks in industries with past positive returns. |
| Impact of Experience | Recent experience has a stronger impact on new stock purchases, with significant reduction after one year. |
| Portfolio Performance | Actual portfolio performance is often lower than ideal portfolios due to systematic errors. |
Key Highlights
- Understanding the classification of trading jargon helps you quickly master market terms and improve investment decision-making efficiency.
- Familiarity with order terms can help you flexibly manage buy and sell instructions, reducing operational errors.
- Mastering risk management terms can effectively control investment risks and protect capital safety.
- Understanding market trend terms can help you analyze market movements and make more informed judgments.
- Learning strategy terms allows you to choose trading methods that suit you, improving investment efficiency.
Trading Jargon Categories
When learning trading jargon, you first need to understand the main categories of these terms. Different categories of terms help you quickly locate information in markets like U.S. stocks, Hong Kong stocks, and others, improving decision-making efficiency. Below, I will outline six core categories, each playing a significant role in actual investing.
Market Terms
Market terms describe the overall market environment and participant behavior. These terms help you judge market trends and sentiment. For example, “bull” indicates an optimistic market, and “bear” represents a pessimistic market. You will also encounter terms like “market maker,” “liquidity,” “spread,” and “volume.” These terms are very common in U.S. stocks, Hong Kong stocks, forex, and other markets. Mastering these terms allows you to better understand market dynamics and seize investment opportunities in a timely manner.
Order Terms
Order terms mainly involve the types and execution methods of trading instructions. When placing orders, you will use terms like “market order,” “limit order,” “stop-loss order,” and “take-profit order.” For instance, a “market order” allows you to trade at the current market price, while a “limit order” requires trading at a specified price. You will also use operations like “cancel order” and “pending order.” Familiarity with these terms helps you flexibly manage buy and sell instructions, reducing operational errors.
Risk Management Terms
Risk management terms help you control investment risks and protect capital safety. Common terms include “position,” “leverage,” “margin,” “forced liquidation,” and “risk control.” For example, “position” indicates the proportion of assets you hold, and “leverage” allows you to use less capital to control larger trades. You will also use “stop-loss orders” to limit losses and set a reasonable “risk-reward ratio” to optimize returns. Mastering these terms enables you to manage risks more scientifically and avoid significant losses.
Market Trend Terms
Market trend terms are used to describe price movements and market performance. You will frequently see terms like “K-line,” “moving average,” “support,” “resistance,” “trade price,” and “amplitude.” For example, a “K-line” chart helps you analyze price changes, and a “moving average” reflects price trends. “Support” and “resistance” are used to judge potential price reversal points. These terms are crucial in technical analysis, helping you make more informed judgments.
Strategy Terms
Strategy terms cover various trading methods and investment approaches. You will encounter terms like “trend trading,” “arbitrage,” “grid trading,” “high-frequency trading,” and “algorithmic trading.” For instance, “trend trading” involves trading in the direction of market trends, and “arbitrage” exploits price differences for profit. “High-frequency trading” relies on speed and technology, while “algorithmic trading” uses algorithms to execute strategies automatically. Understanding these terms allows you to choose trading methods that suit you, improving investment efficiency.
Other Terms
In addition to the five main categories, you will encounter some special or popular trading jargon. For example, “cut loss” refers to selling at a loss to stop further damage, and “dead cat bounce” describes a brief recovery during a downtrend. Although these terms do not belong to mainstream categories, they are frequently used in actual discussions. Mastering these terms helps you communicate better with other investors and understand market hot topics.
In markets like U.S. stocks, Hong Kong stocks, futures, and forex, you will encounter these categories of trading jargon. Categorized learning not only helps you quickly find and understand terms but also reduces operational errors and improves the scientific nature of investment decisions.
- Common trading jargon categories include:
- Basic terms: such as pip, lot, spread
- Execution terms: such as market order, limit order
- Trading strategies: such as trend trading, day trading
- Risk management concepts: such as stop-loss order, risk-reward ratio
By systematically mastering these categories, you can flexibly apply them in different market environments, enhancing your professional competence and practical ability.
Market Terms Breakdown

Image Source: pexels
Bull
You often hear the term “bull” in the market. Bull refers to your optimism about an asset’s future performance, prompting you to buy and hold, expecting the price to rise for profit. In the U.S. stock market, investors typically adopt a bull strategy during a bull market. Bull is one of the most fundamental expressions in trading jargon.
Bear
Bear is the opposite of bull. If you believe a stock will decline in the future, you can borrow the stock, sell it, and buy it back at a lower price to return it, profiting from the difference. This operation is common in the U.S. market, especially during market downturns.
Market Maker
Market makers play a significant role in financial markets. You will find that they provide continuous buy and sell quotes, helping maintain market liquidity.
- Market makers ensure you can buy or sell assets at any time.
- They maintain trading order during market volatility.
- In events like initial public offerings (IPOs), market makers ensure more orderly trading.
Liquidity
Liquidity describes how quickly you can convert an asset into cash. In a highly liquid market, buying and selling are easy to complete. The U.S. stock market typically has high liquidity, allowing you to execute trades quickly.
Spread
The spread is the difference between the bid price and the ask price. A smaller spread means lower trading costs for you. Market makers adjust spreads to manage risk and profit.
Volume
Volume indicates the total number of transactions within a specific period. You can use volume to gauge market activity.
- The calculation method for volume involves multiplying the price and quantity of each trade.
- Higher volume indicates greater market risk and capital flow.
Cut Loss
Cut loss refers to selling an asset at a loss to prevent further losses. This term is commonly used in trading jargon to describe the无奈 choice investors make to acknowledge losses.
You can learn more market terms by consulting investment terminology glossaries or investment glossary: 100+ terms and definitions.
| Term | Definition |
|---|---|
| Investment | Allocating funds to an asset expecting returns. |
| Stock | A portion of company ownership. |
| Market | The venue for buying and selling assets, typically referring to the stock market. |
Order Terms Breakdown
In trading platforms, you will frequently encounter various order terms. Mastering these trading jargon terms helps you place orders and manage risks more efficiently. Below, I will break down six common order types for you.
Market Order
Market order is when you buy or sell an asset immediately at the current best market price. When you choose a market order, the system automatically executes the trade at the best available price in the market at that time. Market orders ensure execution but may have price fluctuations.
When you place orders in the U.S. market, market orders are suitable for scenarios requiring quick execution.
| Order Type | Definition | Execution Guarantee |
|---|---|---|
| Market Order | Buy or sell stocks at the best available market price, ensuring execution but not a specific price. | Ensures execution |
Limit Order
A limit order allows you to set your ideal buy or sell price. The order will only execute when the market price reaches your specified limit price. Limit orders help you control the buy or sell price but cannot guarantee execution.
| Order Type | Definition | Execution Guarantee |
|---|---|---|
| Limit Order | Buy at a specified maximum price (buy limit) or sell at a specified minimum price (sell limit). | Cannot guarantee execution |
Stop-Loss Order
A stop-loss order is an automatic sell or buy order you set to prevent excessive losses. When the price reaches your set stop-loss point, the system automatically executes the order. Stop-loss orders help you limit losses during market volatility, reducing emotional decisions.
- Stop-loss orders execute automatically when the price reaches a predetermined level, protecting you from excessive losses.
- Many traders rely on stop-loss orders to avoid trading under pressure or fear.
Take-Profit Order
A take-profit order is an automatic sell or buy order you set to lock in profits. When the price reaches your target price, the system automatically executes the trade. Take-profit orders help you secure profits in time, avoiding missed opportunities due to greed.
- Take-profit orders execute automatically when the price reaches a predetermined level, helping you lock in profits.
- Using take-profit and stop-loss orders together can help you maintain trading discipline.
Cancel Order
Cancel order is when you cancel an unexecuted order. If you find that market conditions have changed and the original order is no longer suitable, you can cancel the pending order at any time. The cancel order function allows you to flexibly adjust your trading strategy.
Pending Order
A pending order is when you preset buy or sell conditions, and the order automatically executes when the market price reaches the target. Pending orders include limit orders, stop-loss orders, and take-profit orders. You can flexibly set pending orders based on your strategy to improve trading efficiency.
Common order-related terms also include:
- Buy
- Sell
- Bid
- Ask
- Spread
- Volume
- Liquidity
These terms are very common in the U.S. market and major global trading platforms. By mastering these trading jargon terms, you can better seize market opportunities.
Risk Management Terms Breakdown
Image Source: unsplash
Position
When trading, you need to pay attention to your position. Position refers to the proportion of funds you hold in a particular asset. Properly allocating positions can help you diversify risk, avoiding significant losses due to fluctuations in a single asset. Many investors in the U.S. market adjust position sizes based on their risk tolerance. Through position management, you can flexibly respond to market changes.
Leverage
Leverage allows you to control a larger trading size with less capital. In the U.S. market, when you engage in margin trading, you often encounter leverage. For example, with USD 10,000 in capital and a 5:1 leverage, you can manage a USD 50,000 position. Leverage can amplify profits but also magnifies losses. The table below shows a comparison of losses and remaining equity for two traders using different leverage levels:
| Trader | Trader X | Trader Y |
|---|---|---|
| Trading Capital (Equity) | $10,000 | $10,000 |
| Leverage Applied | 5:1 | 50:1 |
| Position Size | 0.5 lot | 5 lots |
| Result (100-point loss in USD) | -$500 | -$5,000 |
| Loss as Percentage of Total Equity | 5% | 50% |
| Remaining Equity Percentage | 95% | 50% |
You can see that the higher the leverage, the greater the risk. You need to be extra cautious when using leverage.
Margin
Margin is the capital you need to deposit in advance when using leverage trading. In the U.S. market, brokers require a certain percentage of margin based on your trading size. The margin system helps you control risk, preventing excessive losses in your account due to market fluctuations.
Forced Liquidation
Forced liquidation occurs when your account equity falls below the minimum margin requirement, and the system automatically closes some or all of your positions. When trading with high leverage, the risk of forced liquidation is higher. You need to constantly monitor your account balance to avoid losses from forced liquidation.
Risk Control
Risk control is a critical aspect of trading that you must prioritize. Good risk control can protect your capital and increase the probability of long-term profitability. You can employ various risk control measures, including:
- Position management
- Setting stop-loss orders
- Setting take-profit orders
- Leverage management
- Portfolio allocation
- Quick stop-loss
- Letting winners run
By mastering these risk management trading jargon terms, you can make more prudent investment decisions in the U.S. market.
Market Trend Terms Breakdown
K-Line
When analyzing the U.S. market, you will often see K-line charts. K-line charts, also called candlestick charts, display the opening price, highest price, lowest price, and closing price for each trading period. Each K-line resembles a candle, with red indicating a price increase and green indicating a price decrease. K-line charts help you quickly judge market trends.
K-line charts are one of the most commonly used chart types in technical analysis, allowing you to intuitively understand price fluctuations.
Moving Average
A moving average refers to the average price over a specific period. You commonly use 5-day, 10-day, or 20-day moving averages. Moving averages smooth out price trends, helping you identify the direction of the trend. For example, if the price is above the moving average, it indicates a strong market; if below, it indicates a weak market.
The simple moving average is the most common type of moving average.
Support
Support refers to a price level where buying interest tends to halt further declines, making it difficult for the price to fall further. You can identify support levels by observing historical price lows, analyzing fluctuation points, or using technical indicators.
- Observe price behavior and historical price points
- Analyze fluctuation points
- Use indicators
- Monitor market performance near key levels
When the price approaches a support level, it often presents a rebound opportunity.
Resistance
Resistance refers to a price level where selling pressure tends to cap further rises, making it difficult for the price to continue rising. You can draw resistance lines by connecting multiple high points. Resistance levels often become starting points for price pullbacks.
Key support and resistance levels provide a reference for setting stop-loss and take-profit points, helping optimize the risk-reward ratio.
Trade Price
Trade price refers to the actual price at which a buy and sell transaction is completed. When you place an order in the U.S. market, the system executes the trade at the best available price. The trade price reflects the immediate supply and demand relationship in the market.
Together with volume, trade price helps you gauge market activity.
Amplitude
Amplitude indicates the price fluctuation range within a specific period. You can calculate amplitude by subtracting the lowest price from the highest price. A larger amplitude indicates more volatile market fluctuations.
By analyzing amplitude, you can assess the market’s activity level and risk level.
| Term | Definition |
|---|---|
| K-Line | A chart displaying opening, highest, lowest, and closing prices in a candle-like format. |
| Moving Average | The average price over a specified period. |
| Support | A line connecting multiple low points, typically indicating buying support during price declines. |
| Resistance | A line connecting multiple high points, typically indicating selling pressure during price rises. |
| Trade Price | The actual price at which a buy and sell transaction is completed. |
| Amplitude | The price fluctuation range within a certain period. |
After mastering these market trend terms, you can efficiently communicate with other traders using a common language, improving your analysis and decision-making abilities.
Strategy Terms Breakdown
Trend Trading
In the U.S. market, you will often encounter trend trading. Trend trading is a strategy that involves buying and selling in the direction of the market trend. By analyzing price movements, you determine whether the market is in an uptrend or downtrend and then choose to buy or sell. Trend-following strategies help you capitalize on major market movements, reducing risks from trading against the trend. Many algorithmic trading systems also use trend indicators to automatically identify buy and sell opportunities.
Trend-following is one of the most common strategies in both algorithmic and manual trading, suitable for mid-term holdings, typically lasting days or weeks.
Arbitrage
Arbitrage strategies exploit price differences across markets for profit. You can seek price inconsistencies between different markets or products. For example, statistical arbitrage uses complex models to identify short-term inefficiencies, quickly buying undervalued assets and selling overvalued ones. In high-frequency trading, latency arbitrage requires advanced technology and is suitable for traders with fast execution capabilities.
| Strategy Type | Description | Example Strategies |
|---|---|---|
| Statistical Arbitrage | A complex statistical model strategy exploiting short-term market inefficiencies. | Pair trading, mean reversion |
| Latency Arbitrage | Relies on technological advantages, suitable for high-frequency trading. | Latency arbitrage |
Grid Trading
Grid trading is an automated order placement method. You set buy and sell orders at different price levels within a specified range, without needing to predict market direction. As prices fluctuate, the system continuously buys low and sells high, accumulating small profits. Grid trading is suitable for range-bound markets, helping you diversify risk and smooth returns.
High-Frequency Trading
High-frequency trading relies on advanced technology and high speed. In the U.S. market, high-frequency traders you observe typically trade frequently to exploit small price movements. High-frequency strategies include latency arbitrage, market-making, and others, requiring powerful computational capabilities and low-latency networks. Through high-frequency trading, you can capture fleeting market opportunities but face higher technical barriers.
- Common high-frequency trading strategies include:
- Latency arbitrage
- Market-making
- Iceberg orders
Algorithmic Trading
Algorithmic trading refers to using computer programs to automatically execute buy and sell orders. You can set rules for batch order placement, stop-loss, and take-profit. Algorithmic trading eliminates emotional interference and improves execution efficiency. In the U.S. market, many large institutions and individual investors use algorithmic systems, covering mid-term, short-term, and even high-frequency strategies.
After mastering these strategy terms, you can choose trading methods that suit your needs, improving investment efficiency and risk control.
Memorizing and Applying Trading Jargon
Categorized Memorization
You can efficiently master trading jargon by using categorized memorization. Dividing terms into market, order, risk management, market trend, and strategy categories helps you build a clear knowledge structure.
- Understanding basic relationships, such as the relationship between bond prices and interest rates, helps you grasp related terms.
- Designing mnemonics, such as “long = collect, short = pay,” helps you quickly memorize key concepts.
- Remembering market terms like “rise” and “fall” is useful, as these terms have similar meanings across different markets, facilitating application.
Contextual Association
In actual operations, you can reinforce term memorization through contextual association. Imagine yourself placing orders, setting stop-losses, or analyzing K-line charts in the U.S. market, linking abstract terms to specific actions. You can also review successful or failed trading cases to understand the importance of market opportunities, risk management, and emotional control. This helps you better understand each term’s role in real trading.
Practical Tips
To become a self-sufficient trader, you should first familiarize yourself with common trading jargon. When reading market analysis or volume data, you no longer need to frequently consult a dictionary. You can regularly practice on a demo platform, focusing on one strategy to gradually build confidence. Analyzing your trading process and learning from successes and failures can help you avoid common mistakes and improve psychological discipline.
Quick Reference Table
A quick reference table can help you quickly review and look up trading terms. You can compile commonly used terms and their definitions into a table for easy reference.
A quick reference table not only improves learning efficiency but also helps you integrate terms when formulating trading plans, enhancing analysis and decision-making abilities.
| Term | Definition |
|---|---|
| Bull | Optimistic and buying assets. |
| Bear | Pessimistic and selling assets. |
| Stop-Loss Order | An automatic sell order to limit losses. |
| K-Line | A chart displaying price fluctuations. |
By mastering the core categories of trading jargon, you can quickly understand market information and improve trading efficiency. In actual operations, flexibly applying these terms helps you better manage risks. Continuous learning is also crucial:
- Continuous learning can enhance your skills and keep you updated with market changes.
- Technical analysis knowledge allows you to read charts and make informed decisions.
- Proactive learning generates new ideas and helps you adapt to market fluctuations.
By applying these terms to daily trading, you can gradually build your own knowledge system.
FAQ
What is the difference between trading jargon and general financial terms?
You will find that trading jargon is more colloquial, commonly used in actual operations and communication. General financial terms are more formal, often found in textbooks and official documents. When trading, mastering jargon allows you to quickly understand market dynamics.
Why should I learn order terms?
After learning order terms, you can place orders accurately, reducing operational errors. You can choose the appropriate order type based on different market conditions, improving trading efficiency and protecting capital safety.
What are the risks of leveraged trading?
When you use leverage, both profits and losses are amplified. During market fluctuations, you may face the risk of forced liquidation. You need to manage positions reasonably to avoid significant losses due to excessive leverage.
How do I read a K-line chart?
Through a K-line chart, you can intuitively understand the opening, closing, highest, and lowest prices. By analyzing K-line patterns, you can judge market trends and assist in making buy and sell decisions.
Is algorithmic trading suitable for beginners?
When you start trading, it’s advisable to learn basic knowledge first. Algorithmic trading requires some technical and strategic understanding. You can practice with a demo account to gradually build experience.
Having decoded trading jargon like bulls, bears, and candlesticks, you’re ready to navigate market signals with precision, yet high commissions, cross-border transfer complexities, and currency volatility can hinder executing trend-following or arbitrage strategies, especially in fast-paced U.S. markets. Picture a platform with 0.5% remittance fees, same-day global transfers, and instant fiat swaps, enabling seamless trading without offshore accounts?
BiyaPay is crafted for traders, offering swift fiat-to-digital conversions to capitalize on market shifts. With real-time exchange rate query, monitor USD movements and transfer at optimal moments to cut costs. Covering most regions with instant arrivals, it powers rapid deployment for high-frequency or grid strategies. Crucially, trade U.S. and Hong Kong stocks via a single account, aligning your jargon-driven analysis with action.
Whether you’re a novice mastering order types or a seasoned trader refining risk controls, BiyaPay fuels your edge. Sign up now, visit stocks for U.S. opportunities—quick setup launches data-driven trading. Join a global trading community and turn terminology into tangible profits!
*This article is provided for general information purposes and does not constitute legal, tax or other professional advice from BiyaPay or its subsidiaries and its affiliates, and it is not intended as a substitute for obtaining advice from a financial advisor or any other professional.
We make no representations, warranties or warranties, express or implied, as to the accuracy, completeness or timeliness of the contents of this publication.


Contact Us
Company and Team
BiyaPay Products
Customer Services


is a broker-dealer registered with the U.S. Securities and Exchange Commission (SEC) (No.: 802-127417), member of the Financial Industry Regulatory Authority (FINRA) (CRD: 325027), member of the Securities Investor Protection Corporation (SIPC), and regulated by FINRA and SEC.
registered with the US Financial Crimes Enforcement Network (FinCEN), as a Money Services Business (MSB), registration number: 31000218637349, and regulated by FinCEN.
registered as Financial Service Provider (FSP number: FSP1007221) in New Zealand, and is a member of the Financial Dispute Resolution Scheme, a New Zealand independent dispute resolution service provider.