- EasyCard
- Trade
- Help
- Announcement
- Academy
- SWIFT Code
- Iban Number
- Referral
- Customer Service
- Blog
- Creator
Is a High Price-to-Earnings Ratio a Trap? Is a Low One a Treasure? Understand These Three Types of PEs to Avoid Investment Minefields!


Image Source: pexels
You may have heard that a high P/E ratio is a trap, but the reality is far more nuanced. Many investors focus solely on whether a P/E ratio is high or low, overlooking factors like industry differences, company growth stages, and financial structures. For instance, tech companies and consumer goods firms have vastly different P/E ratios due to varying market conditions and growth prospects (SmartAsset). Fast-growing companies often have high P/E ratios or even no P/E if they’re not yet profitable. P/E ratios don’t reflect future growth potential and can be influenced by earnings reporting methods. To make informed investment decisions, you need to understand the logic behind P/E ratios.
Key Highlights
- The Price-to-Earnings (P/E) ratio is a key metric for assessing company value, showing how much investors are willing to pay per dollar of earnings.
- Trailing P/E is ideal for stable-profit companies, rolling P/E suits firms with fluctuating earnings, and forward P/E is used for growth-oriented companies.
- A high P/E may reflect optimism about future growth but can also signal overvaluation risks, requiring careful analysis.
- A low P/E doesn’t always mean a bargain; it may indicate industry decline or poor earnings quality, necessitating thorough evaluation.
- Combining industry context, earnings quality, and multi-dimensional analysis helps you accurately assess P/E ratios and avoid investment pitfalls.
P/E Ratio Basics

Image Source: pexels
Definition
When analyzing stocks, you’ll frequently encounter the Price-to-Earnings (P/E) ratio. The P/E ratio measures a company’s current stock price relative to its earnings per share (EPS).
- It shows how much investors are willing to pay for each dollar of a company’s earnings.
- The P/E ratio is a critical tool for investors to gauge a company’s market value.
The P/E ratio not only reflects a company’s current profitability but also reveals market expectations and sentiment about its future.
Calculation Method
Calculating the P/E ratio is straightforward.
- Divide the current stock price by the earnings per share (EPS) to get the P/E ratio.
- EPS is typically the company’s net income over the past 12 months divided by the number of outstanding shares.
- Changes in accounting standards can affect financial reporting, impacting P/E calculations and interpretation.
When comparing P/E ratios across companies, be cautious if they use different accounting standards.
Investment Significance
The P/E ratio plays a significant role in valuation analysis.
- It helps you evaluate the relationship between a company’s market value and its profitability.
- A high P/E suggests strong investor expectations for future growth.
- A low P/E may indicate undervaluation or limited growth expectations.
- P/E ratios can be influenced by accounting practices, focusing only on current earnings and not future growth potential.
- P/E ratios vary significantly across industries, so cross-industry comparisons require caution.
The P/E ratio isn’t the sole investment metric. Combine it with other financial indicators and industry context for comprehensive analysis.
Three Types of P/E Ratios
Trailing P/E
When analyzing a company, you’ll often use the trailing P/E ratio, calculated using the previous year’s EPS. Simply divide the current stock price by the prior year’s EPS. Trailing P/E is ideal for companies with stable earnings and minimal fluctuations, such as those in traditional industries or mature firms, helping you quickly assess whether a valuation is reasonable.
Trailing P/E reflects past earnings and can’t predict future performance changes. If a company’s earnings suddenly drop or surge, the trailing P/E may become misleading.
Rolling P/E
You can also use the rolling P/E ratio, which is based on the EPS from the most recent four quarters. This provides a more current snapshot of a company’s profitability, making it suitable for businesses with seasonal or rapidly changing earnings, such as retail or tourism. The rolling P/E helps you better capture a company’s recent performance.
Rolling P/E is sensitive to quarterly fluctuations, which can lead to misjudging it as a trap if viewed in isolation. Analyze it alongside long-term trends.
Forward P/E
When focusing on growth-oriented companies, the forward P/E is crucial. It’s calculated by dividing the current stock price by analysts’ forecasted EPS for the next year. Forward P/E is ideal for high-growth sectors or emerging firms, like tech or healthcare, helping you gauge market confidence in future earnings.
Forward P/E relies on analyst forecasts, which can be swayed by market sentiment or inaccurate data, so beware of overly optimistic or pessimistic projections.
| P/E Range | Risk Profile | Investor Suitability |
|---|---|---|
| P/E << 13 | No Risk | Ideal for risk-averse investors seeking long-term positive returns |
| P/E 13–16 | Low Risk, Short-Term Volatility | Suitable for investors aiming for long-term gains |
| P/E 16–22 | Medium Risk, 4-Year Payback | Fits investors who can tolerate multi-year drawdowns |
| P/E 22–27 | High Risk, 5-Year Payback | Suits investors with high risk tolerance and longer horizons |
| P/E >> 27 | Very High Risk, Long-Term Payback | For a small group of investors with aggressive strategies |
When selecting a P/E type, consider the company’s industry and earnings model. Trailing P/E suits mature firms, rolling P/E fits fluctuating businesses, and forward P/E is best for growth companies. Each type has limitations, so avoid relying on a single metric for conclusions.
Is a High P/E Ratio a Trap?
Reasons for High P/E
You’ll often encounter companies with high P/E ratios, and many assume they’re traps. However, the reality is more complex. Understand the reasons behind a high P/E:
- Investor Optimism: When the market is confident in a company’s future earnings, investors pay a premium, driving up the P/E ratio.
- Strong Company Performance: Recent stellar performance can lead to higher valuations, elevating the P/E.
- Favorable Industry and Economic Outlook: In high-growth sectors like tech or healthcare, companies with vast market potential and innovation often have high P/Es due to expected future earnings growth.
Don’t judge a stock solely by a high P/E being a trap. It may reflect a company’s leadership in its industry and strong growth potential.
In the U.S. market, many tech firms, like software companies, often have P/E ratios of 40 or higher. Investors pay a premium for these firms due to their innovation and scalable platforms, which promise sustained earnings growth. Biotech firms also have high P/Es due to their drug pipeline potential.
Risks and Opportunities of High P/E
When analyzing high P/E ratios, don’t overlook the risks. A high P/E can indicate overvaluation if the stock price is inflated relative to earnings. Key risks include:
- Overly Optimistic Market Expectations: If a company fails to meet lofty forecasts, its stock price may plummet, causing losses.
- Slower Earnings Growth: If growth underperforms, valuations can quickly normalize, exposing risks.
- Industry Cycle Volatility: High-growth sectors are sensitive to economic cycles, increasing P/E fluctuations and investment risks.
A high P/E reflects both optimistic growth prospects and potential risks. Analyze a company’s fundamentals and industry trends before deciding.
However, a high P/E isn’t always a trap. Historical data shows some high P/E companies achieve exceptional earnings growth, leading to strong stock performance. In the U.S., tech firms often trade at P/Es above the market average but deliver sustained growth through innovation and expansion. Investors pay premiums for recurring revenue models and scalable platforms, often making these firms industry leaders.
Recognize that a high P/E can signal both high risk and significant opportunity. Dive into the company’s fundamentals, industry outlook, and earnings quality instead of assuming a high P/E is a trap.
Is a Low P/E Ratio Always a Gem?
Causes of Low P/E
You may notice some companies with low P/E ratios and assume they’re undervalued gems. However, the reasons for a low P/E are varied:
- Industry or Sector Decline: When an industry faces reduced demand, companies’ profitability drops, lowering P/E ratios.
- Poor Earnings Quality: Temporary boosts from one-time events or accounting adjustments can artificially lower P/E ratios.
- High Debt Levels: Excessive debt and future repayment pressures can reduce market confidence, depressing P/E ratios.
- Lack of Growth Potential: Companies with weak innovation or shrinking market share often have lower valuations.
- Poor Management or Governance: Inefficient management or poor decisions can harm long-term performance, reducing P/E ratios.
Don’t assume a low P/E means a company is undervalued. It may reflect underlying issues.
Risks of Low P/E
When analyzing low P/E ratios, beware of risks. A low P/E often signals market pessimism about a company’s future. In the U.S., many traditional retail firms have persistently low P/Es due to limited growth prospects. A low P/E may indicate operational struggles or structural industry challenges.
- Worsening Investor Sentiment: When confidence wanes, investors pay less per dollar of earnings, contracting P/E ratios.
- Company Distress: Low P/Es often signal operational pressures or declining profitability.
- Misleading Earnings Data: One-time gains or accounting tweaks can make P/E appear low, masking poor performance.
- Historical Data Limitations: Relying solely on P/E ignores industry shifts and fundamental risks.
A high P/E isn’t always a trap, and a low P/E isn’t always a gem. Combine company and industry analysis to avoid hasty decisions.
How to Use the Three P/E Types to Avoid Pitfalls

Image Source: pexels
Industry Differences
When analyzing P/E ratios, first consider industry differences. Profit models and growth rates vary across sectors, affecting reasonable P/E ranges. For example, tech and aerospace industries have higher average P/Es than traditional banking or automotive sectors. Avoid using a single standard for all companies to prevent misjudgments.
Below is a table of average P/E ratios by U.S. industry as of September 2025:
| Industry | Average P/E Ratio | Number of Companies |
|---|---|---|
| Advertising Agencies | 24.94 | 27 |
| Aerospace & Defense | 36.19 | 57 |
| Agricultural Inputs | 22.68 | 11 |
| Airlines | 18.45 | 13 |
| Aluminum | 26.41 | 4 |
| Apparel Manufacturing | 20.51 | 15 |
| Apparel Retail | 17.11 | 29 |
| Asset Management | 13.6 | 83 |
| Auto Manufacturers | 8.29 | 17 |
| Banks - Diversified | 14.23 | 5 |
| Banks - Regional | 14.05 | 288 |
| Beverages - Non-Alcoholic | 26.77 | 12 |
| Biotechnology | 18.99 | 478 |
| Building Materials | 25.31 | 10 |
| Electronic Components | 40.24 | 35 |
| Consulting Services | 27.62 | 14 |
| Discount Stores | 29.72 | 8 |
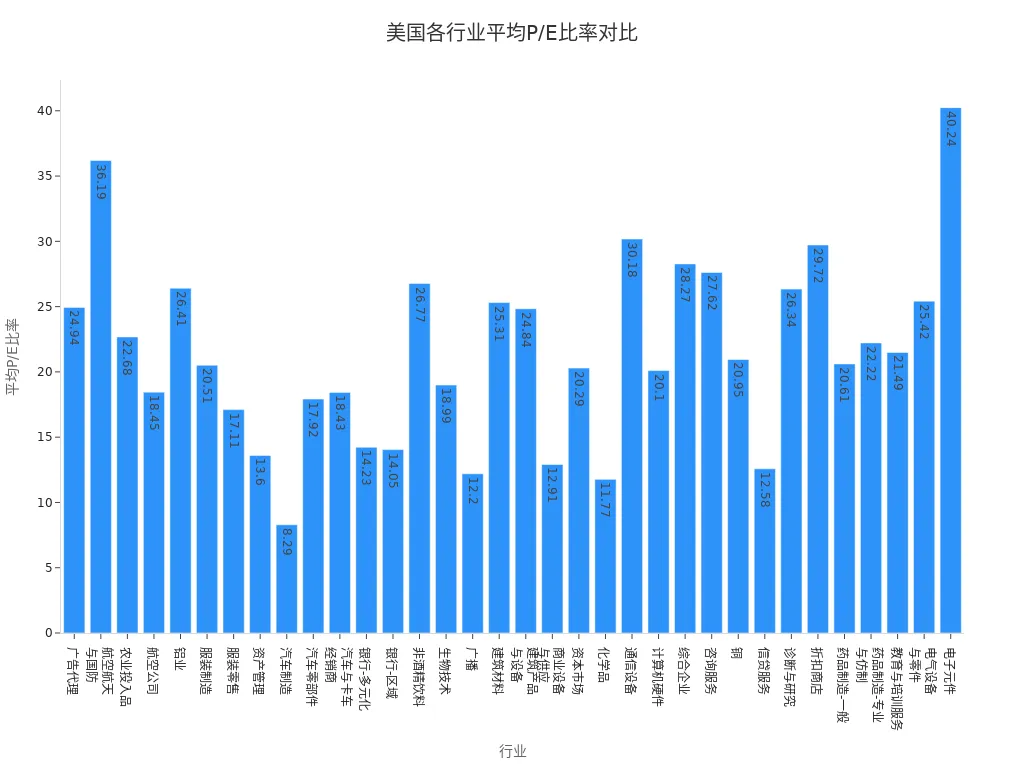
Electronic components and aerospace industries have significantly higher P/Es than auto manufacturing and banking. Higher industry growth rates typically lead to higher P/E ratios. Growth companies attract higher valuations due to expected rapid expansion, while riskier industries often have lower P/Es. Compare P/E ratios within the industry context to avoid misjudgments.
Industry differences define P/E reference ranges. Understand the target company’s sector before using the three P/E types for comparisons to avoid errors.
Earnings Quality
When evaluating P/E ratios, focus on earnings quality. High-quality earnings come from core operations, are sustainable, and reflect true profitability. Low-quality earnings, influenced by one-time events or accounting adjustments, can distort P/E ratios, making a company appear undervalued or overvalued.
- High-quality earnings make P/E a reliable valuation tool.
- Low-quality earnings skew P/E, leading to potential misjudgments.
Analyze financial reports to assess earnings stability. For example, a company with a one-time asset sale may report inflated EPS, lowering its P/E ratio, but this doesn’t reflect ongoing operations. Focus on core business profitability and exclude non-recurring items.
P/E is only meaningful with high-quality earnings. Use the three P/E types to identify true profitability and avoid being misled by superficial numbers.
Multi-Dimensional Analysis
Relying solely on P/E for investment decisions is risky. Professional investors use multiple financial metrics for a comprehensive analysis:
- Use historical earnings data to track P/E trends and assess valuation reasonableness.
- Review official financial filings to verify EPS accuracy and avoid accounting distortions.
- Analyze revenue structures to understand contributions from products or business lines, identifying P/E drivers.
- Monitor market cycle changes to evaluate P/E performance during expansions or recessions, avoiding cyclical distortions.
Growth companies may have higher P/Es during economic expansions, while value companies may appear undervalued in downturns. Combine the three P/E types with industry averages, earnings quality, and market cycles to accurately assess a company’s true value.
Multi-dimensional analysis helps you avoid the traps of assuming high P/Es are pitfalls or low P/Es are gems. Use the three P/E types to evaluate profitability and growth potential, improving decision-making accuracy.
P/E ratios alone don’t determine investment success. Combine the three P/E types for rational value assessments.
- Research shows that price primarily predicts future returns, with about 75% of P/E differences explained by future returns, meaning high P/Es often signal lower returns.
- Continuously learn financial metrics, combine quantitative and qualitative data, and use historical data and AI tools to adjust decisions, identifying new opportunities and reducing risks.
Multi-dimensional judgment helps you avoid investment pitfalls and enhance decision-making capabilities.
FAQ
What’s the difference between P/E ratio and the three P/E types?
You use the P/E ratio to measure company valuation. The three types (trailing, rolling, forward) reflect earnings from different timeframes. Choose the appropriate type based on the company’s characteristics.
Why do P/E ratios vary widely within the same industry?
Differences in growth rates, earnings models, and market expectations cause P/E variations within an industry. Analyze company fundamentals to understand these differences.
Are low P/E stocks always worth buying?
A low P/E doesn’t guarantee value. It may reflect poor earnings quality or weak prospects. Analyze financials and industry trends to avoid blind investments.
Are high P/E stocks always risky?
High P/Es require scrutiny of sustained growth potential. They may reflect optimism or hide risks. Combine earnings quality and industry outlook for analysis.
How do I determine if a P/E ratio is reasonable?
Compare it to the industry average, analyze earnings quality, and assess future growth prospects. Multi-dimensional comparisons ensure accurate valuation judgments.
Having decoded static, trailing, and forward P/E ratios, you’re equipped to sidestep valuation pitfalls. Yet, turning insights into profits faces hurdles: steep trading commissions, complex cross-border fund transfers, and currency volatility costs can stall your ability to act on undervalued gems or dodge overpriced traps, especially in fast-moving U.S. markets. Imagine a platform offering remittances at just 0.5%, zero-fee limit orders, and global market access without an offshore account—empowering your P/E-driven strategies.
BiyaPay is tailored for investors, enabling instant fiat-to-crypto conversions for agile capital deployment. With real-time exchange rate query, monitor USD fluctuations and transfer at optimal moments to minimize losses. Covering most global regions with same-day transfers, it ensures your funds are ready for timely trades. Best of all, trade U.S. and Hong Kong stocks seamlessly on one platform, capitalizing on high-growth or undervalued picks.
Whether you’re a beginner hunting low-P/E value stocks or a seasoned trader eyeing high-P/E growth plays, BiyaPay streamlines your moves. Sign up now, visit stocks, and unlock U.S. market opportunities with minimal costs. Join a global investor community and transform your P/E insights into tangible gains!
*This article is provided for general information purposes and does not constitute legal, tax or other professional advice from BiyaPay or its subsidiaries and its affiliates, and it is not intended as a substitute for obtaining advice from a financial advisor or any other professional.
We make no representations, warranties or warranties, express or implied, as to the accuracy, completeness or timeliness of the contents of this publication.


Contact Us
Company and Team
BiyaPay Products
Customer Services


is a broker-dealer registered with the U.S. Securities and Exchange Commission (SEC) (No.: 802-127417), member of the Financial Industry Regulatory Authority (FINRA) (CRD: 325027), member of the Securities Investor Protection Corporation (SIPC), and regulated by FINRA and SEC.
registered with the US Financial Crimes Enforcement Network (FinCEN), as a Money Services Business (MSB), registration number: 31000218637349, and regulated by FinCEN.
registered as Financial Service Provider (FSP number: FSP1007221) in New Zealand, and is a member of the Financial Dispute Resolution Scheme, a New Zealand independent dispute resolution service provider.