- EasyCard
- Trade
- Help
- Announcement
- Academy
- SWIFT Code
- Iban Number
- Referral
- Customer Service
- Blog
- Creator
Intrinsic Value: How to Evaluate the True Value of Stocks


Image Source: pexels
Do you want to find truly valuable stocks? You need to learn how to scientifically evaluate a stock’s true price. Intrinsic value is the core of value investing. By analyzing a company’s fundamentals and financial data, you can uncover opportunities that the market has undervalued. Doing so can help you avoid risks driven by market hype and make more rational investment decisions.
Key Points
- Intrinsic value is the true value of a stock, calculated based on the company’s fundamentals and future cash flows. Focusing on intrinsic value can help you make more rational investment decisions.
- Using valuation methods such as P/E ratio and P/B ratio, combined with the company’s financial data, enables a more comprehensive assessment of a stock’s intrinsic value.
- Regularly updating intrinsic value assessments, especially after a company releases earnings reports, ensures you stay informed about the latest investment opportunities and risks.
- Paying attention to the gap between intrinsic value and market value can reveal investment opportunities when the market price is below intrinsic value, while caution is needed when the opposite is true.
- Risk control is key to investment success; setting a margin of safety can help you reduce potential losses and enhance the stability of long-term returns.
Definition of Intrinsic Value
Concept Explanation
When investing in stocks, you often hear the term “intrinsic value.” Intrinsic value refers to the theoretical value of a stock calculated based on the company’s fundamentals and future cash flows. You don’t need to focus on market price fluctuations but should estimate a stock’s true value by analyzing the company’s financial condition, profitability, and growth prospects.
- A stock’s intrinsic value is what you calculate based on your analysis methods, unaffected by short-term market sentiment.
- You can set a target value to determine whether a stock is worth investing in.
- Value investors select stocks based on intrinsic value, a method that emphasizes fundamental analysis and is considered a blend of science and art in investing.
If you want to become a rational investor, understanding the concept of intrinsic value is crucial. This allows you to stay calm during market fluctuations and make wiser decisions.
Difference from Extrinsic Value
You also need to distinguish between intrinsic value and extrinsic value (market value). Intrinsic value is the theoretical price you derive based on the company’s fundamentals and future cash flow projections. Market value, on the other hand, is the actual price that buyers and sellers are willing to pay in the current market.
- Intrinsic value is subjective, as different analysts may use different methods and assumptions, leading to varying results.
- Market value is objective, as you can directly observe a stock’s current price on an exchange.
- Intrinsic value aims to reflect the stock’s reasonable price, while market value only reflects the current trading willingness in the market.
When investing, you should focus on the gap between intrinsic value and market value. When the market price is below intrinsic value, there may be an investment opportunity; when the market price exceeds intrinsic value, the risk increases.
Methods for Evaluating Intrinsic Value
When evaluating a stock’s intrinsic value, you can choose from several mainstream methods. Each method has a different theoretical basis and applicable scenario. You need to flexibly select the appropriate valuation tool based on the company’s characteristics and market environment.
P/E Ratio Method
The P/E ratio method (Price-to-Earnings Ratio) is one of the most common valuation methods you can use. You calculate the P/E ratio by dividing the company’s current stock price by its earnings per share. This method is based on several key principles:
- The P/E ratio is related to the Gordon Growth Model (GGM), which can help you estimate a reasonable P/E level.
- You need to focus on the company’s cost structure and growth rate, as these factors directly affect the stock’s fair market value.
- The P/E ratio method is suitable for companies with stable earnings and clear growth prospects. You can compare the current P/E ratio with historical levels or those of peer companies in the same industry to determine if the stock is undervalued or overvalued.
- You should be aware of the limitations of the P/E ratio method. Market sentiment and earnings volatility can affect the accuracy of the P/E ratio. It’s recommended to combine it with other methods for a more comprehensive intrinsic value assessment.
The P/E ratio method is simple and intuitive but cannot be relied upon alone. You need to combine it with the company’s fundamentals and market environment to make more scientific judgments.
P/B Ratio Method
The P/B ratio method (Price-to-Book Ratio) helps you identify undervalued stocks by comparing a company’s market value to its book value. You can understand its advantages and disadvantages as follows:
- You can use the P/B ratio method to quickly screen for undervalued companies, especially those with clear asset structures.
- When comparing companies within the same industry, the P/B ratio method is very useful, helping you focus on the company’s fundamentals.
- The P/B ratio method relies on tangible assets and liabilities, providing a relatively stable valuation reference.
- You can use the P/B ratio method to compare a company’s current valuation with its historical levels to identify changes in value.
However, you should also note:
- The P/B ratio method cannot reflect the value of intangible assets, such as brands and patents.
- P/B ratios vary significantly across industries, so you need to analyze them in the context of industry characteristics.
- A company’s book value changes over time, and historical comparisons may sometimes mislead you.
- Accounting policies may affect book value, leading to distortions in the P/B ratio.
- For high-growth companies, the P/B ratio method has limited reference value and is more suitable for mature, stable companies.
Dividend Yield Method
If you focus on long-term returns, you can consider the dividend yield method. This method centers on a company’s dividends and commonly uses the following theoretical models:
| Model Name | Description |
|---|---|
| Dividend Discount Model (DDM) | Considers the fair value of a stock as the present value of all future dividends. |
| Gordon Growth Model | Assumes dividends grow at a constant rate indefinitely. |
| Multi-Period DDM | Considers multiple future dividend payments and the stock’s sale price. |
| Single-Period Model | Suitable for cases where the stock is held for only one period. |
When using the dividend yield method, you can intuitively measure investment returns. This method is suitable for companies with stable dividends and abundant cash flow. You should note that for growth companies with low dividends, the reference value of this method decreases.
Discounted Cash Flow Method
The Discounted Cash Flow (DCF) method is one of the most rigorous methods for evaluating intrinsic value. You need to forecast the company’s future cash flows and discount them to their present value using an appropriate discount rate. This method involves several key assumptions:
- You must accurately forecast future cash flows, which requires a deep understanding of the company’s investments, market trends, and potential risks.
- You need to select an appropriate discount rate that reflects the investment’s risk and cost of capital. An improper discount rate can affect valuation results.
- You need to reasonably calculate the terminal value, typically using the Gordon Growth Model or a multiples approach.
- You should ensure the forecast period covers the company’s main operating cycles to capture all relevant cash flows.
When using the DCF method, you can obtain a relatively scientific estimate of intrinsic value. However, you should be aware that the academic community has debated the accuracy of the DCF method. Cash flow forecasts are susceptible to subjective judgments, and actual results may deviate from market prices. Therefore, it’s best to combine DCF with other methods.
Comprehensive Analysis Method
If you want a more comprehensive intrinsic value assessment, you can adopt the comprehensive analysis method. This approach combines multiple valuation tools and considers the following core elements:
- Future cash flows
- Growth potential
- Risk factors
- Competitive advantages
Professional analysts typically use the DCF method to forecast future cash flows, then combine market valuations and peer comparisons to balance tangible assets and profitability. You can cross-validate results using multiple methods, understand the assumptions behind each, and consider industry characteristics and the company’s development stage to regularly update valuation results. This enables you to more comprehensively grasp a stock’s intrinsic value and enhance the scientific rigor of investment decisions.
Financial Analysis and Fundamentals

Image Source: pexels
Financial Statement Analysis
When evaluating a company, you must first learn to read financial statements. Financial statements include the balance sheet, income statement, and cash flow statement. You can use these statements to understand the company’s asset structure, debt levels, and operating performance. Investment literature indicates that profitability, growth prospects, and risk are core factors affecting a company’s value. You can focus on the following key financial metrics:
- Earnings Per Share (EPS): Reflects the company’s profitability.
- Revenue Growth Rate: Measures the speed of business expansion.
- Debt-to-Asset Ratio: Helps you assess the company’s financial risk.
- Operating Cash Flow: Shows the actual cash generated by the company.
These metrics can help you systematically analyze a company’s fundamentals and uncover potential investment value.
Profitability and Dividends
When analyzing a company, profitability and dividend policies are critical. Stronger profitability means a higher ability to generate cash flow. The dividend payout ratio determines how much profit the company distributes to shareholders. Research shows that profitability and dividend payout ratios directly affect the cash flows you can expect. Higher profitability typically leads to higher EPS. If a company has stable dividends, you can more accurately estimate the present value of future cash flows, which is crucial for intrinsic value calculations.
- Companies with strong profitability are more likely to sustain dividends.
- A high dividend payout ratio indicates the company’s willingness to reward shareholders.
- You can combine these metrics to assess the company’s long-term investment value.
Growth Prospects
You also need to focus on the company’s growth prospects. Companies with strong growth potential are likely to see improved profitability and cash flows in the future. Investment literature uses principal component analysis to transform financial data into variables reflecting growth potential. You can observe the company’s revenue growth rate, new product development capabilities, and market share changes. These factors determine whether the company can continue to create value. If you find a company with innovation capabilities and competitive advantages in its industry, it usually indicates greater growth potential.
By systematically analyzing financial statements, profitability, dividends, and growth prospects, you can more scientifically evaluate a stock’s intrinsic value.
Valuation Comparisons

Image Source: pexels
Historical Valuation Reference
When evaluating a stock’s intrinsic value, you can start by comparing it to historical valuation levels. You can review the company’s P/E ratio, P/B ratio, and dividend yield over the past few years. This allows you to determine whether the current valuation is high or low. For example, many tech companies in the U.S. market saw significant P/E ratio fluctuations between 2010 and 2020. By comparing historical data, you can identify trends in the company’s valuation. If the current valuation is significantly above the historical average, you need to be cautious of market over-optimism. If it’s below the historical level, there may be an undervaluation opportunity.
Industry Comparison
You can also compare the target company’s valuation with other companies in the same industry. Industry benchmarks can help you identify the company’s competitive position within its sector. You can focus on the following commonly used metrics:
- Residual Cash Earnings (RCE): Measures the company’s ability to generate cash.
- Market Value Creation (MVC): Reflects the company’s value growth in the market.
- Relationship Between Cash Earnings Changes and Cost of Capital: Helps you analyze the efficiency of the company’s capital operations.
Using these metrics, you can determine whether the company outperforms the industry average. If the company excels in its industry, its intrinsic value is typically higher. You can also use these benchmarks to screen for high-quality companies within the industry.
Macro Environment
When evaluating intrinsic value, you also need to consider macroeconomic factors. Interest rates, inflation, and GDP growth all affect a company’s future cash flows and valuation. The following table illustrates the impact of the macro environment on intrinsic value:
| Feature | Description |
|---|---|
| Intrinsic Value | Can predict GDP growth, inflation, and federal funds target rates. |
| Importance | Features related to fundamentals and timeliness are most critical. |
| Asset Price Reaction | Differences in intrinsic value across macroeconomic announcements explain the heterogeneity in asset price reactions. |
You can dynamically adjust your valuation model based on macroeconomic changes. For example, when U.S. federal funds rates rise, a company’s financing costs increase, potentially lowering its intrinsic value. You need to closely monitor macroeconomic data and adjust your investment strategy promptly.
Intrinsic Value and Investment Decisions
Buying Opportunities
When deciding to buy a stock, you should use intrinsic value as the core reference. An investment opportunity exists only when the market price is significantly below the intrinsic value you calculated using scientific methods. You can combine the following key metrics to determine whether a stock is worth buying:
| Metric | Recommended Value |
|---|---|
| P/B Ratio | 1.0 or lower |
| P/E Ratio | Below 40% of the highest P/E over the past five years |
| Stock Price | Below 67% of tangible book value per share and 67% of net current asset value |
| Total Book Value | Greater than total debt |
| Total Debt | Not exceeding twice net current assets, with total current and long-term debt not exceeding total shareholder equity |
You can also use the DCF method for estimation. If the per-share value derived from DCF analysis is higher than the current stock price, it usually indicates the stock is undervalued and worth considering.
Additionally, you can refer to the PEG (Price-to-Earnings-to-Growth) ratio:
- Stocks with a PEG less than 1 are typically considered undervalued, with a low price relative to expected earnings growth.
- A PEG greater than 1 may indicate the stock is overvalued, with future growth unable to support the current price.
By combining these quantitative standards and valuation methods, you can more scientifically seize buying opportunities and avoid chasing market highs or lows.
Selling Strategy
When holding a stock, you also need to dynamically adjust your selling strategy based on intrinsic value. When the market price exceeds your calculated intrinsic value, the risk increases. You can use the “margin of safety” to determine whether to sell. The margin of safety refers to the extent to which the market price exceeds intrinsic value, with different risk levels corresponding to different margin of safety requirements:
| Risk Stability Level | Margin of Safety Requirement |
|---|---|
| A | 20% |
| B | 15% |
| C | 10% |
| D | 5% |
| F | 0% |
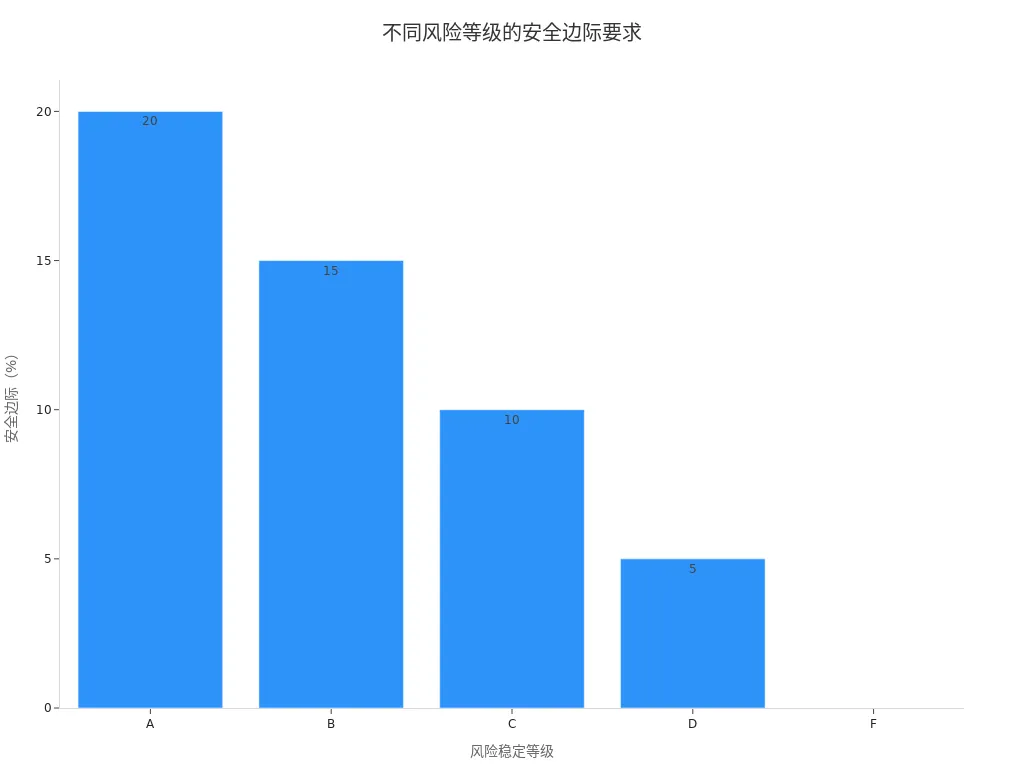
You can set a reasonable margin of safety based on your assessment of the company’s risk. When the market price exceeds the intrinsic value and reaches your margin of safety target, it’s a good time to consider selling. This helps you lock in profits and avoid losses due to market fluctuations.
Risk Control
During the investment process, risk control is equally important. The deviation between market price and intrinsic value often provides investment opportunities but also carries risks. You can adopt the following strategies for risk management:
- Market prices eventually revert to intrinsic value, allowing you to identify undervalued or overvalued assets based on this principle.
- Behavioral anomalies and market sentiment fluctuations may lead to mispricing, offering opportunities to buy low and sell high.
- The value investing philosophy emphasizes buying when the market price is below intrinsic value, using the margin of safety to protect capital.
- Investment legends like Benjamin Graham and Warren Buffett advocate making rational decisions based on intrinsic value during market inefficiencies.
By scientifically evaluating intrinsic value and combining it with margin of safety and risk levels, you can effectively control investment risks and enhance the stability of long-term returns.
Common Pitfalls
Method Selection Pitfalls
When choosing methods to evaluate intrinsic value, you may fall into some common pitfalls. Many people misunderstand Benjamin Graham’s intrinsic value formula, believing it to be a recommended stock selection method. In fact, the formula V = EPS x (8.5 + 2g) is only meant to highlight the unreliability of market predictions. Graham himself did not advocate using this formula directly for stock selection. He opposed chart analysis or market forecasting, emphasizing data analysis based on a company’s past performance. In practice, you should avoid blindly applying a single formula and instead combine multiple methods, focusing on the company’s true fundamentals.
- Many people misinterpret Graham’s intrinsic value formula as a stock selection standard.
- The formula is widely circulated, but Graham did not recommend its direct use.
- Graham advocated analyzing companies using historical data rather than relying on market growth expectations.
Data Reliability
When evaluating intrinsic value, data reliability is critical. High-quality data enables accurate financial modeling and valuation predictions. If you use inaccurate data, it may lead to erroneous conclusions or significant valuation biases. You should prioritize financial statements and industry data from authoritative sources to ensure a solid analytical foundation.
- Data reliability directly affects the quality of financial analysis and is the foundation of intrinsic value evaluation.
- High-quality data improves the accuracy and credibility of valuations.
- Low-quality data can lead to misjudgments and significant valuation errors.
When analyzing, always verify data sources to avoid distorted investment decisions due to unreliable data.
Dynamic Adjustments
In the actual investment process, a company’s fundamentals constantly change. You need to recalculate the company’s intrinsic value in real-time based on changes in revenue, profit margins, working capital, or capital expenditures. Through comprehensive financial statement forecasting, you can easily simulate different assumption scenarios and assess the impact of price increases or cost savings on valuation. When building dynamic valuation models for yourself or clients, remember that different methodologies may yield completely different results. Intrinsic value is not a fixed number but a combination of your judgment and assumptions about the company’s future.
- You should adjust valuations promptly based on changes in the company’s operating data.
- Financial statement forecasting helps you simulate different scenarios, enhancing decision-making rigor.
- Different valuation methods may produce varying results, requiring flexible application based on judgment and assumptions.
When evaluating a stock’s intrinsic value, you can follow this core process:
- Clearly define intrinsic value and establish reasonable valuation standards.
- Understand market and investor behavioral biases to avoid emotional influences on judgment.
- Choose an investment method that suits you and continuously optimize your analytical tools.
By combining multiple valuation methods, such as cash flow-based and accrual-based models, you can improve evaluation accuracy. This combination allows you to understand a company’s financial performance from different perspectives, significantly enhancing target price estimates.
You also need to continuously monitor changes in company fundamentals. Research shows that during periods of high market uncertainty, company fundamentals have a greater impact on stock price volatility, especially for smaller companies.
| Investment Strategy | Impact | Description |
|---|---|---|
| Identifying Undervalued Stocks | Positive | You can achieve better returns amid market volatility. |
| Managing Downside Risk | Positive | You can better control potential losses. |
| Leveraging Reinvestment Opportunities | Positive | You can enhance the long-term growth and resilience of your portfolio. |
By applying what you’ve learned to actual investments, you can more scientifically identify opportunities and risks, improving long-term decision-making.
FAQ
How do you determine if a stock is undervalued?
You can compare a stock’s market price to its intrinsic value. If the market price is below the intrinsic value you calculated, the stock may be undervalued. You can also refer to historical valuations and industry averages.
It’s recommended to combine multiple methods to avoid relying on a single judgment.
How often should you reassess a stock’s intrinsic value?
You should update intrinsic value assessments after the company releases quarterly or annual earnings reports. If the company undergoes significant operational changes, you also need to recalculate.
- Regular reviews help you seize the latest investment opportunities.
Can you rely solely on the P/E ratio method to evaluate intrinsic value?
You should not rely solely on the P/E ratio method. While simple, it is susceptible to market sentiment and earnings volatility. Combine it with methods like DCF and P/B ratio to improve accuracy.
How do you obtain reliable financial data?
You can obtain financial data from company announcements, the U.S. Securities and Exchange Commission (SEC) website, or reputable financial databases. High-quality data helps you make more scientific investment decisions.
| Data Source | Reliability |
|---|---|
| Company Announcements | High |
| SEC Website | High |
| Financial Databases | Relatively High |
What risks should you consider when evaluating intrinsic value?
You need to consider the company’s operational risks, industry changes, and macroeconomic environment. Market volatility and policy changes can also affect intrinsic value. Set a margin of safety to reduce potential losses.
Risk management is key to long-term investment success.
By mastering intrinsic value and valuation methods, you’re equipped to scientifically assess a stock’s true worth, but high cross-border fees, currency volatility, and offshore account complexities can hinder seizing U.S. value investing opportunities, especially when responding to earnings data or adjusting positions. Picture a platform with 0.5% remittance fees, same-day global transfers, and contract limit orders with zero fees, enabling seamless investment in undervalued stocks via one account?
BiyaPay is tailored for value investors, offering instant fiat-to-digital conversions to act on intrinsic value signals nimbly. With real-time exchange rate query, monitor USD trends and transfer at optimal moments to cut costs. Covering most regions with instant arrivals, it powers rapid allocations to S&P 500 value ETFs (like VTV) or undervalued stocks. Crucially, trade U.S. and Hong Kong markets through a single account, leveraging contract limit orders with zero fees for DCF or P/E-based limit strategies.
Whether chasing long-term gains or avoiding overvalued risks, BiyaPay fuels your precision. Sign up now, visit stocks for U.S. prospects—quick setup unlocks cost-effective, data-driven investing. Join global investors and triumph rationally in 2025!
*This article is provided for general information purposes and does not constitute legal, tax or other professional advice from BiyaPay or its subsidiaries and its affiliates, and it is not intended as a substitute for obtaining advice from a financial advisor or any other professional.
We make no representations, warranties or warranties, express or implied, as to the accuracy, completeness or timeliness of the contents of this publication.


Contact Us
Company and Team
BiyaPay Products
Customer Services


is a broker-dealer registered with the U.S. Securities and Exchange Commission (SEC) (No.: 802-127417), member of the Financial Industry Regulatory Authority (FINRA) (CRD: 325027), member of the Securities Investor Protection Corporation (SIPC), and regulated by FINRA and SEC.
registered with the US Financial Crimes Enforcement Network (FinCEN), as a Money Services Business (MSB), registration number: 31000218637349, and regulated by FinCEN.
registered as Financial Service Provider (FSP number: FSP1007221) in New Zealand, and is a member of the Financial Dispute Resolution Scheme, a New Zealand independent dispute resolution service provider.