- EasyCard
- Trade
- Help
- Announcement
- Academy
- SWIFT Code
- Iban Number
- Referral
- Customer Service
- Blog
- Creator
Looking at market confidence from the circuit breaker mechanism: How to make calm decisions during a sharp decline?


Image Source: unsplash
During market turbulence, investors face immense pressure. Historical data shows the U.S. market has experienced several significant downturns:
| Date | Crash/Bear Market | Impact | Related Index |
|---|---|---|---|
| Mar 2020 | COVID-19 Crash | S&P 500 dropped 34% | S&P 500 |
| May 2011 | Brief Bear Market | S&P 500 fell 21.58% | S&P 500 |
| Sep 2008 | Financial Crisis | Dow Jones recorded largest single-day point loss | Dow Jones Industrial Average |
| Mar 2000 | Dot-Com Bubble | Nasdaq declined 78% | Nasdaq |
| Oct 1987 | Black Monday | Dow Jones fell 22.6% in a single day | Dow Jones Industrial Average |
Research shows that rational analysis, emotional discipline, and adherence to long-term investment principles reduce irrational decisions. By leveraging the cooling-off period provided by circuit breakers, you can better capitalize on the market’s long-term upward trend, avoiding losses from panic-driven sales.
Key Highlights
- Staying calm during market crashes is the foundation of rational decisions. Regularly assess your risk tolerance to avoid emotion-driven choices.
- Circuit breakers offer a pause, allowing you to reassess market data and reduce the likelihood of panic selling.
- Holding quality assets long-term mitigates short-term volatility; stick to your long-term strategy to avoid disruptions from market swings.
- Scientific asset allocation and periodic rebalancing enhance portfolio resilience, enabling flexible adjustments to market changes.
- Focus on fundamental metrics like revenue growth and cash flow to identify high-quality assets amid uncertainty.
Principles of Calm Decision-Making

Image Source: pexels
Rational Analysis
Rational analysis is critical during market crashes. Behavioral finance research highlights that emotions and cognitive biases often lead to irrational decisions, exacerbating volatility. The table below lists key psychological research themes and a source:
| Research Theme |
|---|
| Market Volatility and Investor Behavior Triggers |
| Understanding Behavioral Finance: Staying on Course in Volatile Markets |
| Understanding Behavioral Biases in Financial Decisions |
You may fall prey to loss aversion or confirmation bias, leading to panic selling or overconfidence. Adopting contrarian strategies or passive index investing reduces stress from short-term fluctuations. Circuit breakers provide a cooling-off period, helping you reassess market information and avoid herd behavior.
Emotional Discipline
Effective emotional discipline significantly reduces panic selling. Financially literate investors are more likely to hold assets rationally during crises rather than selling impulsively. Enhanced financial knowledge helps you evaluate long-term trends and boosts confidence in market recovery. Common mistakes include:
- Panic selling, locking in losses
- Exiting the market and holding cash, missing rebounds
- Overconfidence, leading to frequent portfolio adjustments
- Lack of a financial plan, resulting in impulsive decisions
Stay calm, avoid emotional decisions, and use circuit breaker pauses for self-reflection.
Long-Term Perspective
A long-term perspective is key to navigating volatility. Historical data shows that holding quality assets long-term offsets short-term declines, driving wealth growth. The chart below illustrates U.S. stock market cumulative returns after five major crashes across various holding periods:
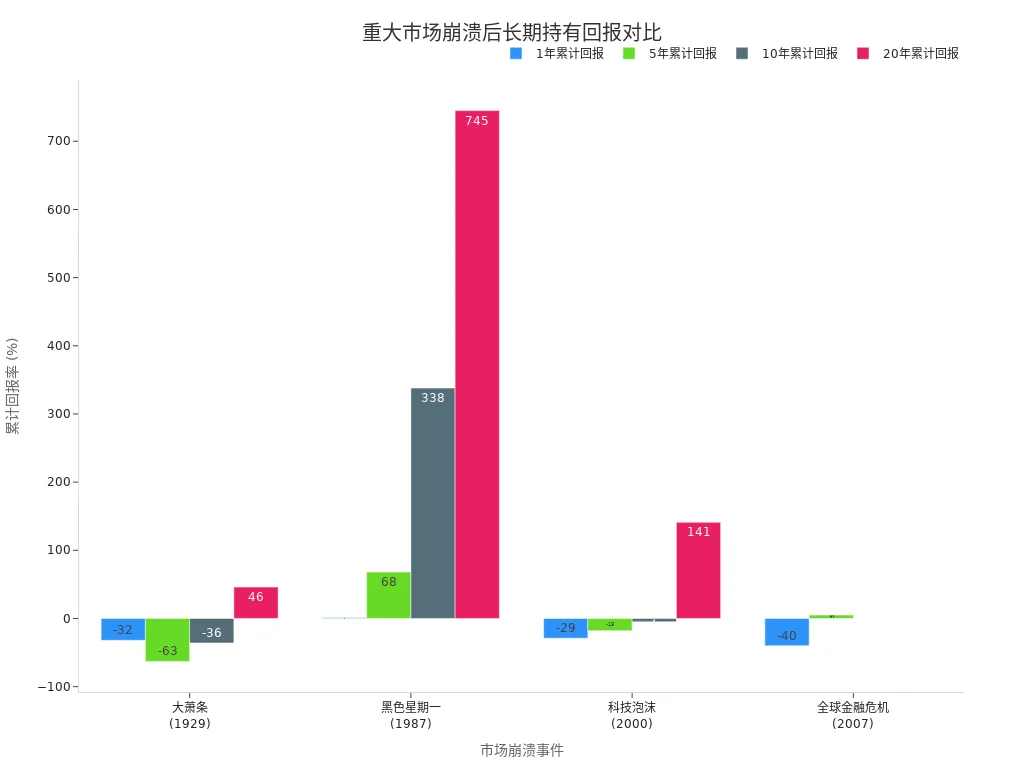
The S&P 500 has never recorded a loss over any 15-year rolling period. Passive index investing and independent thinking help you stick to long-term strategies, avoiding disruptions from short-term volatility. A long-term perspective enhances confidence and allows you to seize recovery opportunities post-circuit breaker.
Role of Circuit Breakers
Image Source: unsplash
Definition and Tiers
Circuit breakers are mechanisms that pause trading during extreme market volatility to prevent irrational declines driven by panic. Global markets use tiered systems. In the U.S., three-tier circuit breakers trigger when the S&P 500 drops 7%, 13%, or 20%, pausing trading for varying durations. Japan, the UK, China, Hong Kong, and Canada have similar mechanisms. The table below outlines circuit breaker thresholds:
| Market | Trigger Threshold | Notes |
|---|---|---|
| U.S. | S&P 500 drops 7% | Level 1 MCWB triggered |
| Japan | Nikkei 225 drops 7% | 30-minute trading halt |
| UK | FTSE 100 drops 7% | Trading pause |
| China | CSI 300 drops 7% | 30-minute trading halt |
| Hong Kong | 5% drop | 30-minute trading halt |
| Canada | 10% stock price swing | 5-minute trading halt |
Market-wide circuit breakers (MCWB) and limit-up/limit-down (LULD) mechanisms form a tiered system.
Trigger Conditions
Circuit breakers activate based on single-day index declines. In the U.S., a 7% S&P 500 drop triggers a 15-minute trading pause. Further drops to 13% or 20% escalate the pause or halt trading for the day. China implemented similar thresholds in 2016. Research shows circuit breakers often activate near market crashes, with investor herd behavior and emotions amplifying price swings, prompting earlier intervention.
| Research Theme | Trigger Condition | Impact |
|---|---|---|
| Circuit Breakers in Chinese Markets | Near market crash | Trading halts impact liquidity; investor behavior accelerates price limits. |
| Herd Behavior and Circuit Breakers | Triggered near Jan 4, 2016 crash | Herd behavior and volatility are mutually causal, driven by emotions and fundamentals. |
Market Stabilization
Circuit breakers aim to provide a cooling-off period, fostering rational analysis and curbing panic selling. Regulators believe they:
- Prevent severe price swings, ensuring fair and orderly trading
- Maintain market integrity
- Pause trading to address excessive volatility, protecting price discovery
Empirical evidence from March 2020 U.S. market circuit breaker triggers shows reduced volatility, alleviated selling pressure, and stabilized returns. Pauses allow you to digest information, avoiding herd-driven sales. Research confirms circuit breakers enhance market quality without sparking panic.
WFE and other analyses highlight circuit breakers as effective tools for managing financial market stress and protecting investors, widely adopted globally.
Impact of Circuit Breakers
Positive Impacts
Circuit breakers deliver several benefits during extreme volatility. Post-pause, stock returns stabilize, selling pressure eases, and prices better reflect true supply and demand. The table below summarizes positive impacts on market confidence:
| Impact Area | Outcome |
|---|---|
| Return Stability | Stock returns stabilize on average |
| Reduced Selling Pressure | Panic selling decreases |
| Informed Pricing | Prices reflect true market dynamics |
| Cooling-Off Period | Time for investors to reassess decisions |
In March 2020, U.S. market 15-minute pauses prevented “flash crashes,” protecting investors. Studies confirm circuit breakers mitigate excessive volatility, giving you time to think calmly.
Negative Impacts
Despite benefits, circuit breakers face criticism:
- Some argue they reduce market liquidity, lowering market depth.
- You may be unable to trade during pauses, forcing passive holding.
- In retail-driven markets, circuit breakers may heighten irrationality or panic, leading to larger sell-offs post-resumption.
- They can disrupt normal trading, slowing price discovery.
- During major news, circuit breakers may hinder natural price adjustments.
Scholars note that circuit breakers can prompt preemptive selling near trigger thresholds, amplifying volatility.
Case Studies
U.S. and Chinese market circuit breaker events provide valuable insights. The table below summarizes key academic findings:
| Key Finding | Description |
|---|---|
| Market Stability | Market-wide circuit breakers fail to fully stabilize markets, delaying price discovery. |
| Volatility | Post-circuit breaker, volatility rises with increased speculation. |
| Information Asymmetry | Asymmetry and liquidity imbalances create a “magnet effect” near trigger thresholds. |
Notably, circuit breakers are not the primary cause of crashes. They calm investor emotions, reduce selling intensity, and restore order. Their essence is to provide breathing room, mitigating panic and irrational decisions.
Coping Strategies
Staying Calm
Staying calm is critical for rational decisions during volatility. Behavioral finance shows emotional reactions lead to errors. Financial advisors help maintain long-term focus, reducing impulsive moves driven by loss aversion. Practical techniques include:
- Reviewing your investment plan and goals
- Regularly assessing risk tolerance
- Maintaining an emergency fund for resilience
- Using systematic rebalancing
- Stress-testing your portfolio
- Practicing breathing techniques (e.g., box breathing) to ease tension
Staying calm during downturns avoids emotion-driven errors, enhancing long-term returns.
Asset Allocation
Scientific asset allocation bolsters portfolio resilience during extreme volatility. Crashes often stem from economic shocks, geopolitical events, or investor psychology. Selling during downturns locks in losses, disrupting long-term plans. Experts suggest dynamic allocation tailored to your financial situation. The traditional 60/40 model may not suit all environments, so adjust flexibly. The table below shows diversified portfolio performance during crises:
| Crisis Period | Portfolio Performance | Avg Real Monthly Return | Sharpe Ratio |
|---|---|---|---|
| Dot-Com Crash | All four portfolios negative | Negative | Negative |
| Great Depression | All four portfolios negative | Negative | Negative |
| COVID-19 Crisis | All four portfolios positive | Positive | Positive |
Markets often recover before positive news emerges. Sticking to a disciplined allocation yields long-term gains.
Risk Management
Robust risk management is key to handling extreme volatility. Experts recommend frameworks to identify, assess, and mitigate risks. The table below outlines mainstream risk management tools:
| Framework | Description | Applicability |
|---|---|---|
| COSO Framework | Flexible, consistent internal risk management | Public/private companies, governments, nonprofits |
| ISO 31000 | Consistent enterprise risk management for any organization | Multinational firms across industries |
| VaR | Estimates max potential loss over a period | Financial market risk assessment |
| Monte Carlo Simulation | Simulates outcomes using random sampling | Finance, project management, insurance |
| Credit Risk Models | Assesses borrower default likelihood | Banking and credit evaluation |
| Expected Shortfall | Measures average loss exceeding VaR threshold | Financial risk, extreme events |
| Risk-Adjusted Return on Capital | Evaluates profitability of business units/investments | Financial capital allocation |
Hedging and stop-loss orders further reduce risk. Hedging offsets potential losses, while stop-losses automatically sell at predefined prices, curbing emotional decisions.
Focus on Fundamentals
During volatility, focus on company fundamentals. Metrics like revenue growth, profit margins, dividends, and cash flow reflect true business health. Strong revenue signals innovation and competitiveness, high margins indicate efficiency, stable dividends show shareholder commitment, and ample cash flow supports resilience. Analyzing these helps you identify quality assets, avoiding missed opportunities due to short-term swings. Circuit breakers provide time to study fundamentals for informed decisions.
Portfolio Review
Regular portfolio reviews and rebalancing manage risk and enhance returns. Research compares rebalancing strategies:
| Rebalancing Strategy | Description | Pros and Cons |
|---|---|---|
| Calendar-Based | Review and reset weights on fixed dates (e.g., quarterly) | Simple but may rebalance unnecessarily or miss urgent shifts. |
| Threshold-Based | Monitor drift, rebalance when allocations exceed target range | Requires active monitoring but saves costs by avoiding unneeded trades. |
| Hybrid Approach | Combines annual reviews with tolerance bands (±10-20%) | Needs tighter bands or frequent checks in volatile markets. |
Periodic rebalancing maintains risk levels and counters behavioral biases, reducing excessive trading losses. It encourages buying low and selling high, enhancing discipline and returns.
Expert Scott Mackenzie notes that understanding biases and adjusting plans during volatility is key. Staying invested and rebalancing drives post-crisis gains.
The table below highlights U.S. market long-term benefits:
| Investment Strategy | Outcome Description |
|---|---|
| Staying Invested | S&P 500 recovers and surpasses highs, benefiting long-term holders. |
| Portfolio Rebalancing | Rebalancing during volatility enhances long-term returns. |
Use investor insights and financial education to improve decision-making, navigating volatility scientifically.
FAQ
Do circuit breakers affect trading strategies?
In the U.S. market, circuit breakers prompt strategy adjustments. You can use the pause to reassess market data, reducing impulsive trades. Experts recommend maintaining a long-term focus to avoid altering allocations due to short-term volatility.
Circuit breakers provide a cooling-off period for rational decisions.
Do circuit breakers reduce market liquidity?
Trading pauses temporarily reduce liquidity. Resumption may see concentrated trading, increasing volatility. Regulators balance stability and liquidity through tiered circuit breakers.
| Impact Type | Outcome |
|---|---|
| Liquidity | Temporarily reduced |
| Volatility | May rise post-resumption |
How can investors manage risk during circuit breakers?
During pauses, review your portfolio and risk exposure. Use U.S. market historical data, stop-losses, and rebalancing to enhance safety. Maintain an emergency fund for resilience.
How do markets typically perform after circuit breakers?
Post-circuit breaker, U.S. market volatility often eases. Pauses allow information digestion, stabilizing emotions. Data shows reduced panic selling, boosting confidence.
Research confirms circuit breakers maintain order and protect investors.
Are circuit breakers universal across financial markets?
Most major stock markets have circuit breakers, but rules vary. The U.S. uses a three-tier system, while Hong Kong has similar mechanisms. Understand each market’s regulations to adjust strategies.
Mastering circuit breakers and calm decision-making equips you to navigate market crashes, but high cross-border fees, currency volatility, and account setup complexities can limit swift adjustments or recovery plays in U.S. markets. Envision a platform with 0.5% remittance fees, same-day global transfers, and zero-fee contract limit orders, enabling seamless responses to circuit breaker pauses via one account?
BiyaPay is crafted for volatile market investors, offering instant fiat-to-digital conversions to act on post-breaker signals. With real-time exchange rate query, track USD trends and remit at optimal moments to cut costs. Covering most regions with instant arrivals, it powers rapid allocations to S&P 500 ETFs (like VOO) or quality stocks. Standout: trade U.S. and Hong Kong markets through a single account, leveraging zero-fee contract limit orders for fundamental or rebalancing-based limit strategies.
Whether facing crash-induced panic or recovery opportunities, BiyaPay fuels your edge. Sign up now, visit stocks for U.S. prospects—quick setup unlocks cost-effective, rational investing. Join global investors and thrive in 2025 volatility!
*This article is provided for general information purposes and does not constitute legal, tax or other professional advice from BiyaPay or its subsidiaries and its affiliates, and it is not intended as a substitute for obtaining advice from a financial advisor or any other professional.
We make no representations, warranties or warranties, express or implied, as to the accuracy, completeness or timeliness of the contents of this publication.


Contact Us
Company and Team
BiyaPay Products
Customer Services


is a broker-dealer registered with the U.S. Securities and Exchange Commission (SEC) (No.: 802-127417), member of the Financial Industry Regulatory Authority (FINRA) (CRD: 325027), member of the Securities Investor Protection Corporation (SIPC), and regulated by FINRA and SEC.
registered with the US Financial Crimes Enforcement Network (FinCEN), as a Money Services Business (MSB), registration number: 31000218637349, and regulated by FinCEN.
registered as Financial Service Provider (FSP number: FSP1007221) in New Zealand, and is a member of the Financial Dispute Resolution Scheme, a New Zealand independent dispute resolution service provider.