- EasyCard
- Trade
- Help
- Announcement
- Academy
- SWIFT Code
- Iban Number
- Referral
- Customer Service
- Blog
- Creator
Which S&P 500 ETF is Better? A Comprehensive Comparison Guide between VFV and VOO


Image Source: unsplash
When selecting an S&P 500 ETF, VFV and VOO are two of the most popular options. Investors often ask: which ETF is better suited for you? You should focus on key factors like management fees, liquidity, taxes, and currency risks.
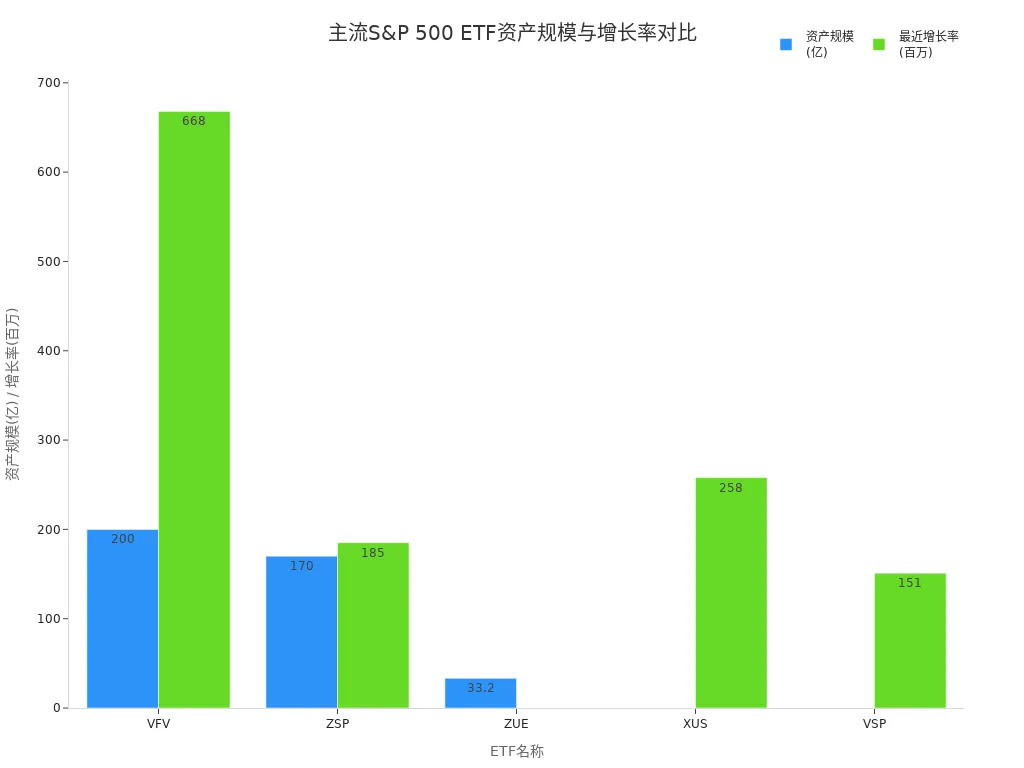
Both VFV and VOO are leading ETFs in terms of asset size and growth. The table below shows VFV’s asset size (in USD billions) and recent growth rate (in USD millions) compared to other major ETFs:
| ETF Name | Asset Size (Billions USD) | Recent Growth Rate (Millions USD) |
|---|---|---|
| VFV | 8.6 | 2,900 |
| XUS | N/A | 258 |
| VSP | N/A | 151 |
| ZSP | 11.3 | 185 |
| ZUE | 33.2 | N/A |
You can make an informed choice by evaluating fees, liquidity, taxes, and currency risks based on your needs.
Key Highlights
- Management fees are critical when choosing an ETF. VOO’s expense ratio is 0.03%, lower than VFV’s 0.09%. Lower fees significantly boost long-term returns.
- Liquidity impacts trading costs. VOO’s average daily trading volume is $12.8B, ensuring seamless transactions. Frequent traders should prioritize VOO.
- Tax optimization is vital. Holding VOO in an RRSP avoids the 15% U.S. dividend withholding tax, ideal for tax-conscious investors.
- Dividend reinvestment enhances long-term returns. Enabling automatic reinvestment leverages compounding for higher future gains.
- Currency risk matters. VFV is priced in CAD and affected by exchange rate fluctuations, while VOO, priced in USD, requires currency conversion for Canadian investors.
S&P 500 ETF Overview

Image Source: pexels
VFV Overview
VFV is an excellent choice for investing in U.S. large-cap companies. Managed by Vanguard, VFV aims to closely track the S&P 500 Index’s performance. You can buy and sell VFV in Canadian dollars on the Toronto Stock Exchange (TSX), eliminating the need for currency conversion. VFV’s management expense ratio (MER) is 0.09%, with total assets under management at approximately $8.6 billion. It has robust trading activity, with a 30-day average daily volume of around 219,702 shares.
The table below compares VFV’s historical returns to other major indices:
| Year | Vanguard S&P 500 Index ETF (VFV) | S&P/TSX 60 Index Total Return | BMO S&P 500 Hedged to CAD Index ETF |
|---|---|---|---|
| 2018 | 2.93% | -7.58% | -6.90% |
| 2019 | 25.13% | 21.93% | 29.70% |
| 2020 | 15.59% | 5.56% | 15.44% |
| 2021 | 27.50% | 28.04% | 27.86% |
| 2022 | -12.59% | -6.24% | -19.43% |
| 2023 | 23.23% | 12.05% | 24.34% |
| 2024 | 35.24% | 21.04% | 23.40% |
| YTD | 6.83% | 19.63% | 11.41% |
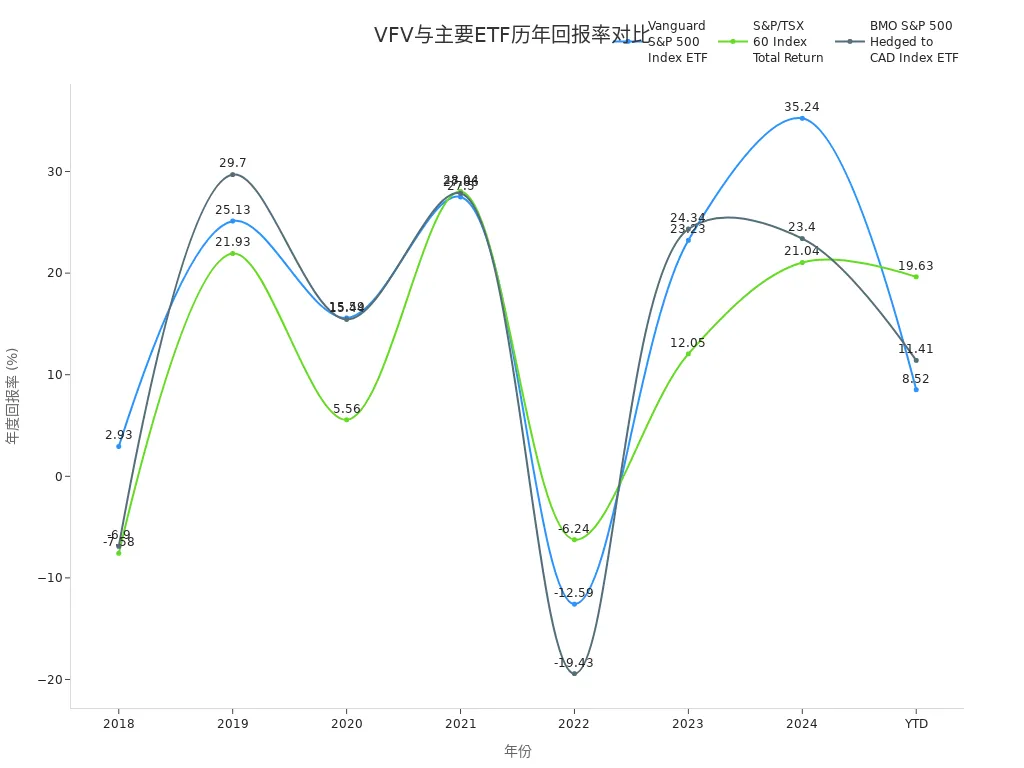
VFV has consistently performed well, closely tracking U.S. market trends.
- Investment Strategy: Tracks U.S. large-cap stocks
- Low Fees: MER of 0.09%
- Active Trading: High daily trading volume
VOO Overview
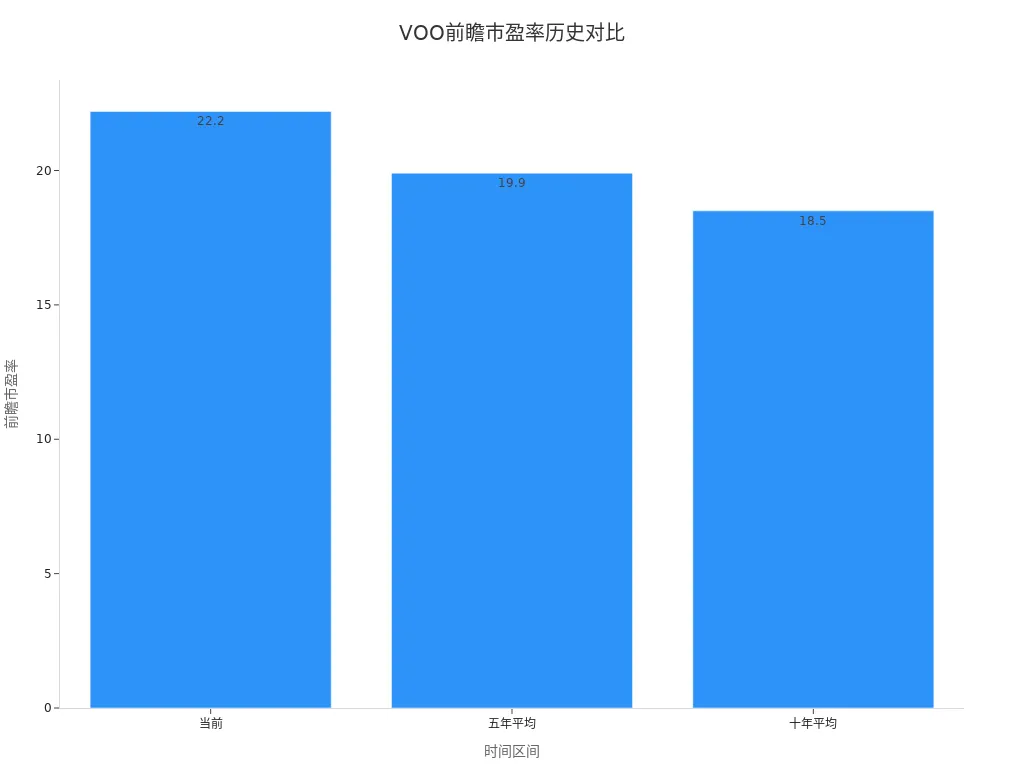
VOO is one of the largest S&P 500 ETFs in the U.S. market. You can trade VOO in U.S. dollars on the New York Stock Exchange (NYSE). With massive assets under management and exceptional liquidity, VOO offers returns synchronized with the S&P 500 Index. VOO’s forward P/E ratio is currently 22.2, above its five-year average of 19.9 and ten-year average of 18.5. Since early 2023, VOO has delivered a 66.4% return, with a year-to-date return of 7.20% as of September 9, 2025.
| Feature | Statistic |
|---|---|
| Scale | Largest S&P 500 fund |
| Year-to-Date Return | 7.20% |
| Return Since Early 2023 | 66.4% |
| Current Valuation | Forward P/E 22.2 |
| 5-Year Avg Forward P/E | 19.9 |
| 10-Year Avg Forward P/E | 18.5 |
VOO provides access to long-term U.S. market growth. Its high liquidity and scale make it ideal for flexible trading.
- Largest asset scale with strong liquidity
- Tracks S&P 500 Index, aligning with U.S. market performance
- Current valuation above historical averages
Fee Comparison
Image Source: pexels
Management Fees
Management fees directly impact your investment returns. Lower fees allow you to retain more gains. Both VOO and VFV are low-cost ETFs, but VOO has a lower expense ratio. The table below compares their fees:
| Fund | Expense Ratio |
|---|---|
| VOO | 0.03% |
| VFV | 0.09% |
VOO’s expense ratio of 0.03% is significantly lower than VFV’s 0.09%. While the difference may seem small, it compounds over time, especially for long-term investments. For a 10-year or longer horizon, VOO’s lower fees can save you significant costs, particularly with larger investments.
Tip: Savings from lower management fees remain in your account, compounding over time to boost overall returns.
Trading Costs
Trading costs, including bid-ask spreads and brokerage commissions, also affect your returns. VOO, listed on the U.S. market, has a high trading volume, resulting in tight bid-ask spreads and low slippage risk for large trades. VFV, listed on the Canadian market, has good liquidity but may experience slightly wider spreads during volatile conditions or large transactions, potentially leading to price discrepancies.
Brokerage commissions for U.S. stocks and Canadian stocks may differ. Check your broker’s fee structure to avoid unexpected costs.
For frequent traders or those investing large sums, VOO’s superior liquidity and lower trading costs make it the better choice.
Liquidity Analysis
Trading Volume
Trading volume is a key indicator of liquidity. Higher volumes ensure easier transactions at prices close to market levels. VOO’s average daily trading volume is approximately $12.8B, far exceeding most comparable ETFs. VFV also has solid liquidity in the Canadian market, with a 30-day average daily volume of 219,702 shares, but it lags behind VOO. The table below compares their trading volumes:
| ETF | Average Daily Trading Volume |
|---|---|
| VOO | $12.8B |
| VFV | 219,702 shares |
VOO’s high volume ensures you can execute trades, even large ones, with minimal difficulty. If you trade frequently or need to adjust positions flexibly, VOO is more suitable.
Bid-Ask Spread
The bid-ask spread is the difference between the buying and selling price. Smaller spreads reduce trading costs. VOO’s high trading volume results in very tight spreads, allowing you to trade at near-market prices. VFV’s spreads are generally narrow but may widen during extreme market conditions or large trades, potentially impacting transaction prices.
For long-term investors with occasional trades, VFV’s liquidity is sufficient. However, for frequent traders or those executing large orders, VOO’s liquidity advantage minimizes costs.
Tip: Use limit orders to control transaction prices and reduce losses from wider spreads.
Tax Implications
Dividend Taxes
Dividend taxes significantly affect your returns. For Canadian investors, VFV and VOO have different tax treatments:
- Holding VFV in any account type (e.g., RRSP, TFSA, RESP) incurs a 15% U.S. dividend withholding tax, which cannot be avoided, even in an RRSP.
- Holding VOO in an RRSP exempts you from the 15% U.S. dividend withholding tax due to the Canada-U.S. tax treaty, maximizing your net dividends.
- In taxable accounts, VOO’s dividends are subject to the 15% withholding tax, but you may recover some through a foreign tax credit.
For tax optimization, holding VOO in an RRSP is ideal to maximize dividend income.
| ETF | Account Type | U.S. Dividend Withholding Tax | Tax Optimization Strategy |
|---|---|---|---|
| VFV | Any Account | 15% | Unavoidable |
| VOO | RRSP | 0% | Preferred |
| VOO | Taxable | 15% (Recoverable via credit) | Foreign Tax Credit |
Capital Gains Taxes
When selling ETFs, you may incur capital gains taxes. For Canadian investors, capital gains taxes for VFV and VOO are calculated similarly in taxable accounts, based on your income level. In registered accounts like RRSP or TFSA, capital gains are tax-deferred or tax-free.
- VFV and VOO have no significant differences in capital gains tax treatment; the account type matters most.
- In taxable accounts, track buy and sell prices for accurate tax reporting.
- Registered accounts (RRSP, TFSA) reduce capital gains tax burdens, ideal for long-term investors.
Tip: Plan your account structure to combine dividend and capital gains tax benefits for higher after-tax returns.
For tax optimization, VOO in an RRSP is highly advantageous. Consult a professional to align your ETF and account choices with your tax situation.
Currency Risk
Exchange Rate Impact
Currency fluctuations impact your returns when investing in S&P 500 ETFs. VFV is priced in CAD and traded on the TSX, requiring no currency conversion. However, its underlying holdings are U.S. stocks priced in USD, exposing you to USD/CAD exchange rate fluctuations.
- If the CAD weakens, VFV’s value in CAD rises, potentially boosting returns even if the U.S. market is flat.
- If the CAD strengthens, VFV’s value in CAD may decline, reducing returns despite stable S&P 500 performance.
- When the USD appreciates, VFV often outperforms hedged ETFs.
VFV exposes you to USD/CAD exchange rate risk, which can either enhance or reduce returns.
Currency Hedging
VOO is traded in USD on the NYSE, directly exposing you to USD assets. Your returns depend on USD/CAD exchange rate movements.
- When the USD appreciates, converting VOO’s returns to CAD increases your gains.
- When the CAD appreciates, your returns in CAD may decrease.
- For those avoiding currency risk, hedged ETFs are an option, but their higher fees may reduce long-term returns.
Most long-term investors accept some currency fluctuations when holding VFV or VOO. Diversifying investments or using dollar-cost averaging can mitigate the impact of exchange rate volatility.
Performance
Long-Term Returns
Long-term returns are a critical factor when choosing an S&P 500 ETF. Both VFV and VOO closely track the S&P 500 Index, which has historically delivered an annualized return of about 10% over the past decade. The table below compares their five-year annualized returns (in USD):
| ETF | 5-Year Annualized Return (USD) |
|---|---|
| VOO | 16.72% |
| VFV | 16.31% |
VOO’s lower fees result in slightly higher long-term returns compared to VFV. Investing in VOO on the U.S. market maximizes your gains. VFV’s returns, while in CAD, are influenced by USD/CAD exchange rates. For long-term growth, prioritize ETFs with low fees and minimal tracking error.
Tip: Review an ETF’s historical net asset value (NAV) to assess its long-term stability.
Dividend Reinvestment
Both VFV and VOO pay quarterly dividends, which you can reinvest to enhance returns through compounding. Enabling Dividend Reinvestment Plans (DRIP) automatically purchases additional shares with dividends, increasing your holdings over time.
In the U.S. market, VOO’s DRIP can be set up through your broker. In Canada, VFV also supports DRIP. Benefits of dividend reinvestment include:
- Increasing share holdings, boosting future dividends and capital gains
- Leveraging market fluctuations to buy more shares at lower prices
- Compounding for significant long-term return growth
For maximum long-term gains, enable DRIP. Contact your broker or a licensed Hong Kong bank for setup details. DRIP is ideal for long-term wealth accumulation.
Investment Recommendations
Canadian Investors
As a Canadian investor, consider local market convenience and tax policies when choosing an S&P 500 ETF. VFV, traded in CAD on the TSX, simplifies transactions without requiring currency conversion. Buying VFV through a Canadian broker is straightforward, ideal for those prioritizing ease of access.
The Canada-U.S. tax treaty offers tax benefits for certain accounts. The table below outlines tax differences:
| Factor | Description |
|---|---|
| Tax Exemption | Canada-U.S. tax treaty exempts certain accounts from 15% U.S. dividend withholding tax. |
| Investment Choice | Impacts Canadian investors’ decisions between VFV (Canadian ETF) and VOO (U.S. ETF). |
Holding VOO in an RRSP avoids the 15% U.S. dividend withholding tax, maximizing returns. In TFSA or RESP accounts, both VFV and VOO incur the 15% tax. In taxable accounts, you can offset some of VOO’s withholding tax via a foreign tax credit. Align your ETF and account choices with your tax needs.
Long-Term Investors
For long-term investors, prioritize low management fees, minimal tracking error, and dividend reinvestment. VOO’s 0.03% expense ratio saves significant costs over time, compounding through reinvested savings. Both ETFs support DRIP, allowing automatic reinvestment of dividends to boost long-term wealth.
Monitor currency fluctuations, as they impact returns. VFV’s CAD pricing introduces USD/CAD exchange rate risk, while VOO’s USD pricing requires currency conversion. Dollar-cost averaging can reduce the impact of exchange rate volatility.
Tip: Periodically review your portfolio to ensure alignment with your long-term goals.
Tax Optimizers
For tax-conscious investors, focus on ETF tax structures and account types. VOO in an RRSP avoids the 15% U.S. dividend withholding tax, maximizing dividend income. In TFSA or RESP accounts, both ETFs incur the 15% tax. In taxable accounts, use foreign tax credits to offset some of VOO’s withholding tax.
Track transaction records and dividend statements for accurate tax reporting. Plan sale timing to minimize capital gains taxes. Consult a professional or a licensed Hong Kong bank for personalized tax advice to enhance investment efficiency.
For maximum after-tax returns, prioritize VOO in an RRSP.
When choosing between VFV and VOO, consider your tax status, investment horizon, and currency preferences. VFV offers trading convenience for CAD-based investors. VOO provides lower fees and greater tax optimization potential. Evaluate liquidity, fees, and tax implications based on your needs. For personalized advice, consult a licensed Hong Kong bank’s professionals.
FAQ
Do VFV and VOO have the same dividend frequency?
Yes, both VFV and VOO pay dividends quarterly. You receive dividends every three months and can opt for automatic reinvestment.
Can I buy VOO directly with CAD?
No, you cannot buy VOO directly with CAD. You must convert CAD to USD to trade VOO on the U.S. market.
Do VFV and VOO have different risks?
Both VFV and VOO face similar market risks, tracking the same index. However, VFV introduces USD/CAD exchange rate risk.
Can I buy these ETFs through a licensed Hong Kong bank?
Yes, you can buy VOO through a licensed Hong Kong bank’s international investment account. For VFV, confirm if the bank supports TSX trading.
Which is better for long-term holding, VFV or VOO?
VOO is better for low fees and tax optimization, especially in an RRSP. VFV is simpler for CAD-based trading.
With a deep dive into VFV versus VOO, you’re equipped to choose based on fees, liquidity, taxes, and currency risks, yet high cross-border fees, exchange rate volatility, and offshore account complexities can hinder seizing U.S. market gains, especially during volatile swings. Picture a platform with 0.5% remittance fees, same-day global transfers, and zero-fee contract limit orders, enabling seamless VFV or VOO allocations via one account?
BiyaPay is tailored for S&P 500 investors, offering instant fiat-to-digital conversions to match market rhythms. With real-time exchange rate query, track USD trends and remit at optimal moments to trim costs. Spanning most regions with instant arrivals, it powers quick executions of VOO’s low-fee strategies or VFV’s CAD convenience. Standout: trade U.S. and Hong Kong stocks through a single account, leveraging zero-fee contract limit orders for P/E or dividend reinvestment-based limit strategies.
Whether prioritizing VOO’s tax efficiency or VFV’s trading ease, BiyaPay empowers your portfolio. Sign up now, visit stocks for S&P 500 prospects—quick setup unlocks cost-effective, compounding investing. Join global investors and optimize your ETF picks!
*This article is provided for general information purposes and does not constitute legal, tax or other professional advice from BiyaPay or its subsidiaries and its affiliates, and it is not intended as a substitute for obtaining advice from a financial advisor or any other professional.
We make no representations, warranties or warranties, express or implied, as to the accuracy, completeness or timeliness of the contents of this publication.


Contact Us
Company and Team
BiyaPay Products
Customer Services


is a broker-dealer registered with the U.S. Securities and Exchange Commission (SEC) (No.: 802-127417), member of the Financial Industry Regulatory Authority (FINRA) (CRD: 325027), member of the Securities Investor Protection Corporation (SIPC), and regulated by FINRA and SEC.
registered with the US Financial Crimes Enforcement Network (FinCEN), as a Money Services Business (MSB), registration number: 31000218637349, and regulated by FinCEN.
registered as Financial Service Provider (FSP number: FSP1007221) in New Zealand, and is a member of the Financial Dispute Resolution Scheme, a New Zealand independent dispute resolution service provider.