- EasyCard
- Trade
- Help
- Announcement
- Academy
- SWIFT Code
- Iban Number
- Referral
- Customer Service
- Blog
- Creator
Price-To-Earnings Ratio Explanation: How to use P/E to determine whether a stock is cheap or expensive?


Image Source: pexels
A high P/E ratio usually means that the stock price is relatively high, while a low P/E ratio may indicate that the stock is relatively cheap.
Understanding the P/E ratio helps investors initially assess valuation levels, but many mistakenly believe that the P/E ratio is the only standard, ignoring factors like earnings growth and capital efficiency.
In practice, the P/E ratio is just a reference tool and should not be the sole basis for investment decisions.
Key Points
- The P/E ratio is the ratio of a stock’s price to its earnings per share, helping investors initially assess the stock’s valuation level.
- A high P/E ratio typically indicates high market expectations for the company’s future growth, while a low P/E ratio may suggest the company is undervalued or facing risks.
- The P/E ratio should be analyzed in the context of industry and historical data to avoid misjudgments from cross-industry comparisons.
- The P/E ratio is only the starting point for valuation analysis; investors should combine it with other financial metrics and the company’s growth potential for multidimensional analysis.
- Understand the limitations of the P/E ratio to avoid investment decisions influenced by short-term fluctuations or one-time events.
Understanding the P/E Ratio and Its Basic Meaning

Image Source: pexels
Judging High or Low P/E Ratios
Understanding the P/E ratio begins with grasping its essence.The P/E ratio is the relationship between a company’s stock price and its earnings per share (EPS).
Investors can use the P/E ratio to initially assess a stock’s valuation level.
- A high P/E ratio usually means the market has high expectations for the company’s future growth, with investors willing to pay a higher price for each dollar of current earnings.
- A low P/E ratio may indicate that the market lacks confidence in the company’s future growth or that the company is undervalued.
- Understanding the P/E ratio also requires considering the industry context. Analysts typically compare a company’s P/E ratio to the industry average. For example, the average P/E ratio in the U.S. tech industry is consistently higher than in traditional manufacturing.
- Historical data is also valuable for reference. In the U.S. market, the average P/E ratio for the S&P 500 from 1870 to 2021 was about 15.97, rising to 25.81 from 1996 to 2021.
The table below shows the average P/E ratios for the U.S. market over different periods:
| Period | Average P/E Ratio |
|---|---|
| 1870 - 2021 | 15.97x |
| 1970 - 2021 | 19.79x |
| 1996 - 2021 | 25.81x |
| September 2021 | 25x |
- Understanding the P/E ratio also requires attention to market conditions. Macro factors like interest rates and economic cycles affect reasonable P/E levels across industries.
Tip: Judging whether a P/E ratio is high or low cannot be separated from industry, historical data, and market conditions. Simply comparing P/E ratios across different companies can easily lead to misjudgments.
Role of the P/E Ratio
As a valuation tool, the P/E ratio holds an important place in fundamental analysis.
- Understanding the P/E ratio shows that it measures the relationship between stock price and a company’s profitability.
- Investors can use the P/E ratio to assess whether a stock is “cheap” or “expensive” relative to its peers.
- The P/E ratio also helps investors screen potential investment targets. For example, a company with a P/E ratio significantly below the industry average may represent an undervaluation opportunity, but it could also reflect operational challenges.
- In practice, the P/E ratio is often used alongside other metrics (such as P/B or PEG) to obtain a more comprehensive valuation judgment.
Understanding the P/E ratio also requires recognizing its limitations. - The P/E ratio focuses only on current earnings and does not reflect future growth potential.
- P/E ratios vary significantly across industries, making cross-industry comparisons less meaningful.
- Company earnings may be influenced by accounting policies, leading to distorted P/E ratios.
- Companies with high debt, even with low P/E ratios, may carry financial risks.
Note: The P/E ratio is only the starting point for valuation analysis and should not be the sole basis for decisions. Investors should combine industry characteristics, company growth potential, and other financial metrics for multidimensional analysis.
Definition and Calculation

Image Source: pexels
P/E Ratio Formula
The P/E ratio is a key metric for assessing stock valuation.
Understanding the P/E ratio helps investors better grasp the relationship between stock price and company earnings.
The standard P/E ratio formula is as follows:
P/E Ratio = Current Stock Price ÷ Earnings Per Share (EPS)
Earnings per share (EPS) is calculated by subtracting dividends from net income and dividing by the number of shares outstanding.
The table below shows the main components of the P/E ratio calculation:
| Component | Description |
|---|---|
| P/E Ratio | The ratio of the current stock price to earnings per share (EPS) |
| Current Stock Price | The company’s current market stock price (in USD) |
| Earnings Per Share (EPS) | The company’s net income per share, calculated as (Net Income - Dividends) / Shares Outstanding |
Investors can follow these steps to calculate the P/E ratio:
- Find the company’s current stock price (e.g., for U.S.-listed companies, priced in USD).
- Calculate EPS: (Net Income - Dividends) / Shares Outstanding.
- Divide the current stock price by EPS to obtain the P/E ratio.
Calculation Considerations
Calculating the P/E ratio seems simple, but practical errors are common.
Common mistakes by investors include:
- Unadjusted P/E Ratio: Directly dividing price by actual per-share net income, without adjusting for exceptional items, which may distort results.
- Forward P/E Ratio Based on Standardized Earnings: Using analysts’ forecasted future earnings, which is closer to reality but still requires validation with other metrics.
- Ignoring Dividend Payout Ratios: Some investors focus only on the P/E ratio without considering the company’s dividend policy, affecting valuation accuracy.
- Directly Comparing Price to Intrinsic Value: Some use the P/V ratio, which is intuitive but requires cautious interpretation.
Tip: Understanding the P/E ratio involves not only the formula but also combining details from financial reports, industry characteristics, and market conditions to avoid misjudgments due to improper calculation methods.
Types and Differences
Trailing P/E Ratio
The trailing P/E ratio is the most common type.
Analysts typically use the previous year’s earnings per share (EPS) as the denominator and the current stock price as the numerator.
The trailing P/E ratio reflects the company’s past profitability and is suitable for assessing companies with stable performance and minimal earnings fluctuations.
Trailing P/E (P/E LYR) uses the previous year’s earnings, is simple to calculate, and facilitates cross-sectional comparisons.
In the U.S. market, investors often use the trailing P/E to compare valuation levels of companies within the same industry. For example, if a tech company had an EPS of $2.5 in 2023 and its current stock price is $50, its trailing P/E is 20x.
The limitation of the trailing P/E is that it cannot reflect future performance changes and is susceptible to one-time gains or losses.
Forward P/E Ratio
The forward P/E ratio, also known as the leading P/E ratio, emphasizes expectations for future earnings.
- The forward P/E ratio is calculated by dividing the current stock price by the expected EPS for the next 12 months, as forecasted by market analysts or company management.
- It is most useful for assessing a company’s future growth potential and comparing the potential of similar companies.
The forward P/E is suitable for growth-oriented companies or those with significant earnings fluctuations.
In the U.S., investors analyzing the tech industry often use the forward P/E to assess whether a company’s future valuation is reasonable.
The forward P/E better reflects market confidence in a company’s future development but relies on forecasts that may carry uncertainty.
P/E TTM
The P/E TTM (trailing twelve months P/E) combines historical and recent data.
- P/E TTM is calculated by dividing the stock price by the EPS over the past twelve months.
- The trailing P/E uses the previous year’s earnings.
- The forward P/E uses expected future earnings.
P/E TTM is widely used in the U.S. market, especially for companies with seasonal earnings fluctuations.
Investors use P/E TTM to reflect the company’s latest profitability more promptly, avoiding errors from single-year data.
The table below compares the three P/E types:
| Type | Calculation Basis | Applicable Scenarios |
|---|---|---|
| Trailing P/E | Previous Year’s EPS | Stable performance companies |
| Forward P/E | Next 12 Months’ Expected EPS | Growth-oriented or volatile companies |
| P/E TTM | Past 12 Months’ Actual EPS | Seasonal or recent performance evaluation |
Investors should select the appropriate P/E type based on the company’s characteristics and industry conditions, combining multidimensional data for comprehensive judgment.
Practical Methods
Industry Comparison
P/E ratios vary significantly across industries.Investors cannot simply compare one company’s P/E ratio with that of another in a different industry.The profitability models and growth rates of industries like technology, finance, and consumer goods differ, leading to varied reasonable P/E ranges.
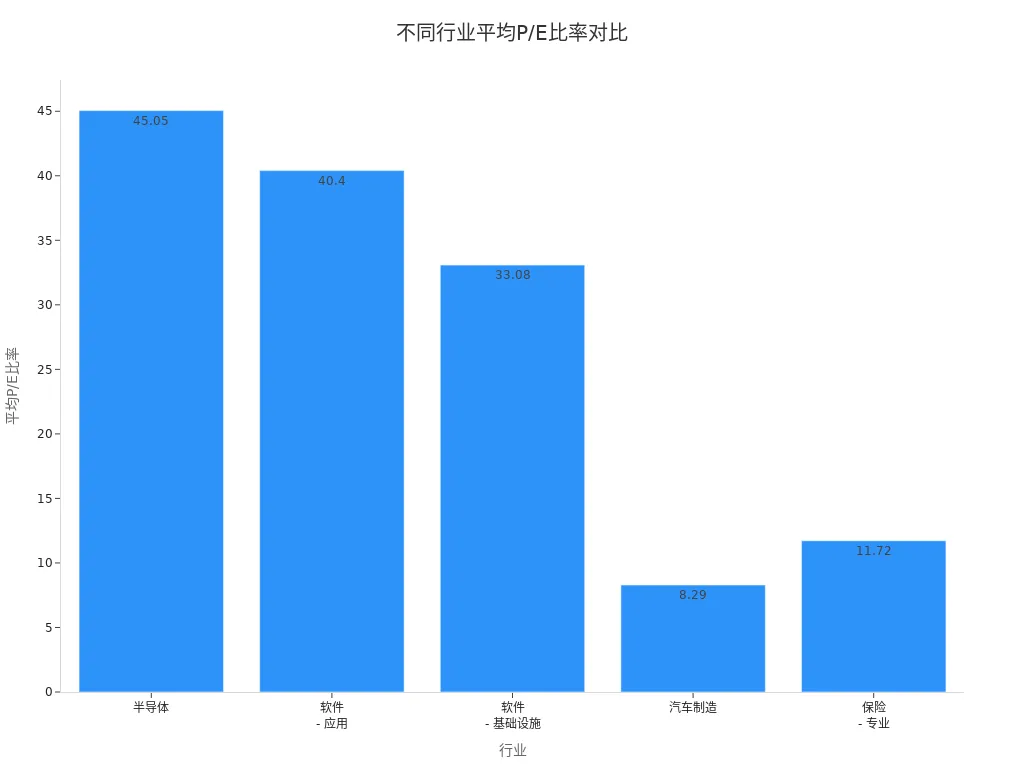
For example, the semiconductor and software industries typically have higher P/E ratios due to market expectations of future growth.In contrast, industries like automotive manufacturing and insurance have relatively lower P/E ratios, reflecting slower growth or higher earnings stability.
The table below shows the average P/E ratios for select U.S. industries as of September 2025:
| Industry | Average P/E Ratio |
|---|---|
| Semiconductors | 45.05 |
| Software - Application | 40.4 |
| Software - Infrastructure | 33.08 |
| Automotive Manufacturing | 8.29 |
| Insurance - Specialty | 11.72 |
Investors analyzing a U.S.-listed company’s valuation should prioritize comparing its P/E ratio to the industry average.For example, a semiconductor company with a P/E of 50 may seem high compared to the market average but is reasonable relative to the industry’s 45.05 average.Conversely, an automotive company with a P/E above 15 may indicate market expectations of unique profitability or potential overvaluation risks.
Additionally, P/E ratios in some industries fluctuate significantly.The table below compares current, trailing, and forward P/E ratios for major U.S. industries:
| Industry Name | Current P/E | Trailing P/E | Forward P/E |
|---|---|---|---|
| Advertising | 514.37 | 291.27 | 73.71 |
| Aerospace/Defense | 39.16 | 87.42 | 35.07 |
| Auto & Truck | 31.42 | 27.28 | 29.80 |
| Banks (Large) | 20.06 | 28.04 | 14.03 |
| Beverage (Soft) | 34.72 | 25.67 | 24.69 |
| Chemical (Basic) | 15.75 | 25.81 | 14.53 |
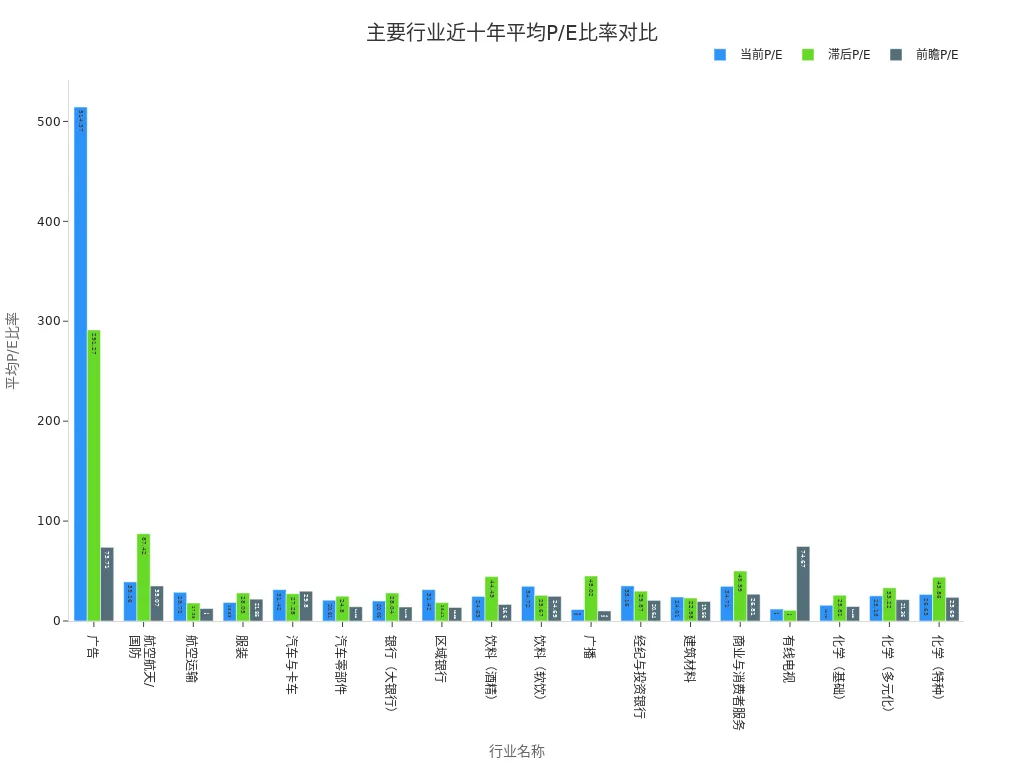
Tip: Understanding the P/E ratio emphasizes that industry comparison is the foundation for judging stock valuation. Investors should avoid direct cross-industry P/E comparisons and prioritize the industry’s historical and current context.
Historical Percentiles
Beyond industry comparisons, historical percentiles are a key tool for judging P/E levels.
Investors can assess whether a stock is overvalued or undervalued by comparing its current P/E ratio to its historical average.
The CAPE ratio (Cyclically Adjusted Price-to-Earnings) is a commonly used method for historical percentile analysis.
The CAPE ratio compares current market prices to the average inflation-adjusted earnings over the past ten years, helping investors identify long-term market valuation levels.
- A high CAPE ratio typically indicates lower expected future returns, suggesting potential overvaluation.
- A low CAPE ratio may indicate undervaluation, with higher expected future returns.
- By comparing the current P/E ratio to historical percentiles, investors can make more rational buy or sell decisions.
For example, the S&P 500’s CAPE ratio surged during the dot-com bubble and later corrected.
If a U.S.-listed company’s P/E ratio significantly exceeds its historical percentiles, investors should be cautious of valuation bubbles.
Note: Historical percentile analysis should account for industry cycles and macroeconomic conditions to avoid misjudgments due to short-term fluctuations.
Earnings Growth Expectations
The P/E ratio reflects not only current earnings but also market expectations for future earnings growth.
Investors are often willing to pay a higher P/E for companies with stronger expected growth.
An increase in the P/E ratio often indicates market confidence in the company’s future earnings growth.
- When the market expects rapid future earnings growth, the P/E ratio rises accordingly.
- Changes in the P/E ratio, combined with actual earnings changes, impact investment returns.
- Factors driving P/E changes include industry outlook, company innovation, and management strategies.
For example, a U.S. software company launching a new product may prompt market expectations of sustained earnings growth over the next three years, leading investors to accept a P/E of 40 or higher.
Conversely, if the market expects limited earnings growth for an automotive manufacturer, even a P/E below 10 may not be attractive.
Tip: When analyzing the P/E ratio, investors should consider earnings growth expectations and avoid judging a stock as cheap solely based on a low P/E. High-growth companies may still be valuable despite higher P/E ratios.
Other Metrics
Price-to-Book Ratio (P/B)
The price-to-book ratio (P/B ratio) is a commonly used valuation tool for investors.It compares the market’s valuation of a company to its book value as recorded in accounting.
- Investors can use the P/B ratio to assess whether a stock is overvalued or undervalued.
- Combining the P/B ratio with the P/E ratio provides context on earnings quality, aiding more comprehensive analysis.
- In the U.S. market, industries like banking and insurance often use the P/B ratio for cross-sectional comparisons. For example, a licensed Hong Kong bank with a P/B of 1.2 indicates a market price slightly above its book value.
The P/B ratio is suitable for evaluating companies with clear asset structures and reliable book values. For tech and other asset-light industries, the P/B ratio has limited reference value.
PEG Ratio
The PEG ratio (Price-to-Earnings-to-Growth ratio) offers investors a more dynamic valuation perspective.
- Investors calculate the PEG ratio by dividing the company’s P/E ratio by its expected earnings growth rate.
- This adjustment allows investors to evaluate whether a stock is overvalued or undervalued, considering its growth prospects.
- The PEG ratio’s advantage is its ability to compare companies with different growth rates and identify stocks that may appear expensive based on P/E but are undervalued relative to growth.
For example, a U.S. software company with a P/E of 40 and an expected three-year annual growth rate of 20% has a PEG of 2. Investors use this to assess valuation reasonableness.
A PEG close to 1 is generally considered reasonable. A PEG above 1 may indicate overvaluation, while below 1 may suggest undervaluation, though industry context is key.
Comprehensive Analysis
No single metric fully reflects a company’s value.Investors typically combine multiple financial ratios (e.g., P/E, PEG, and P/B) to evaluate stock performance from different angles.
- Combining these ratios provides a more comprehensive understanding of a company’s financial health and market valuation.
- Understanding each ratio’s components helps reveal a company’s performance, sustainability, and risks.
- The P/E ratio can be compared to market benchmarks (e.g., S&P 500) to judge valuation levels.
- The PEG ratio integrates P/E with expected EPS growth, offering insight into future growth prospects.
| Metric | Focus | Applicable Scenarios |
|---|---|---|
| P/E | Profitability | Stable or growth-oriented companies |
| P/B | Asset Value | Asset-intensive industries like banking, insurance |
| PEG | Growth-Valuation Balance | High-growth or volatile companies |
Investors should flexibly combine multiple metrics based on company type, industry characteristics, and market conditions to avoid misjudgments from a single perspective.
Limitations and Misconceptions
Earnings Volatility
The P/E ratio heavily relies on earnings per share (EPS), and company earnings are often volatile.
- A company’s earnings may fluctuate significantly across quarters or years, leading to abnormally high or low P/E ratios.
- One-time events, such as asset sales, tax adjustments, or legal settlements, may significantly increase or decrease earnings in a period, distorting the P/E ratio’s reference value.
For example, Intercontinental Exchange Inc. (ICE) had inflated GAAP earnings due to one-time tax benefits and other exceptional items, distorting its P/E ratio.
Colgate-Palmolive (CL) reported reduced earnings due to tax reforms and restructuring costs, resulting in an above-average P/E ratio.
| Company Name | P/E Ratio | Cause of Distortion |
|---|---|---|
| Intercontinental Exchange Inc. (ICE) | 18 | One-time tax benefits and exceptional items |
| Colgate-Palmolive (CL) | 25 | Reduced earnings from tax reforms and restructuring costs |
Investors analyzing the P/E ratio should examine one-time items in financial reports to avoid being misled by short-term earnings fluctuations.
Industry Differences
The reasonable range for P/E ratios varies by industry.
- When investors expect industry growth, P/E ratios typically rise.
- When industry prospects are positive, investors are willing to pay higher prices for companies in that sector, driving up P/E ratios.
- During poor economic or industry outlooks, P/E ratios decline.
For example, the U.S. tech industry commands higher P/E ratios due to strong growth expectations, unlike traditional manufacturing.Cyclical industries like energy and automotive see significant P/E fluctuations influenced by economic cycles, with notable differences between boom and bust periods.
Investors should avoid directly comparing P/E ratios across industries and prioritize the historical and current context of the same industry.
Low P/E Trap
A low P/E ratio does not always mean a stock is undervalued.
- Some low P/E stocks may reflect a higher probability of financial distress.
- Structural or cyclical issues may increase uncertainty in future earnings.
- During economic downturns, the risks of value stocks may rise, and investors should beware of “value traps.”
Historically, some U.S. department store chains maintained low P/E ratios due to consecutive quarters of declining same-store sales, high debt, weak online presence, low brand loyalty, and frequent management changes, but their fundamentals continued to deteriorate, leading to investor losses.
Investors should combine company fundamentals, industry trends, and financial health to guard against risks hidden behind low P/E ratios.
High P/E Misjudgments
High P/E ratios are often mistaken for overvaluation, but the reality is more complex.
- Earnings Quality: Companies may manipulate EPS through accounting adjustments, distorting P/E ratios. Investors must assess earnings sustainability.
- Industry Differences: High-growth industries like software and semiconductors naturally have higher P/E ratios than traditional sectors, and high P/E does not necessarily mean overvaluation.
- Cyclical Impacts: Cyclical industries may have high P/E ratios during downturns and lower ones during booms.
- One-Time Events: Mergers, acquisitions, or legal settlements can distort P/E ratios.
- Growth Prospects: High-growth companies have higher P/E ratios due to strong future earnings expectations.
- Market Sentiment: Market bubbles or pessimism can influence P/E levels.
Investors interpreting high P/E ratios should consider industry characteristics, company growth potential, and market conditions to avoid one-sided judgments based on a single metric.
The P/E ratio provides investors with a tool to initially assess stock valuation.Investors should combine industry characteristics, company growth potential, and other financial metrics when analyzing.Investors need to pay attention to market expectations for company growth while understanding financial health and growth potential.
The P/E ratio is influenced by market fluctuations, macroeconomic factors, and accounting standards, and the accuracy of financial statements is critical.Rational investment decisions require multidimensional analysis to avoid being misled by a single metric.
FAQ
What does a negative P/E ratio mean?
A negative P/E ratio indicates that the company is in a loss-making state.
Investors cannot use the P/E ratio to judge valuation in this case and should combine other financial metrics to analyze the company’s fundamentals.
Is a lower P/E ratio always better?
A low P/E ratio does not necessarily mean a stock is cheap.
The company may face operational challenges or poor industry prospects.
Investors should combine profitability and industry conditions for a comprehensive judgment.
How to choose the appropriate P/E ratio type?
The trailing P/E is suitable for companies with stable earnings.
The forward P/E is suitable for growth-oriented companies.
P/E TTM is suitable for companies with significant seasonal fluctuations.
Investors should choose based on the company’s characteristics.
Can the P/E ratio predict future stock prices?
The P/E ratio reflects market expectations but cannot directly predict future stock prices.
Investors need to combine earnings growth, industry trends, and multidimensional analysis.
Why do banks typically have lower P/E ratios?
Banks have stable earnings but limited growth rates.
The market has conservative expectations for their future, leading to lower P/E ratios compared to high-growth industries like technology.
With a comprehensive VFV vs VOO comparison, you’re equipped to choose based on fees, liquidity, and taxes, but high cross-border fees, currency volatility, and offshore account complexities can hinder U.S. market allocations, especially for swift responses to earnings or swings. Imagine a platform with 0.5% remittance fees, same-day global transfers, and contract limit orders with zero fees, enabling seamless ETF trading via one account?
BiyaPay is tailored for S&P 500 investors, offering instant fiat-to-digital conversions to match market rhythms. With real-time exchange rate query, monitor USD trends and transfer at optimal moments to cut costs. Covering most regions with instant arrivals, it powers rapid allocations to S&P 500 ETFs (like VOO) or small-caps. Crucially, trade U.S. and Hong Kong markets through a single account, leveraging contract limit orders with zero fees for valuation-driven limit strategies.
Whether chasing long-term growth or diversifying risks, BiyaPay empowers your portfolio. Sign up now, visit stocks for U.S. prospects—quick setup unlocks cost-effective, data-driven trading. Join global investors and thrive in 2025 markets!
*This article is provided for general information purposes and does not constitute legal, tax or other professional advice from BiyaPay or its subsidiaries and its affiliates, and it is not intended as a substitute for obtaining advice from a financial advisor or any other professional.
We make no representations, warranties or warranties, express or implied, as to the accuracy, completeness or timeliness of the contents of this publication.


Contact Us
Company and Team
BiyaPay Products
Customer Services


is a broker-dealer registered with the U.S. Securities and Exchange Commission (SEC) (No.: 802-127417), member of the Financial Industry Regulatory Authority (FINRA) (CRD: 325027), member of the Securities Investor Protection Corporation (SIPC), and regulated by FINRA and SEC.
registered with the US Financial Crimes Enforcement Network (FinCEN), as a Money Services Business (MSB), registration number: 31000218637349, and regulated by FinCEN.
registered as Financial Service Provider (FSP number: FSP1007221) in New Zealand, and is a member of the Financial Dispute Resolution Scheme, a New Zealand independent dispute resolution service provider.