- EasyCard
- Trade
- Help
- Announcement
- Academy
- SWIFT Code
- Iban Number
- Referral
- Customer Service
- Blog
- Creator
VOO vs. VTI Investment Guide: How to Choose the Right ETF for You?


Image Source: pexels
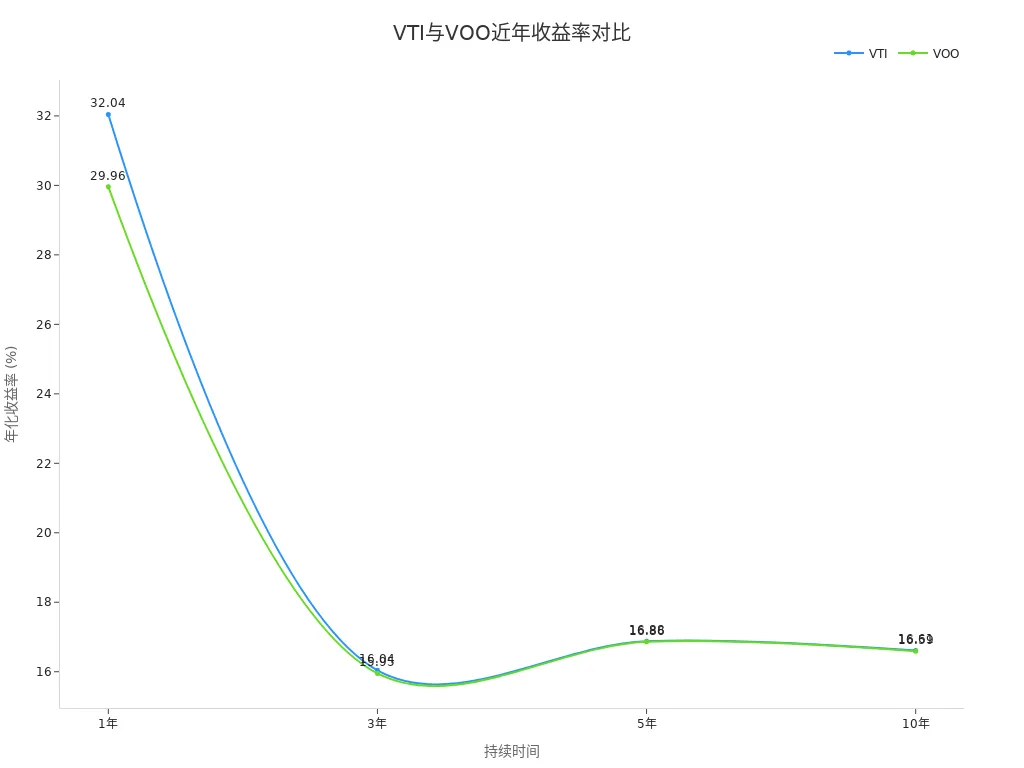
When choosing an ETF, you may find yourself torn between VOO and VTI. VOO focuses on the S&P 500 index, emphasizing stability and dividend income, making it suitable for investors seeking lower volatility. VTI covers the entire U.S. market, offering broader growth opportunities, ideal for those looking to diversify risk. You should pay attention to key metrics such as expense ratios, investment scope, and historical performance. The table below shows their recent returns and risk ratings, helping you make an informed decision based on this investment guide.
| Duration | VTI | VOO |
|---|---|---|
| 1 Year | 21.48% | 21.35% |
| 3 Years | 19.48% | 20.09% |
| 5 Years | 14.66% | 15.24% |
| 10 Years | 13.98% | 14.63% |
| ETF | Risk (Out of 5) |
|---|---|
| VTI | 4 |
| VOO | 4 |
Key Highlights
- VOO focuses on the S&P 500 index, suitable for investors seeking stability and dividend income.
- VTI covers the entire U.S. market, ideal for those wanting to diversify risk and capture growth opportunities.
- The two ETFs have an 86% asset overlap, so consider your investment goals and risk tolerance when choosing.
- Low expense ratios make VOO and VTI cost-effective for long-term holding, preserving more returns.
- Dollar-cost averaging (DCA) can help reduce the impact of market volatility, suitable for risk-averse investors.
VOO vs VTI Investment Guide

Image Source: pexels
Core Differences
When choosing an ETF, you first need to understand the structural differences between VOO and VTI. VOO focuses on large U.S. companies, tracking the S&P 500 index. VTI covers the entire U.S. stock market, including large, mid, and small-cap companies. The table below helps you compare their investment objectives and number of holdings:
| ETF | Investment Objective | Number of Holdings |
|---|---|---|
| VOO | Tracks the S&P 500 index, focusing on large U.S. stocks | ~504 |
| VTI | Tracks the CRSP US Total Market Index, including small, mid, and large U.S. stocks | ~3,655 |
You can see that VTI has a broader scope, holding far more stocks than VOO. This means VTI can capture more market growth opportunities, especially from mid and small-cap companies. VOO, on the other hand, emphasizes stability and the performance of established firms, making it suitable for investors seeking steady dividend income.
You also need to note their asset overlap. VOO and VTI have an 86% overlap, meaning their portfolios are largely similar. VTI allocates 14% of its assets to mid and small-cap stocks not in the S&P 500, providing additional diversification. While VTI offers broader market exposure, the high overlap means the overall return difference between the two is minimal.
- VOO and VTI have an 86% portfolio overlap, with largely similar holdings.
- VTI’s 14% allocation to mid and small-cap stocks adds extra diversification.
- The overall returns of the two funds are expected to be very close.
You can further compare their market coverage with the table below:
| ETF | Tracking Index | Market Coverage |
|---|---|---|
| VOO | S&P 500 Index | Large-cap stocks only |
| VTI | CRSP US Total Market Index | Entire U.S. stock market, including all segments |
VOO is better suited for investors focused on the performance of large U.S. companies. VTI allows you to participate in the growth of the entire U.S. market, including emerging and smaller firms.
Selection Advice
When developing your investment strategy, choose the ETF that aligns with your investment goals, risk tolerance, and financial situation. This investment guide suggests the following considerations:
- If you prioritize volatility resistance and stable dividend income, VOO is the better choice. It focuses on the 500 most representative U.S. large-cap companies, which typically have stable performance and higher dividends.
- If you aim to capture the overall growth of the U.S. market and are willing to accept slightly higher volatility, VTI is more suitable. It covers companies of all sizes, allowing you to benefit from the broader market’s upside.
- If you have limited capital, VTI’s unit price is generally lower than VOO’s, making it more suitable for small-scale diversified investing. You can participate in the growth of more companies with less capital.
- If you already hold VOO, be mindful of asset overlap when adding VTI to avoid redundant investments. The investment guide suggests allocating proportions based on your portfolio goals.
The investment guide reminds you: When choosing an ETF, don’t just look at historical returns. Combine your risk tolerance and investment horizon, and periodically review your portfolio to maintain a balanced asset allocation.
In practice, first clarify your investment goals, then use the suggestions in this investment guide to select the most suitable ETF. This way, you can better seize U.S. market growth opportunities while managing risk to achieve long-term wealth growth.
Basic Information
VOO Overview
When learning about VOO, know that it is an ETF tracking the S&P 500 index. VOO invests primarily in the 500 largest U.S. companies across industries like technology, finance, and healthcare. By holding VOO, you indirectly own shares in well-known companies like Apple, Microsoft, and Amazon. VOO is characterized by strong stability, making it suitable for investors seeking long-term, steady returns. If you value dividends and volatility resistance, VOO is a recommended choice in this investment guide.
VTI Overview
If you want to participate in the growth of the entire U.S. stock market, consider VTI. VTI tracks the CRSP US Total Market Index, with a scope far beyond VOO. It includes not only large-cap but also mid and small-cap companies. By investing in VTI, you can gain exposure to over 3,600 U.S. companies, benefiting from the market’s overall growth. VTI is ideal for investors seeking to diversify risk and capture broader growth opportunities. This investment guide highlights VTI as a versatile option for portfolio diversification.
Investment Scope
When choosing an ETF, the investment scope is a critical factor. VOO covers only the 500 largest U.S. companies, focusing on large-cap stocks. VTI encompasses the entire U.S. stock market, including large, mid, and small-cap companies, with a far greater number of holdings than VOO. The table below compares their market coverage:
| Metric | VOO | VTI |
|---|---|---|
| Number of Stocks | 504 | 3,655 |
| Market Coverage | Limited to 500 largest companies | Entire U.S. stock market, including large, mid, and small-cap stocks |
If you want broader exposure to diversify risk, VTI is more suitable. If you prioritize stability and the performance of leading companies, VOO is the better choice. This investment guide advises combining your needs with a balanced ETF allocation to enhance portfolio diversity and resilience.
Key Comparisons

Image Source: pexels
Expense Ratios
When selecting an ETF, the expense ratio is a key consideration. Both VOO and VTI have very low expense ratios, typically between 0.03% and 0.04%. This allows you to hold these funds long-term at a low cost, retaining more of your returns. The investment guide recommends prioritizing ETFs with low expense ratios to minimize long-term cost pressures.
Historical Performance
When focusing on historical performance, refer to the table below. Both VOO and VTI have performed strongly over the past 10 years, with annualized returns around 14%. VOO slightly outperforms VTI, but the gap is small. Both ETFs can deliver stable long-term returns.
| Investment Product | 5-Year Annualized Return | 10-Year Annualized Return | Inception Return |
|---|---|---|---|
| VOO | 15.24% | 14.63% | 14.47% |
| VTI | 14.66% | 13.98% | 9.21% |
If you seek long-term growth, both VOO and VTI are worth considering. VOO suits investors focused on large-cap companies, while VTI is ideal for those wanting to diversify risk and capture broader market growth.
Liquidity
When investing in ETFs, liquidity determines ease of buying and selling. Both VOO and VTI have high trading volumes, making them easy to trade. You can buy or sell these ETFs in the U.S. market at any time. High liquidity allows you to adjust your portfolio flexibly and reduce trading costs.
You can also refer to volatility and maximum drawdown data:
| Ticker | Name | Standard Deviation | Maximum Drawdown |
|---|---|---|---|
| VTI | Vanguard Total Stock Market ETF | 19.58% | -55.45% |
| VOO | Vanguard S&P 500 ETF | 18.69% | -33.99% |
VTI’s volatility and maximum drawdown are slightly higher than VOO’s. If you prioritize risk control, VTI’s broader market coverage can help diversify risk and mitigate the impact of single-sector declines.
- VTI tracks the CRSP US Total Market Index, covering over 3,600 stocks, including small and mid-cap companies.
- VOO tracks only the S&P 500 index, focusing on large-cap companies.
- VTI’s broad market coverage helps reduce risks from specific sector downturns.
Dividends and Taxes
When focusing on dividends, refer to the table below. VOO and VTI have nearly identical dividend yields, distributed quarterly. You can receive regular dividend income to boost your returns.
| ETF | Dividend Yield | Distribution Frequency | Last Ex-Dividend Date |
|---|---|---|---|
| VOO | 1.18% | Quarterly | June 30, 2025 |
| VTI | 1.17% | Quarterly | June 30, 2025 |
When investing in ETFs in the U.S. market, dividend income is subject to relevant taxes. You can purchase ETFs through a licensed Hong Kong bank account to access international markets conveniently. The investment guide suggests paying attention to tax policies and planning dividend income to enhance overall returns.
Investment Goals
Long-Term Growth
If you focus on long-term growth, prioritize the ETF’s historical returns and investment horizon. Both VOO and VTI offer stable long-term returns, but their annualized returns and inception dates differ. The table below provides a clear comparison:
| ETF | Annualized Return | Investment Horizon |
|---|---|---|
| VOO | 14.47% | Since September 7, 2010 |
| VTI | 9.21% | Since May 24, 2001 |
VOO’s higher annualized return makes it suitable for those seeking wealth growth through large-cap companies. VTI can also deliver long-term compounding benefits if you value overall market growth. Combine your investment horizon and goals to allocate funds appropriately.
Risk Diversification
If you aim to reduce investment risk, focus on the ETF’s diversification level. VTI’s broader coverage includes nearly 3,600 stocks, while VOO represents about 500 companies. By holding VTI, you can mitigate the impact of declines in individual industries or companies. Here are the diversification characteristics of VTI vs. VOO:
- VTI’s diversification level is higher than VOO’s, offering added security for risk-averse investors.
- VTI includes nearly 3,600 stocks, while VOO represents about 500 companies.
- Greater diversification may result in slightly lower long-term returns for VTI compared to VOO.
When building your portfolio, choose broader market coverage based on your risk tolerance. VTI suits those seeking to diversify risk and achieve steady growth.
Large-Cap vs. Total Market
When choosing an ETF, clarify whether you prefer large-cap or total market exposure. VOO focuses on large U.S. companies, ideal for those seeking stable returns from industry leaders. VTI covers the entire market, including small and mid-cap companies. Historical data shows that small and mid-cap stocks often have higher long-term returns, known as the size risk factor premium. VTI’s inclusion of these stocks contributes to its potential for outperformance over VOO.
If you have sufficient capital, prioritize VOO for stable growth from large-cap companies. If your capital is limited, VTI’s lower unit price makes it more suitable for small-scale diversified investing. Flexibly choose ETFs based on your financial situation and investment goals to optimize portfolio allocation.
Investment Strategies
Dollar-Cost Averaging (DCA)
You can opt for dollar-cost averaging (DCA), investing a fixed amount monthly or quarterly in VOO or VTI. This strategy suits risk-averse investors, helping you smooth out market volatility and avoid buying at market peaks. DCA allows you to buy more shares when prices are low, reducing your average cost over time. The table below compares the pros and cons of DCA and lump-sum investing:
| Investment Strategy | Pros | Cons |
|---|---|---|
| Lump-Sum (LS) | Typically performs better in most historical markets, maximizing wealth growth. | May incur larger losses in the worst market conditions. |
| Dollar-Cost Averaging (DCA) | More suitable for risk-averse investors, reducing the impact of market volatility. | May result in opportunity costs, underperforming lump-sum investing long-term. |
In practice, consider these points:
- In most historical market conditions, lump-sum investing typically yields higher wealth growth.
- DCA suits investors looking to reduce risk and avoid significant losses.
- Long-term DCA may involve some opportunity costs, with returns slightly lower than lump-sum investing.
Lump-Sum Investing
You can also choose lump-sum investing (LS), deploying all your capital into VOO or VTI at a single point. Historical data suggests this approach performs better in most market conditions, maximizing wealth growth. However, investing at a market peak may lead to significant losses during downturns. Make your choice based on your risk tolerance and financial situation. If you prioritize long-term returns and can tolerate short-term volatility, lump-sum investing is more suitable.
Account Setup and Operations
You can purchase VOO or VTI through various platforms, such as opening an account directly on Vanguard’s website or via a licensed Hong Kong bank’s U.S. stock brokerage account. The account setup process is straightforward, typically taking 10 minutes. Follow these steps:
- Choose an account type (e.g., general investment or retirement account).
- Complete the online application and submit required documents.
- Fund the account, with a minimum investment as low as $1.
- Once funds are available, go to the trading page, enter the ticker (VOO or VTI), and select the quantity or amount to purchase.
- Choose a market or limit order, confirm, and submit.
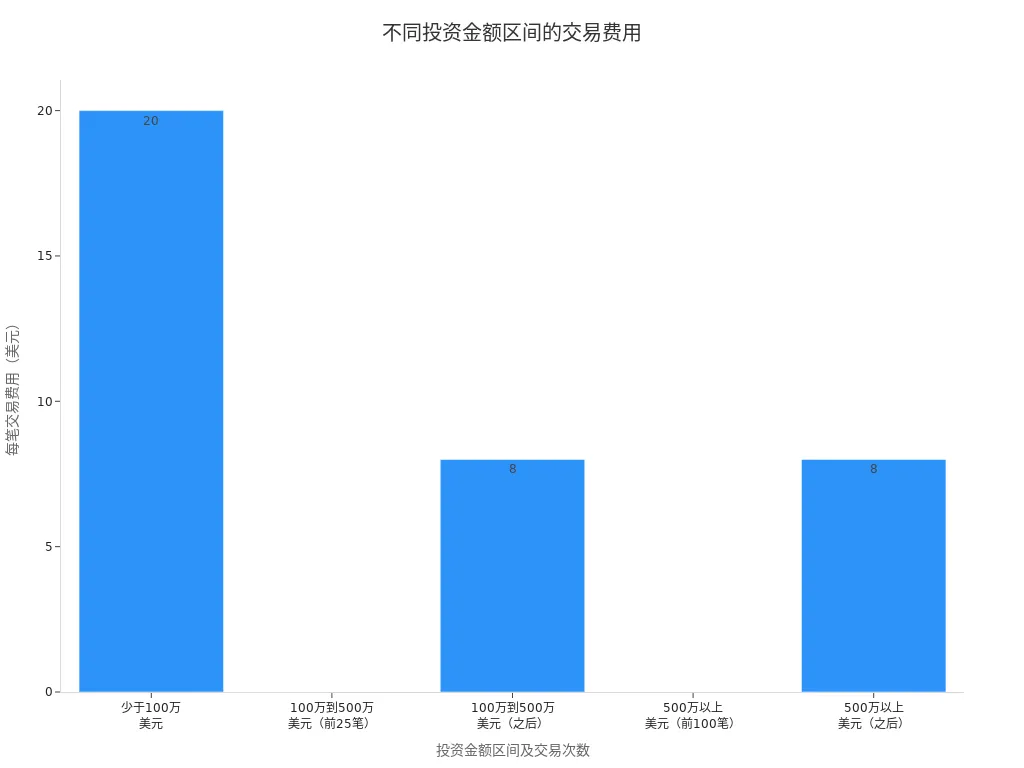
When trading, pay attention to transaction fees. The fee structure for major platforms is as follows:
| Investment Amount Range | Transaction Fees |
|---|---|
| Under $1 million | $20 per trade |
| $1 million to $5 million | First 25 trades free; $8 per trade thereafter |
| Over $5 million | First 100 trades free; $8 per trade thereafter |
During account setup and investing, consult platform customer service or refer to official guides if you have questions. Choosing the right investment strategy helps you better achieve your wealth goals.
When choosing VOO or VTI, align your decision with your investment goals and risk tolerance. The table below offers selection advice for different investor types:
| Investor Type | ETF Choice | Risk Tolerance | Investment Goal |
|---|---|---|---|
| Stability-focused | VOO | Lower | Stable growth |
| Wealth accumulation-focused | VTI | Higher | High growth potential |
- VTI suits those seeking diversified market exposure.
- VOO is better for those prioritizing large-cap stability.
- Make rational decisions based on your financial situation and investment goals.
Continuously monitor your portfolio dynamics, stick to long-term holding, and enhance wealth growth certainty.
FAQ
Can I invest in both VOO and VTI simultaneously?
Yes, you can invest in both VOO and VTI to further diversify risk. Be mindful of their high asset overlap and allocate proportions rationally to avoid redundant exposure.
Is there a minimum investment amount for VOO or VTI?
In the U.S. market, the minimum investment for VOO or VTI is typically $1. You can flexibly choose your investment amount based on your financial situation.
Is it safe to buy ETFs through a licensed Hong Kong bank?
Purchasing VOO or VTI through a licensed Hong Kong bank is secure. These banks are strictly regulated, and the trading process is transparent, making it suitable for individual investors.
How are dividends from VOO and VTI received?
Dividends from VOO or VTI are automatically deposited into your brokerage account. No manual action is required, and dividends are typically paid quarterly.
What taxes apply when investing in VOO or VTI?
In the U.S. market, ETF dividends and capital gains may be subject to U.S. taxes. Consult a professional to plan taxes and optimize investment returns.
Having compared VOO and VTI, you’re equipped to select based on stability or broad diversification, yet high cross-border fees, currency volatility, and offshore account hurdles can stall dollar-cost averaging or seizing U.S. stock plays amid market swings. Envision a platform with 0.5% remittance fees, same-day global transfers, and zero-fee contract limit orders, enabling seamless VOO or VTI allocations via one account?
BiyaPay is designed for ETF investors, offering instant fiat-to-digital conversions to match market rhythms. With real-time exchange rate query, track USD trends and remit at optimal moments to trim costs. Spanning most regions with instant arrivals, it powers quick executions of VOO’s steady strategies or VTI’s growth pursuits. Crucially, trade U.S. and Hong Kong stocks through a single account, leveraging zero-fee contract limit orders for performance-based limit strategies.
Whether favoring VOO’s resilience or VTI’s breadth, BiyaPay empowers your portfolio. Sign up now, visit stocks for U.S. ETF prospects—quick setup unlocks cost-effective, compounding investing. Join global investors and supercharge your ETF choices!
*This article is provided for general information purposes and does not constitute legal, tax or other professional advice from BiyaPay or its subsidiaries and its affiliates, and it is not intended as a substitute for obtaining advice from a financial advisor or any other professional.
We make no representations, warranties or warranties, express or implied, as to the accuracy, completeness or timeliness of the contents of this publication.


Contact Us
Company and Team
BiyaPay Products
Customer Services


is a broker-dealer registered with the U.S. Securities and Exchange Commission (SEC) (No.: 802-127417), member of the Financial Industry Regulatory Authority (FINRA) (CRD: 325027), member of the Securities Investor Protection Corporation (SIPC), and regulated by FINRA and SEC.
registered with the US Financial Crimes Enforcement Network (FinCEN), as a Money Services Business (MSB), registration number: 31000218637349, and regulated by FinCEN.
registered as Financial Service Provider (FSP number: FSP1007221) in New Zealand, and is a member of the Financial Dispute Resolution Scheme, a New Zealand independent dispute resolution service provider.