- EasyCard
- Trade
- Help
- Announcement
- Academy
- SWIFT Code
- Iban Number
- Referral
- Customer Service
- Blog
- Creator
How to Understand Stock Value Through the Price-Earnings Ratio? A Comprehensive Analysis of Three Types of PE Indicators


Image Source: pexels
Do you think understanding stock value through P/E ratios is straightforward? In reality, the price-to-earnings (P/E) ratio is a powerful tool for assessing stock value, but you need to combine it with the company’s growth expectations and industry context. Many investors fall into common traps:
- A low P/E ratio doesn’t always mean a stock is undervalued, nor does a high P/E ratio always indicate overvaluation.
- You cannot directly compare P/E ratios across different companies; comparisons must be made within the same industry.
- The quality of a P/E ratio depends on multiple factors, not just a single number.
Relying solely on historical earnings to calculate P/E may overlook future profit potential. Properly understanding P/E ratios can help you make more informed decisions about stock value.
Key Points
- The P/E ratio is a key tool for evaluating stock value, but it shouldn’t be used in isolation. Combining it with company growth and industry context leads to more accurate analysis.
- A low P/E ratio doesn’t necessarily mean a stock is undervalued; comparisons within the same industry are essential for accurate conclusions.
- Dynamic PE and rolling PE better reflect future earnings expectations, making them suitable for analyzing growth-oriented or volatile companies.
- Combining the PEG ratio provides a more comprehensive valuation perspective, with a PEG below 1 often indicating an undervalued stock worth considering.
- In investment decisions, flexibly select appropriate PE metrics to avoid relying solely on P/E ratios, improving judgment accuracy.
How to Understand Stock Value Through P/E Ratios

Image Source: unsplash
Role of P/E Ratios
When analyzing stocks, the P/E ratio is one of the most commonly used valuation tools. Here’s how P/E ratios help you understand stock value:
| Key Function | Description |
|---|---|
| Assess Undervaluation/Overvaluation | P/E ratios help you gauge a stock’s relative value. |
| Compare with Market Benchmarks | Compare P/E with market benchmarks (e.g., S&P 500) to evaluate valuation levels. |
| Evaluate Relative Profit Growth Potential | High-growth companies often have higher P/E ratios, reflecting future earnings expectations. |
You can use P/E ratios to understand stock value, but don’t rely on a single number. A high P/E may indicate strong market expectations for future growth, while a low P/E could suggest pessimism about a company’s prospects or a cyclical downturn. Combine it with the company’s growth potential and industry characteristics. For instance, in the U.S. tech sector, high P/E ratios are common due to expectations of rapid future earnings growth. You can also compare P/E ratios to the broader market to assess whether a stock is overvalued or undervalued.
Tip: When investing, combine static PE, dynamic PE, and rolling PE metrics with the PEG ratio for a more comprehensive valuation assessment.
Limitations and Pitfalls
Relying solely on P/E ratios to understand stock value can lead to several pitfalls:
- Earnings can be manipulated. Some companies use accounting tactics to inflate profits, distorting P/E ratios.
- P/E ratios focus on current earnings, ignoring future growth potential, which may undervalue growth-oriented companies.
- P/E ratios vary significantly across industries. Comparing companies from different sectors can lead to flawed conclusions.
- P/E ratios don’t account for debt. A company with low P/E but high debt may carry significant financial risk.
When analyzing, combine P/E with the PEG ratio, which incorporates earnings growth for a more accurate valuation. Financial experts suggest that using P/E alone may be misleading; integrating PEG and all three PE metrics helps you better identify investment opportunities and risks.
- P/E is a key valuation metric, but its limitations are significant.
- The PEG ratio, by factoring in growth, offers a more comprehensive valuation perspective.
- Understanding P/E types, limitations, and industry differences enables more effective stock value assessment.
In investment decisions, avoid relying solely on P/E ratios. Combine them with company growth, industry characteristics, and other valuation metrics for a scientific approach to understanding stock value.
Static PE Analysis
Definition and Calculation
When analyzing stocks, static PE (static price-to-earnings ratio) is one of the most common valuation methods. It’s based on a company’s published annual or quarterly financial reports, reflecting the market’s current assessment of its profitability. The table below outlines static PE components and calculation:
| Component | Description |
|---|---|
| Stock Price | Current market trading price, reflecting investor sentiment. |
| Earnings Per Share (EPS) | Net income over a specific period divided by outstanding shares, indicating per-share profit. |
| P/E Ratio | Stock price divided by EPS, calculated as P/E = Stock Price / EPS. |
You can calculate static PE by dividing the current stock price by the past year’s EPS. This method is simple and intuitive, ideal for quickly assessing whether a company is overvalued or undervalued.
Applicable Scenarios
Static PE is best suited for companies with stable earnings and minimal performance fluctuations, such as large U.S. consumer goods or utility companies with consistent annual profits. When analyzing these companies, static PE provides a reliable reflection of their true value. However, in cyclical industries like energy or raw materials, static PE can fluctuate significantly. The table below shows a U.S. energy company’s PE changes over time:
| Date | PE Ratio | Stock Price | EPS |
|---|---|---|---|
| September 11, 2025 | 9.1 | $82.02 | $9.01 |
| May 2021 | 133.15 | $113.18 | $0.85 |
| July 2022 | 4.69 | $61.92 | $13.19 |
| 10-Year Average | 17.45 | N/A | N/A |
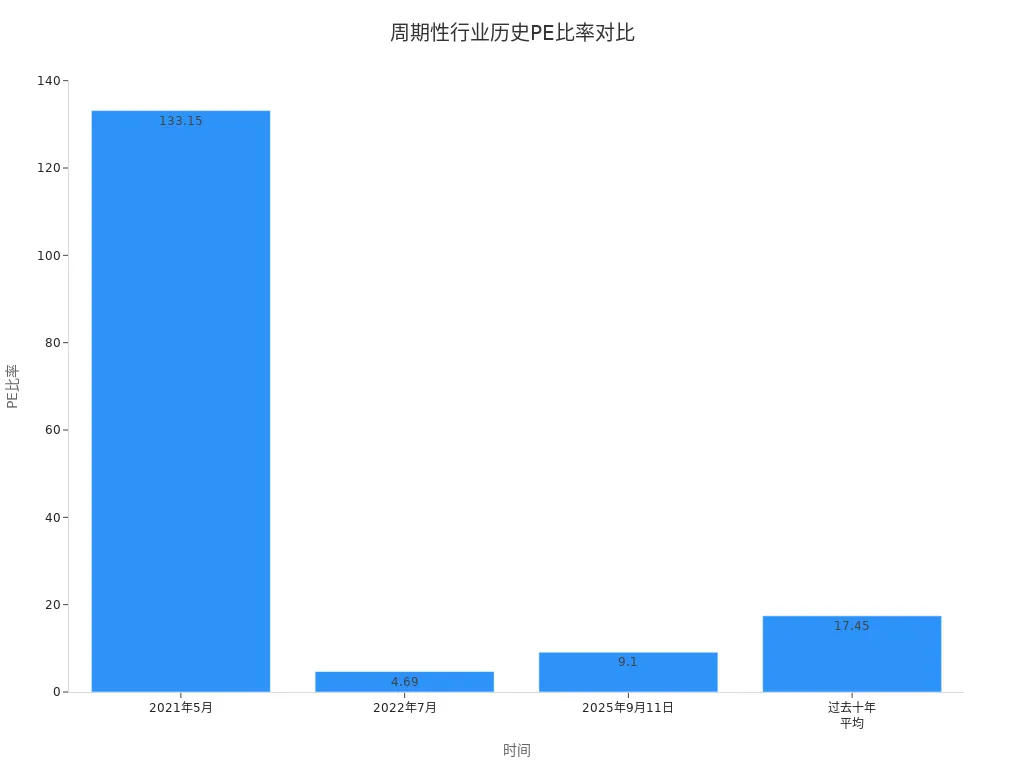
Cyclical industries’ static PE is heavily influenced by performance fluctuations, making it risky to rely solely on static PE for valuation.
Advantages and Disadvantages
When using static PE, consider these pros and cons:
- Static PE is simple to calculate, with transparent, publicly available data, making it beginner-friendly.
- It allows straightforward comparisons of valuation levels within the same industry.
- However, current earnings may be distorted by one-off events like restructuring or pandemics, leading to inaccurate static PE.
- During industry-wide overvaluation, static PE may be inflated, potentially misleading your decisions.
- Static PE doesn’t account for future earnings changes, limiting its value for growth-oriented or cyclical companies.
When using P/E ratios to understand stock value, combine static PE with company growth and industry cycles to avoid decisions based solely on this metric.
Dynamic PE Analysis
Definition and Calculation
When analyzing growth-oriented companies, dynamic PE (dynamic price-to-earnings ratio) is a crucial tool. Unlike static PE, it relies on forecasts of future earnings rather than historical data. You can calculate dynamic PE using this formula:
| Item | Description |
|---|---|
| Stock Price | Current market price |
| Forecasted EPS | Analysts’ or company’s EPS predictions for the next year |
| Dynamic PE | Stock Price ÷ Forecasted EPS |
Divide the current stock price by analysts’ forecasted EPS for the next year to get dynamic PE. This method reflects the market’s expectations for a company’s future profitability.
Applicable Scenarios
Dynamic PE is particularly useful for evaluating U.S. tech companies or high-growth firms with modest current earnings but significant future potential. It helps you capture market confidence in a company’s growth trajectory. When using P/E ratios to understand stock value, dynamic PE focuses on future growth potential rather than past performance.
Tip: When using dynamic PE, combine it with industry average forecasts and the company’s historical performance to avoid errors from inaccurate predictions.
Advantages and Disadvantages
Dynamic PE has the following pros and cons:
- It reflects future earnings expectations, ideal for growth-oriented companies.
- You can use it to compare growth potential within the same industry.
- However, it heavily relies on analyst forecasts. Studies show analyst target predictions have a systematic upward bias of about 9.4%, with absolute pricing errors up to 24.8%. Overpredictions of price changes reach 21%, and directional accuracy is only 54%. Forecast quality declines over time, and data can become outdated.
- Using dynamic PE in isolation or ignoring factors like earnings quality, industry differences, one-off events, or market sentiment can lead to flawed decisions.
- Dynamic PE is nearly useless without additional context, requiring integration with other data for accurate use.
In investments, combine dynamic PE with static and rolling PE metrics for a comprehensive valuation assessment.
Rolling PE Analysis
Definition and Calculation
When analyzing stocks, rolling PE (Rolling Price-to-Earnings) combines historical and future performance. It’s calculated in two ways: using trailing twelve months (TTM) EPS or next twelve months (NTM) forecasted EPS. The table below outlines the methods:
| Calculation Type | Method | Purpose |
|---|---|---|
| TTM Rolling PE | Current Price ÷ Past 12 Months EPS | Assess past performance and current valuation |
| NTM Rolling PE | Current Price ÷ Next 12 Months Forecasted EPS | Better reflect future performance |
When using rolling PE, you can dynamically track performance changes, incorporating both historical and future earnings. This method provides a more comprehensive view when using P/E ratios to understand stock value.
Applicable Scenarios
Rolling PE is ideal for companies with volatile earnings, such as:
- Comparing valuation levels within the same industry.
- U.S. market tech or energy companies with significant performance fluctuations, where rolling PE better reflects true value.
- High P/E companies often signal strong market expectations for future earnings growth, while low P/E companies may be in a cyclical trough or undervalued.
Rolling PE helps you capture performance trends, avoiding reliance on single-point data.
Advantages and Disadvantages
Consider these pros and cons when using rolling PE:
- It provides valuable insights into future performance.
- You can quickly compare valuation levels across U.S. market stocks to aid investment decisions.
- Rolling PE is sensitive to market fluctuations, and significant performance changes can distort valuations.
- It relies on accurate financial reports and forecasts; inaccurate data can skew judgments.
- Comparing companies across industries is challenging, making rolling PE more suitable for intra-industry analysis.
When using P/E ratios to understand stock value, combine rolling PE with other metrics for greater accuracy and comprehensiveness.
Comparison of Three PE Metrics

Image Source: pexels
Industry Case Studies
When analyzing the U.S. tech sector, the three PE metrics reveal distinct insights. For a large tech company, static PE is often high due to expectations of sustained earnings growth. Dynamic PE reflects analyst forecasts for the next year, ideal for assessing growth-oriented firms. Rolling PE, combining past and future performance, captures performance volatility, such as in the energy sector, where market price fluctuations impact earnings. Comparing these metrics helps you understand stock value more comprehensively through P/E ratios.
Market Environment Impact
In a bull market, most companies’ PE ratios rise as investors are optimistic and willing to pay a premium for growth stocks. In a bear market, pessimistic sentiment lowers PE ratios. Static PE can be inflated in bull markets, while dynamic and rolling PE better reflect changing market expectations. When analyzing, consider the market environment to gauge the relevance of PE metrics, as their interpretation varies across market cycles.
Investment Decision Reference
For investment decisions, use the three PE metrics together. Static PE is suitable for stable-earnings companies, dynamic PE for growth-oriented firms, and rolling PE for companies with volatile earnings. Select the appropriate metric based on industry characteristics and market conditions. This integrated approach enhances the accuracy of using P/E ratios to understand stock value.
PEG Ratio Supplement
PEG Definition
When using P/E ratios to understand stock value, you may find that P/E alone doesn’t fully capture a company’s growth potential. The PEG (Price-to-Earnings-to-Growth) ratio extends P/E by incorporating future earnings growth, offering a more scientific valuation. The table below outlines the PEG ratio’s definition and calculation:
| PEG Ratio | Description |
|---|---|
| Definition | PEG is the P/E ratio divided by the expected earnings growth rate over a period (typically 1-3 years). |
| Formula | PEG = (Stock Price / EPS) / EPS Growth Rate |
| Steps | Calculate P/E, then divide by the expected EPS growth rate. |
To calculate PEG:
- Compute the company’s P/E ratio.
- Obtain analyst forecasts for EPS growth over 1-3 years.
- Divide P/E by the expected growth rate to get PEG.
A PEG ratio below 1.0 typically indicates an undervalued stock, signaling a potential investment opportunity. PEG helps assess whether the current stock price is justified by expected earnings growth.
PEG Application
PEG is particularly valuable for analyzing growth-oriented companies. When using P/E ratios to understand stock value, high P/E ratios for growth firms may be justified if their earnings growth is rapid, resulting in a reasonable PEG. Professor Robert Johnson notes that PEG incorporates growth into the valuation equation, enabling more accurate assessments. Use PEG to determine if a high P/E is reasonable or if a low P/E reflects declining performance.
In practice, apply PEG as follows:
- Evaluate the valuation fairness of growth-oriented companies, avoiding misjudgments based solely on P/E.
- Compare PEG ratios within the same industry to identify undervalued growth stocks.
- Combine with rolling and dynamic PE for more accurate future performance predictions.
Studies show that portfolios sorted by PEG ratios can outperform the market, making PEG a critical tool for assessing growth companies. When using P/E ratios to understand stock value, integrate PEG with other PE metrics for a comprehensive investment perspective.
When investing, flexibly choose PE metrics. Static PE suits stable-earnings companies, dynamic PE fits growth firms, and rolling PE is ideal for volatile performers. P/E isn’t a foolproof tool, and relying on it alone carries risks:
- P/E can mislead when evaluating cyclical companies.
- It cannot predict future performance.
- Applicability varies across industries and companies.
Use the table below to select appropriate valuation methods:
| Industry | Recommended Valuation Model | Explanation |
|---|---|---|
| IT Software/Services | P/E | Reflects future growth expectations |
| Energy | EV/EBITDA | Capital-intensive, consider debt |
| Healthcare | P/E | Strong profitability, higher P/E |
| Financial Services | P/E | Low capital expenditure, lower P/E |
Combine P/E with metrics like price-to-book, price-to-sales, or cash flow ratios for greater accuracy. Choose valuation tools based on industry and company specifics, avoiding decisions based solely on P/E ratios.
FAQ
Does a lower P/E ratio mean a stock is more worth buying?
A low P/E doesn’t always mean a stock is a good buy. It could reflect poor company prospects or an industry downturn. Combine it with company fundamentals and industry context for informed decisions.
Can P/E ratios be directly compared across industries?
You cannot directly compare P/E ratios across industries due to differing profit models. Compare within the same industry for accurate insights.
Is dynamic PE or static PE more accurate?
Dynamic PE better reflects future expectations for growth companies, while static PE suits stable-earnings firms. Use both for a comprehensive valuation.
How does the PEG ratio help assess stock valuation?
PEG helps determine if a P/E ratio is reasonable. A PEG below 1 often indicates an undervalued stock. Analyze it alongside industry averages and company growth.
Are P/E ratios affected by market sentiment?
P/E ratios are often influenced by market sentiment. They rise in bull markets and fall in bear markets. Analyze rationally to avoid following market trends blindly.
By mastering option pricing models and key factors, you’re equipped to scientifically assess option values and seize market opportunities, but high cross-border fees, currency volatility, and offshore account complexities can hinder trading U.S. options, especially for swift responses to volatility shifts or strategy tweaks. Picture a platform with 0.5% remittance fees, same-day global transfers, and contract limit orders with zero fees, enabling seamless option strategies via one account?
BiyaPay is tailored for options traders, offering instant fiat-to-digital conversions to act on pricing signals nimbly. With real-time exchange rate query, monitor USD shifts and transfer at optimal moments to cut costs. Covering most regions with instant arrivals, it powers rapid allocations to S&P 500 index options (like SPY) or individual stock options. Crucially, trade U.S. and Hong Kong markets through a single account, leveraging contract limit orders with zero fees for Black-Scholes or volatility-based limit strategies.
Whether chasing arbitrage or optimizing risk management, BiyaPay fuels your precision. Sign up now, visit stocks for U.S. prospects—quick setup unlocks cost-effective, data-driven trading. Join global investors and take control in 2025 markets!
*This article is provided for general information purposes and does not constitute legal, tax or other professional advice from BiyaPay or its subsidiaries and its affiliates, and it is not intended as a substitute for obtaining advice from a financial advisor or any other professional.
We make no representations, warranties or warranties, express or implied, as to the accuracy, completeness or timeliness of the contents of this publication.


Contact Us
Company and Team
BiyaPay Products
Customer Services


is a broker-dealer registered with the U.S. Securities and Exchange Commission (SEC) (No.: 802-127417), member of the Financial Industry Regulatory Authority (FINRA) (CRD: 325027), member of the Securities Investor Protection Corporation (SIPC), and regulated by FINRA and SEC.
registered with the US Financial Crimes Enforcement Network (FinCEN), as a Money Services Business (MSB), registration number: 31000218637349, and regulated by FinCEN.
registered as Financial Service Provider (FSP number: FSP1007221) in New Zealand, and is a member of the Financial Dispute Resolution Scheme, a New Zealand independent dispute resolution service provider.