- EasyCard
- Trade
- Help
- Announcement
- Academy
- SWIFT Code
- Iban Number
- Referral
- Customer Service
- Blog
- Creator
Don't Be a Sitting Duck! Understand the Ominous Signals of Market Bubbles!


Image Source: unsplash
Market bubbles typically manifest as significant price surges in a short period, extreme optimism among investors, and continuously increasing trading volumes. Media frequently report on the phenomenon, retail investors rush into the market, and irrational exuberance becomes evident. Over the past 50 years, major financial markets like those in the U.S. and Japan have repeatedly shown similar signals. The following table showcases some typical cases and their profound impacts:
| Event | Time Period | Impact |
|---|---|---|
| Japanese Asset Price Bubble | 1980s to 2011 | Led to long-term deflationary recession |
| Dot-Com Bubble | Collapsed on March 10, 2000 | Affected the U.S. financial market |
| 2008 Financial Crisis | Began in late 2007 | Triggered market sell-offs due to debt and real estate bubbles |
Investors need to be wary of irrational exuberance, promptly recognize the above signals, and avoid blindly following trends.
Key Points
- Signals of a market bubble include rapid price increases, extreme investor optimism, and surging trading volumes. Investors should always monitor these indicators to avoid blindly following trends.
- Media reports amplify the formation of bubbles. Investors need to rationally analyze information sources to avoid being misled by public opinion.
- A massive influx of retail investors often signals a market bubble. Investors should pay attention to changes in market participation structures and be cautious of risks from speculative behavior.
- Diversified investments and stop-loss strategies are effective ways to reduce market bubble risks. Investors should allocate assets reasonably and set stop-loss points to protect their portfolios.
- Continuous learning of financial knowledge can enhance investment decision-making capabilities. Investors should constantly update their financial literacy to identify and manage risks.
Market Bubble Signals
Image Source: pexels
The formation of market bubbles is often accompanied by a series of clear signals. If investors can promptly identify these warning signs, they can effectively reduce the risks of passive following and asset losses. The following sections provide a professional analysis from five perspectives: price, sentiment, trading, media, and investor structure.
Rapid Price Increases
A sharp rise in asset prices over a short period is the most intuitive signal of a market bubble. Financial research indicates that rapid price increases are often related to investors inferring others’ intentions through social signals, which accelerates asset price inflation.
| Evidence Description | Correlation |
|---|---|
| Studies show that Theory of Mind (ToM) in complex financial markets may lead to asset price inflation, a characteristic of market bubbles. | Inferring other traders’ intentions through social signals can lead to rapid price increases. |
| Rapid price increases are often followed by crashes, a phenomenon defined as a bubble. | Rapid price increases are a common feature of bubble formation. |
| Research finds that activity in the vmPFC is significantly correlated with participants’ behavioral tendencies in bubble markets. | This region’s activity predicts participants’ tendency to “ride” bubbles in bubble markets. |
In the U.S. market, historical data shows that rapid price surges often signal the formation of a market bubble. Investors should be cautious of irrational price increases and avoid blindly chasing highs.
Extreme Optimism
Extreme optimism among investors is a key driver of market bubbles. Historically, the 1929 U.S. stock market crash and the 1990s internet bubble were driven by investors’ excessive expectations of future returns, leading to market loss of control.
| Event | Description |
|---|---|
| 1929 Stock Market Crash | Investors’ excessive optimism led to a 25% market plunge in a short period, triggering the Great Depression. |
| 1990s Internet Bubble | Investors were overly optimistic about internet companies’ future, blindly investing, leading to most companies’ failures. |
When market participants widely believe prices will only rise and ignore potential risks, market bubbles are highly likely to form. Rational investors need to stay vigilant and avoid being swept up by collective optimism.
Surging Trading Activity
A significant increase in trading volume often accompanies the formation of market bubbles. Historical data from the New York Stock Exchange shows that from 1925 to 1929, trading volume grew from 100% to over 140%.
| Evidence Point | Description |
|---|---|
| Trading Volume and Bubbles | Asset price bubbles are typically accompanied by increased trading volume. |
| Historical Data | From 1925 to 1927, the annual trading volume of the New York Stock Exchange reached 100%, and from 1928 to 1929, this figure exceeded 140%. |
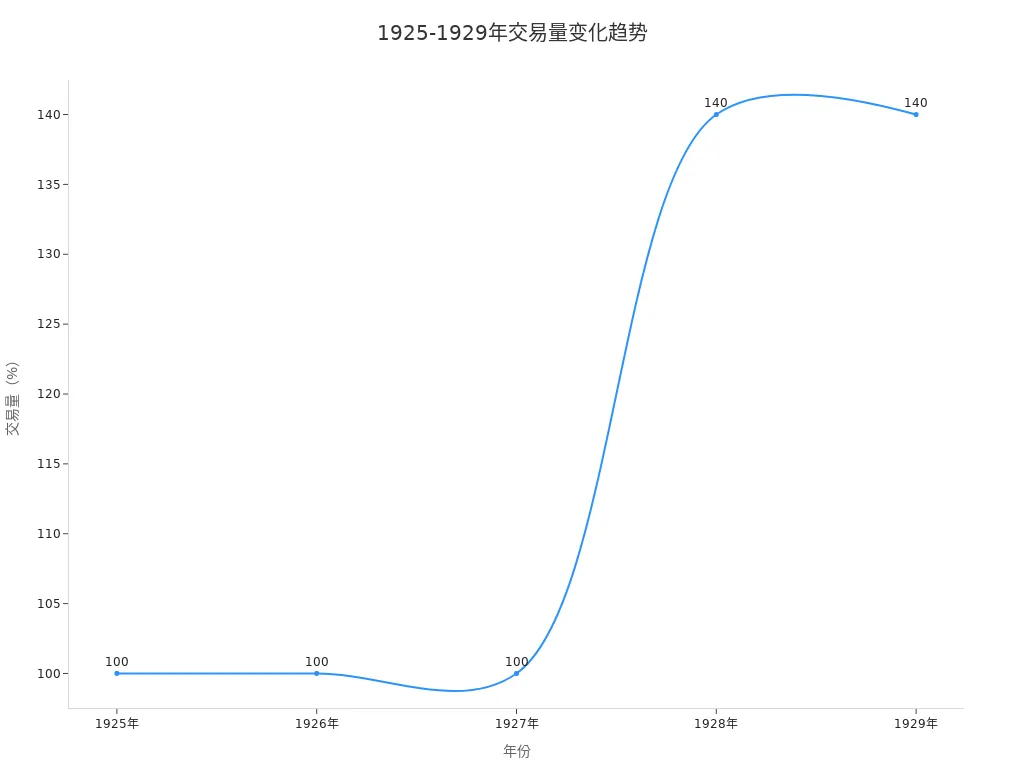
Surging trading activity reflects speculative enthusiasm among market participants. Investors should pay attention to abnormal changes in trading volume and be cautious of market bubble risks.
Media Hype
The media acts as an amplifier during the formation of market bubbles. Research shows that during bubble periods, media reports significantly boost next-day market returns, while their impact is limited during non-bubble periods.
| Evidence Type | Description |
|---|---|
| Impact of Media Reports | Media reports increase next-day returns during bubble periods but have no significant impact during non-bubble periods. |
| Consistency | These results have been validated in other markets, such as Ethereum and Litecoin. |
| Theoretical Support | The results support Shiller’s hypothesis that media can promote bubble formation. |
When mainstream media frequently report on a certain asset class, even describing it as a “must-buy” or “wealth code,” the risk of a market bubble significantly increases. Investors need to rationally analyze information sources to avoid being misled by public opinion.
Retail Investor Influx
A massive influx of retail investors is one of the typical signals of a market bubble. U.S. market data shows that during the COVID-19 period, retail investors heavily bought S&P 500 stocks through commission-free platforms, driving market rebounds and triggering long-term uptrends.
- Retail Investor Behavior: Recently, a large influx of retail investors, especially young investors, engaged in speculative trading through commission-free brokerage platforms, leading to soaring market activity and valuations.
- Market Breadth: The current market’s breadth has significantly narrowed, with only a few stocks rising, indicating poor market health.
- Corporate Profits: While S&P 500 profits have steadily risen, overall corporate earnings remain relatively flat, potentially exaggerated by short-term incentives and accounting practices.
- Historical Return Expectations: When historical equity returns are significantly higher than bond returns, investors often view historical returns as predictors of future returns, which can lead to financial disasters.
The influx of retail investors often exacerbates the irrational exuberance of market bubbles. Investors should pay attention to changes in market participation structures and be cautious of risks from speculative behavior.
Recognizing market bubble signals is crucial for investors. By monitoring key indicators such as price, sentiment, trading, media, and investor structure, investors can effectively avoid passive following and asset loss risks, enhancing the scientific basis of investment decisions.
Market Bubble Definition
Causes
Economists believe that market bubbles arise from multiple factors. Investors’ overconfidence and optimism often drive asset prices far beyond their fundamentals. In monetary policy, during low-inflation periods, central banks maintain low interest rates, stimulating borrowing and investment, further exacerbating asset price increases. Excess liquidity leads lenders to underestimate risks, increasing leverage levels, especially in environments with securitized mortgages. Global capital flows also affect asset prices in developed economies, with significant bubble risks when capital inflows surge.
- Behavioral Factors: Investors’ overconfidence ignores risks.
- Monetary Policy: Low interest rates stimulate speculative behavior.
- Excess Liquidity: Abundant funds increase risk appetite.
- Leverage Effect: High leverage amplifies price fluctuations.
- Global Capital Flows: Cross-border funds drive asset prices.
Characteristics
Market bubbles have distinct characteristics. Asset prices significantly exceed intrinsic value, speculative activity is frequent, and market sentiment is extremely optimistic. Investors heavily borrow, with rising leverage usage. Abundant liquidity and surging trading volumes, increased issuance of new assets, and a more diverse market participant structure are common.
- High Prices: Asset prices far exceed fundamentals.
- Increased Leverage: Investors have a strong willingness to borrow.
- Enhanced Liquidity: Abundant market funds.
- Surging Trading Volume: Active trading with frequent intraday transactions.
- Market Democratization: More retail investors participate.
- Increased New Issuances: Frequent listing of new assets.
Impact
The bursting of market bubbles brings severe consequences. Asset prices plummet, investors suffer heavy losses, and financial institutions face risks. U.S. market history shows that after bubbles burst, economic growth slows, unemployment rises, and social confidence is shaken. Financial system turmoil, corporate financing difficulties, and long-term impacts on economic structures follow.
Market bubbles not only affect individual investors’ assets but can also trigger systemic financial risks. Rationally analyzing the causes and characteristics of bubbles helps investors avoid potential losses and enhance risk management capabilities.
Case Studies
Dot-Com Bubble
The dot-com bubble occurred around 2000. Many internet companies spent 90% of their budgets on advertising. Numerous startups lacked profitability, with venture capital concentrated in companies without solid business foundations. The Federal Reserve raised interest rates in early 2000, increasing borrowing costs. Investors began questioning startups without actual revenue. Japan’s economic recession in March 2000 deepened market uncertainty, leading to massive stock sell-offs and a rapid market decline. By 2000, public skepticism of new internet companies grew, but market participants generally ignored these signals.
Typical characteristics of the dot-com bubble include high valuations, lack of profitability, influx of speculative capital, and disregard for risks. These signals foreshadowed the subsequent market crash.
Real Estate Bubble
The 2008 real estate bubble was closely tied to investor behavior. Investors capitalized on low mortgage rates, actively engaging in speculative home purchases, driving real estate prices upward. Credit expansion and the introduction of non-traditional mortgage products enabled more investors to enter the market, further inflating the bubble. Housing demand surged, with prices far exceeding actual value. Ultimately, the market could not sustain high leverage and valuations, leading to a bubble burst and the global financial crisis.
Cryptocurrency Bubble
The cryptocurrency market experienced significant bubbles in 2017 and 2021. In 2017, Bitcoin, Ethereum, and Ripple saw price increases of 19x, 73x, and 563x, respectively. In early 2018, market prices fell by approximately 82% within three months. From late 2020 to mid-2021, prices surged again. The following table shows price changes and impacts during key periods:
| Time Period | Price Change Characteristics | Impact |
|---|---|---|
| 2017 Bubble | Significant price surges followed by an 82% crash | Affected interdependence and contagion among major cryptocurrencies |
| 2021 Bubble | Prices surged significantly again | Contagion was weaker, but stronger during the post-2021 bubble period |
Cryptocurrency bubbles are characterized by sharp price fluctuations, heightened speculative sentiment, and increased market contagion.
A-Share Bull Market
The A-share market also exhibited bubble characteristics during specific periods. The Shanghai Composite Index rose 30% in 12 months. Producer prices contracted for 34 consecutive months, indicating deflationary pressure. In July 2025, fixed asset investment fell 5.2% year-over-year, the largest decline in 20 years, with housing sales and construction dropping 50-70%. The market’s price-to-earnings ratio was excessively high, reflecting irrational valuations. Investor speculative behavior increased, with trading volumes surging significantly. Company insiders actively issued new shares and sold personal holdings to profit from high valuations.
| Indicator | Value |
|---|---|
| Shanghai Composite Index Growth | 30% increase in 12 months |
| Producer Prices | Contracted for 34 consecutive months, indicating deflationary pressure |
| Fixed Asset Investment | Fell 5.2% year-over-year in July 2025, the largest decline in 20 years |
| Housing Prices | Sales and construction dropped 50-70% |
These phenomena collectively reflect typical market bubble signals, reminding investors to monitor valuations and market structure changes.
Psychological Pitfalls

Image Source: unsplash
Herd Mentality
Behavioral finance studies show that herd mentality plays a critical role in market bubble formation. Investors often follow the crowd out of fear of missing potential wealth. For example, during the Mississippi Company bubble, investors exhibited strong herd behavior, driving rapid stock price increases. During the 1929 U.S. stock market crash, investors joined the speculative frenzy, ultimately leading to the bubble’s collapse. In the 2008 financial crisis, many retail investors followed the upward trend in stock prices, forming a self-reinforcing buying cycle.
| Event | Evidence |
|---|---|
| Mississippi Company Bubble | Investors showed strong herd behavior, following the crowd out of fear of missing potential wealth, driving rapid stock price increases. |
| 1929 Stock Market Crash | Herd behavior led to rapid stock price increases, with more investors joining the speculative frenzy, forming a bubble. |
| 2008 Financial Crisis | Many retail investors engaged in herd behavior, following the upward trend in stock prices, forming a self-reinforcing buying cycle. |
Investors during bubble periods are prone to following others, increasing speculative behavior. Over-optimism and recency bias lead to unrealistic expectations of future market trends. Many investors, fearing losses, are reluctant to sell stocks during market downturns, further exacerbating crash risks.
Blind Trend-Following
During market bubbles, investors often engage in blind trend-following due to Fear of Missing Out (FOMO). They see others profiting from a stock or trend and rush to invest, ignoring their risk tolerance. Investors tend to assume the crowd possesses more information, actively following market hotspots.
- Investors tend to follow the crowd, assuming others know something they don’t.
- FOMO drives investors to rush into hot assets.
- Blind trend-following leads investors to overlook fundamental analysis, increasing asset price volatility.
This psychological pitfall causes market participants to invest heavily without rational judgment, fueling bubble formation and expansion.
Overconfidence
Overconfidence is a common psychological pitfall during bubbles. Investors overestimate their abilities and investment potential, frequently trading and using excessive leverage. Many ignore fundamental analysis, over-concentrating investments in familiar stocks.
- Investors tend to overestimate their abilities and investment potential.
- Overconfidence leads to frequent trading and excessive leverage.
- Ignoring fundamental analysis fuels bubble formation and growth.
- Overconfident investors are more likely to trade frequently, despite potential losses.
- They are prone to overreacting to market signals, leading to investment errors.
Investors should be wary of their psychological pitfalls, maintain rational analysis, and avoid unnecessary risks due to overconfidence.
Risk Mitigation
Diversified Investments
Diversified investments can effectively reduce losses during market bubbles. Allocating funds across different asset classes and industries, such as healthcare, consumer goods, or energy, can mitigate risks from single market fluctuations.
- During the 2008-2009 U.S. bear market, diversified portfolios experienced significantly lower losses than all-stock portfolios.
- Diversification strategies helped investors mitigate losses during the tech bubble crash while maintaining reasonable exposure to market growth.
- Diversified investments help manage risks and enhance portfolio stability.
Stop-Loss Settings
Stop-loss strategies perform well during market downturns. Research shows that stop-loss mechanisms can limit portfolio losses, reduce volatility, and improve risk-adjusted returns.
| Research Content | Results |
|---|---|
| Performance of Stop-Loss Strategies Over 54 Years | Outperformed bonds over 70% of the time and limited losses during market downturns |
| Impact of Stop-Loss Strategies on Portfolio Volatility | Significantly reduced volatility and improved risk-adjusted returns |
| Impact of Stop-Loss Strategies on Sharpe Ratio | Increased the Sharpe ratio from 0.166 to 0.371, indicating better risk-adjusted returns |
Investors should set stop-loss points based on their risk tolerance to avoid significant losses due to sharp market fluctuations.
Fundamental Analysis
Fundamental analysis provides a scientific basis for asset pricing. By analyzing corporate earnings, industry prospects, and economic conditions, investors can determine if assets are overvalued.
- Fundamental analysis reveals deviations between market prices and true value, helping identify bubble signals.
- Econometric models and supply-demand equilibrium methods can assess whether assets are in a bubble state.
- When market prices significantly exceed long-term holders’ expectations, assets are typically considered overvalued.
Rational fundamental analysis helps investors avoid risks from irrational exuberance.
Continuous Learning
Continuous learning of financial knowledge is key to enhancing investment decision-making capabilities. Many employers, educators, and policymakers have recognized the importance of financial literacy and actively promote related courses and programs.
- High school students have low financial literacy, affecting their future savings and investment decisions.
- Rigorous financial education programs can improve credit scores and reduce default probabilities.
- Enhanced financial knowledge helps optimize resource allocation and alleviate wealth inequality.
Investors should continuously learn financial knowledge to improve risk identification and management, steering clear of market bubble traps.
Lessons Learned
Market Changes
After market bubbles burst, the investment environment undergoes significant changes. Investors experience wealth losses, affecting groups from young people to retirees. A crisis of confidence follows, with many becoming cautious about re-entering financial markets.
- Wealth Losses: Bubble bursts lead to significant asset shrinkage, deteriorating some households’ financial conditions.
- Trust Erosion: Investors lose confidence in market mechanisms, and financial institutions’ reputations suffer.
- Dot-Com Bubble: From 1995 to 2001, U.S. tech company valuations soared, followed by a two-year bear market after the 2000 crash.
- Japanese Economic Bubble: From 1984 to 1989, loose financial policies in Japan led to a market collapse after 1989, with long-term economic stagnation.
These historical events show that bubble bursts not only affect individual wealth but also have profound impacts on economic confidence and market structures.
Successful Risk Mitigation
Some investors successfully mitigated bubble risks through scientific strategies. The following table summarizes common effective methods:
| Strategy | Importance |
|---|---|
| Stay Invested | Continuous investing helps manage market volatility and reduce loss risks. |
| Maintain Diversification | Diversified investments reduce single-asset risks. |
| Focus on Long-Term Trends | Prioritizing long-term returns avoids the impact of short-term fluctuations. |
Investors also need to understand the impact of emotions like fear and greed on decision-making, recognize and manage psychological biases, and avoid emotional traps. Investing should be viewed as a long-term process, with patience and rationality being key to successful risk mitigation.
- Focus on fundamentals and long-term trends.
- Diversify investments to reduce risks.
- Build emotional resilience to manage emotions in investment decisions.
These strategies help investors stay calm during market bubbles and minimize losses.
Failure Warnings
Historical data shows that investors often make the following mistakes during bubbles:
- Many blame losses on external factors, such as brokers or investment banks, ignoring their own decision-making errors.
- After experiencing losses, investors often vow never to invest in certain asset classes again, but these lessons fail to prevent new bubbles.
- Greed drives investors to hope for profits from bubbles even when aware of overvaluations, leading to repeated mistakes.
These warnings indicate that only rational analysis and continuous learning can truly prevent investors from becoming victims of market bubbles.
When identifying market bubble signals, investors commonly use statistical methods, theoretical models, and historical index pattern analysis. Rational investing and risk management can significantly reduce the likelihood of losses during bubbles.
Historical cases show that bubble recovery times are long, and fundamental analysis and independent decision-making are crucial. Continuous learning of financial knowledge helps investors avoid becoming “pawns” and become mature investors.
FAQ
What is the difference between a market bubble and normal market fluctuations?
Market bubbles are characterized by prices far exceeding fundamentals and extreme investor optimism. Normal fluctuations are driven by supply-demand changes or economic data, with smaller price swings.
How to determine if asset prices are overvalued?
Investors can use fundamental analysis to compare current asset prices with historical averages. If prices significantly exceed long-term profitability, there is often an overvaluation risk.
Do media reports affect investment decisions?
Media often amplify market sentiment during bubbles, influencing investor judgment. Rational analysis of information sources helps avoid being misled by public opinion.
Can diversified investments reduce bubble risks?
Diversified investments can reduce losses from single-asset risks. Allocating funds across different asset classes enhances overall portfolio stability.
How do Hong Kong-licensed banks respond to market bubbles?
Hong Kong-licensed banks typically strengthen risk management, cautiously evaluate loans and investment projects, ensure asset quality, and reduce potential losses from market bubbles.
Recognizing the pre-signals of a market bubble—rapid price climbs, extreme optimism, and speculative frenzy—is the first step to survival. The second, and arguably most critical step, is the efficient execution of defensive strategies like stop-loss placements and asset reallocation. Slow cross-border transfers and high transaction costs during a market collapse can turn sound analysis into devastating losses by preventing timely action.
To ensure your portfolio defense is as rapid and cost-effective as your analysis, integrate the financial agility of BiyaPay. We offer zero commission for contract limit orders, a crucial advantage that drastically minimizes the cost of executing the urgent, high-volume trades required to de-risk or rebalance during a market event. Furthermore, our platform supports the swift, mutual conversion between fiat and digital assets like USDT, providing you with the fastest, most reliable pathway to fund your brokerage accounts for immediate asset transition in US and HK equities. You can register quickly—in just 3 minutes without requiring an overseas bank account—and gain immediate access to US and Hong Kong Stocks. Leverage our real-time exchange rate checks to maintain transparent control over your funding costs. Open your BiyaPay account today and secure the operational speed essential for successful bubble evasion.
*This article is provided for general information purposes and does not constitute legal, tax or other professional advice from BiyaPay or its subsidiaries and its affiliates, and it is not intended as a substitute for obtaining advice from a financial advisor or any other professional.
We make no representations, warranties or warranties, express or implied, as to the accuracy, completeness or timeliness of the contents of this publication.


Contact Us
Company and Team
BiyaPay Products
Customer Services


is a broker-dealer registered with the U.S. Securities and Exchange Commission (SEC) (No.: 802-127417), member of the Financial Industry Regulatory Authority (FINRA) (CRD: 325027), member of the Securities Investor Protection Corporation (SIPC), and regulated by FINRA and SEC.
registered with the US Financial Crimes Enforcement Network (FinCEN), as a Money Services Business (MSB), registration number: 31000218637349, and regulated by FinCEN.
registered as Financial Service Provider (FSP number: FSP1007221) in New Zealand, and is a member of the Financial Dispute Resolution Scheme, a New Zealand independent dispute resolution service provider.