- EasyCard
- Trade
- Help
- Announcement
- Academy
- SWIFT Code
- Iban Number
- Referral
- Customer Service
- Blog
- Creator
What is the Bearish Engulfing Pattern? Master the Key Signals to Avoid Being Trapped


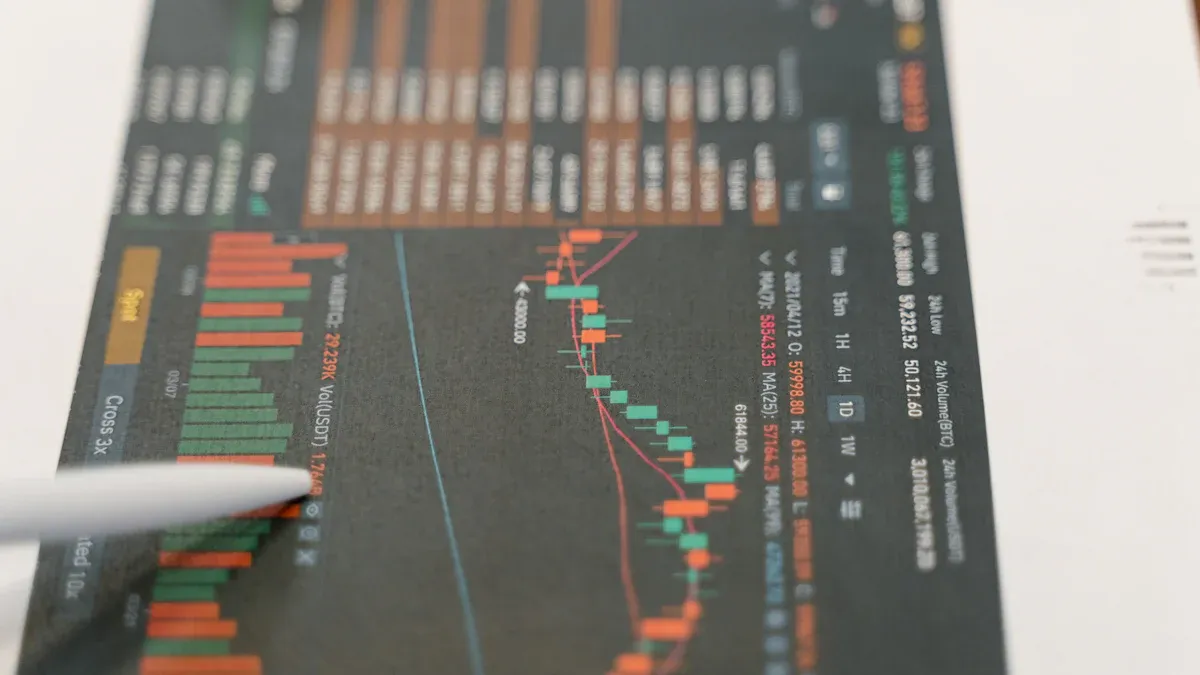
Image Source: pexels
You often encounter the bearish engulfing pattern in trading. It consists of two candlesticks, with the second large bearish candlestick completely engulfing the previous bullish candlestick. This pattern typically appears at the end of an uptrend, signaling that market sentiment may shift from optimistic to cautious. Data shows that the bearish engulfing pattern has a 79% probability of leading to a price reversal, with a target achievement rate of 76%.
| Evidence Type | Result |
|---|---|
| Bearish Engulfing Pattern Success Rate | Price reversal occurs 79% of the time |
| Price Target Achievement Rate | 76% in bearish markets |
You should pay attention to these signals, adjust your trading strategy promptly, and enhance risk prevention awareness.
Key Points
- The bearish engulfing pattern consists of two candlesticks, with a large bearish candlestick fully engulfing a smaller bullish candlestick, typically appearing at the end of an uptrend, signaling a potential market reversal.
- This pattern has a success rate of up to 79%, so you should adjust your trading strategy promptly when it appears to avoid losses.
- Combine volume and other technical indicators (such as moving averages, RSI) to confirm the validity of the bearish engulfing pattern, improving judgment accuracy.
- When the bearish engulfing pattern appears near key resistance levels, the signal is more reliable, requiring close attention to changes in market sentiment.
- Set stop-loss positions reasonably to prevent losses due to market volatility, ensuring trading safety.
Bearish Engulfing Pattern Analysis
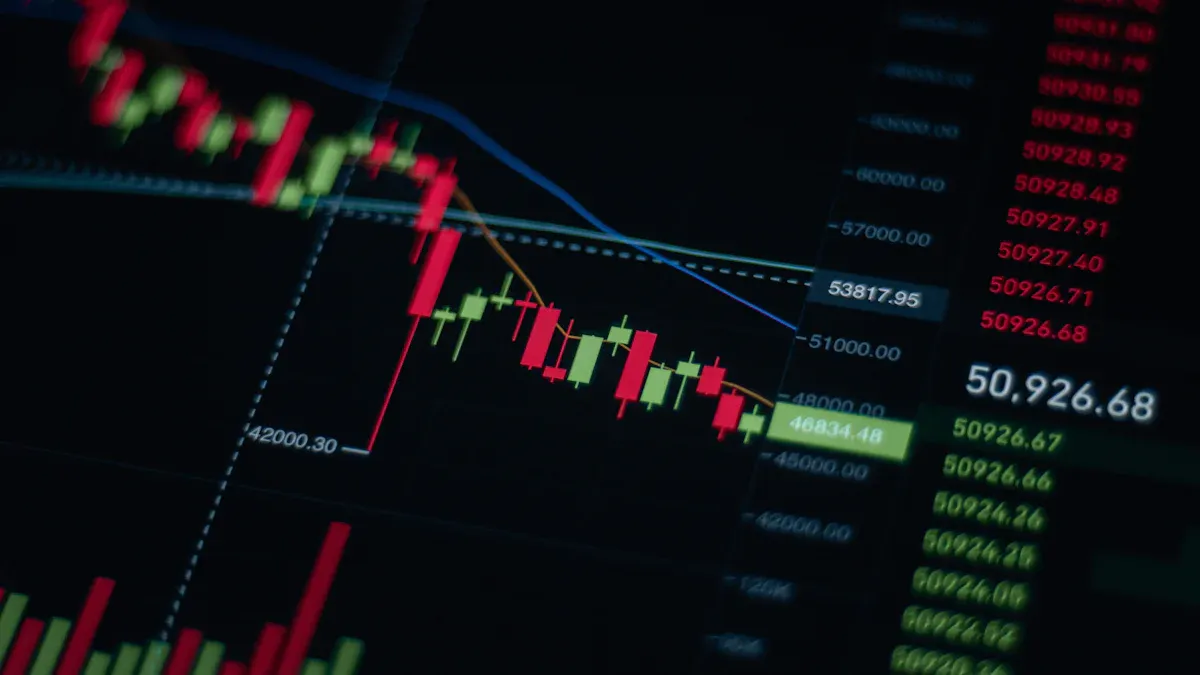
Image Source: pexels
Definition
You can understand the bearish engulfing pattern as a typical candlestick reversal signal. It consists of two candlesticks: the first is a smaller bullish candlestick, and the second is a larger bearish candlestick. The body of the second candlestick completely engulfs the body of the previous candlestick. This pattern typically appears after a price uptrend, indicating that the market may be about to reverse. You will notice that the second bearish candlestick is often larger than the first bullish candlestick, showing increased selling pressure.
- The second candlestick of the bearish engulfing pattern typically opens above the closing price of the previous candlestick and closes below its opening price, indicating that sellers have taken control of the market.
- This pattern is often accompanied by high trading volume, reflecting strong confidence among market participants.
- You can combine other technical analysis tools (such as moving averages, RSI) to further confirm the signal’s validity.
Composition
When analyzing candlestick charts, you can quickly identify the components of the bearish engulfing pattern using the table below:
| Component | Description |
|---|---|
| Large Bearish Candlestick | Fully engulfs the previous smaller bullish candlestick, indicating a trend reversal. |
| Small Bullish Candlestick | Appears before the large bearish candlestick, showing an uptrend. |
The first small bullish candlestick represents the buyers’ final effort, while the second large bearish candlestick indicates a sudden surge in seller strength. This pattern is valid only when the body of the second bearish candlestick completely engulfs the body of the previous bullish candlestick.
Market Significance
When you see a bearish engulfing pattern at the end of an uptrend, you should be cautious of changes in market sentiment. This pattern reflects weakening buyer confidence and strengthening seller momentum. The market initially appears optimistic, but a strong sell-off follows, with buyers gradually losing dominance.
You can further understand the shift in market sentiment through the table below:
| Stage | Market Performance and Sentiment Explanation |
|---|---|
| First Candlestick | Green candlestick shows an uptrend, with buyers dominating and optimistic market sentiment. |
| Second Candlestick | Large red candlestick invalidates the previous bullish candlestick, with sellers taking over, shifting sentiment to cautious or pessimistic. |
| After Pattern Appearance | Prices may decline, with trend reversal signals strengthening, requiring investors to be vigilant about risks. |
You should note that this pattern is most effective when it appears after an uptrend, especially when prices are near resistance levels or the market is in an overbought state. Statistics show that in the U.S. stock market, trades based on the bearish engulfing pattern have an average success rate of 55% to 65%. Market trends and trading volume affect the pattern’s reliability. In practice, you should combine volume and other technical indicators for a comprehensive judgment.
Key Characteristics
Candlestick Pattern
When analyzing the bearish engulfing pattern, you can quickly identify it through the following visual characteristics:
- The pattern typically appears after an uptrend, indicating waning upward momentum.
- The first candlestick is a smaller green candlestick, representing the buyers’ final effort.
- The second candlestick is a larger red candlestick, with its body completely engulfing the body of the previous green candlestick, showing a sudden surge in seller strength.
- The opening price of the second candlestick is higher than or equal to the closing price of the first candlestick, while the closing price is significantly lower than the opening price of the first candlestick.
- When judging, you should focus on the body of the candlesticks, ignoring the upper and lower shadows, as the body better reflects changes in market sentiment.
Tip: In real-world cases in the U.S. market, many investors adjust their positions early after seeing this candlestick pattern to prevent losses from price reversals.
Trading Volume
When identifying the bearish engulfing pattern, changes in trading volume are equally important.
- When this pattern appears, trading volume often increases significantly, indicating higher market participation and stronger selling pressure.
- If the trading volume of the second large bearish candlestick is higher than that of the previous bullish candlestick, it shows that sellers are dominating the market, making the signal more reliable.
- You can use volume changes to assess the pattern’s validity. A bearish engulfing pattern with high volume is generally more reliable than one with low volume.
Typical Context
In practice, you should pay attention to the market context in which the bearish engulfing pattern appears.
- This pattern is commonly seen during periods of continuous price increases and optimistic market sentiment.
- When prices are near key resistance levels or the market is overbought, the appearance of a bearish engulfing pattern strengthens the reversal signal.
- In the U.S. stock market, many traders combine technical indicators like moving averages and RSI to further confirm the signal’s validity.
- You can improve your judgment of the pattern by observing the overall market trend and volume changes.
Signal Identification
Key Levels
When identifying the bearish engulfing pattern, you should first focus on its position. The pattern is only highly reliable when it appears at key price levels. You can follow the steps below to make a judgment:
| Step | Description |
|---|---|
| 1 | Identify the engulfing candlestick pattern at a high point. |
| 2 | Ensure the engulfing candlestick breaks a key support level. |
| 3 | Look for bearish price action (e.g., pin bars) for additional confirmation when the broken level is retested as new resistance. |
In practice, you should focus on whether the price is at a historical high or a key resistance zone. If the bearish engulfing pattern appears in these areas, the signal’s reliability is higher. When prices break through a previous support level and retest it as new resistance, the appearance of another bearish candlestick pattern often signals the start of a downtrend.
Validity Assessment
You need to combine multiple criteria to assess the validity of the bearish engulfing pattern. The following points can help you quickly filter out more reliable signals:
- The bearish engulfing pattern typically appears after a clear uptrend, indicating a shift in market dominance from buyers to sellers.
- The closing price of the second candlestick must be lower than the opening price of the first candlestick, reflecting strong selling pressure.
- The pattern is accompanied by a significant increase in trading volume, indicating higher market participation.
- The signal is more reliable if the pattern appears near key resistance levels.
You can assess the signal’s strength using these criteria. Generally, the combination of volume support and appearance at key price levels is critical for determining the pattern’s validity.
Bearish Engulfing Pattern Signals
In actual trading, you often encounter various reversal signals. Compared to others, the bearish engulfing pattern has a higher success rate. The table below shows the historical performance of several common reversal signals:
| Reversal Signal | Success Rate |
|---|---|
| Bearish Engulfing Pattern | 79% |
| Morning Star | 60-75% |
| Evening Star | About 70% |
You can see that the bearish engulfing pattern has a reversal success rate of up to 79% in the U.S. market. This indicates that you should take its warning signals seriously when it appears.
To further improve signal reliability, you can use other technical indicators for confirmation. The table below lists commonly used technical indicators and their roles:
| Technical Indicator | Description |
|---|---|
| Moving Average | Confirms trend reversals |
| Relative Strength Index (RSI) | Lower RSI values may indicate oversold conditions |
| Bollinger Bands | Price breaking below the lower band may confirm a bearish signal |
When the bearish engulfing pattern appears, you can check if the RSI is falling from a high level or if the price breaks below the moving average or the lower Bollinger Band. If these signals align, the probability of a reversal increases.
Tip: Many traders establish short positions after seeing a bearish engulfing pattern and set stop-loss and take-profit conditions to better manage risks. In practice, you should also create a trading plan based on your risk tolerance.
Risk Prevention
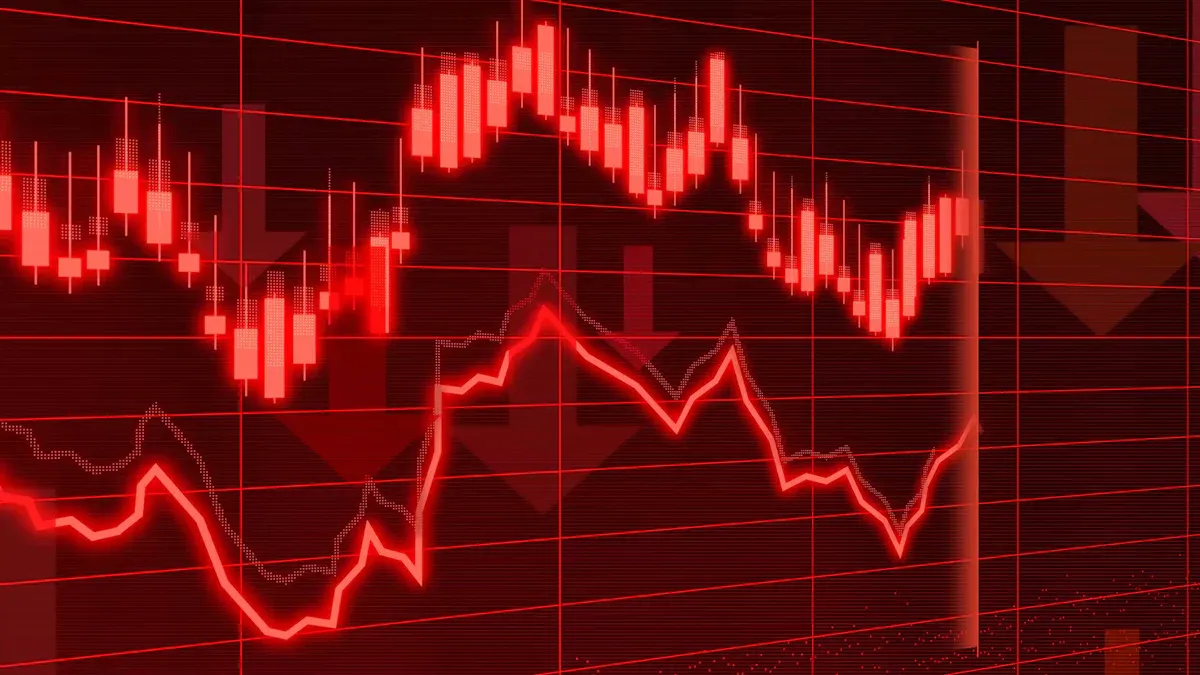
Image Source: pexels
Trading Strategies
In actual trading, you need to adopt scientific strategies to reduce risks. The following methods can help you manage trades more effectively:
- Wait for the candlestick pattern to fully close before making decisions to avoid premature entry.
- Combine market structures, such as trendlines, swing points, or liquidity zones, to enhance signal validity.
- Trade during high-volume periods, such as the U.S. market opening session.
- Set price alerts to monitor key levels on higher timeframes, then look for entry opportunities on lower timeframes.
- Avoid chasing price spikes or dips; if prices rebound briefly, wait for a pullback to a reasonable range before considering entry.
- Build experience and confidence through backtesting historical charts.
You can also combine other technical indicators, such as moving averages and oscillators, to further confirm signals. Combining multiple signals helps improve the accuracy of trading decisions.
Stop-Loss Recommendations
When setting stop-loss strategies, you should adjust flexibly based on different market conditions. The table below summarizes commonly used stop-loss methods:
| Stop-Loss Position | Description |
|---|---|
| Above the High of the Bearish Engulfing Candlestick | Set the stop-loss above the high of the engulfing candlestick to prevent triggering from minor fluctuations. |
| Above the Recent High | If the engulfing candlestick is large, set the stop-loss above the high of the previous candlestick to increase the safety margin. |
In practice, you should adjust stop-loss positions flexibly based on your risk tolerance and market volatility. Reasonable stop-loss settings can effectively prevent losses and protect capital.
Common Pitfalls
When analyzing and applying candlestick patterns, you may encounter the following pitfalls:
- Over-reliance on candlestick patterns, ignoring the broader market context.
- Ignoring the overall trend, which can lead to misjudgments when focusing solely on patterns.
- Misinterpreting pattern meanings, assuming all patterns accurately reflect market movements.
- Ignoring confirmation signals, trading rashly without additional technical indicators or volume validation.
You can avoid misjudgments through the following methods:
- Wait for the next candlestick to close in the same direction to confirm signal validity.
- Check if the pattern appears near key support or resistance levels.
- Combine volume changes to assess market participation and signal strength.
Studies show that reasonable risk management measures can significantly improve trading success rates. When trading, avoid relying solely on a single pattern; combine multiple technical indicators and market context for comprehensive judgment.
You have mastered the key methods for identifying and applying the bearish engulfing pattern. Historical data shows that in the U.S. market, after this pattern appears, the average return is +0.2% in the next week and +0.46% after one month, with upside probabilities of 59.3% and 68.1%, respectively.
| Time Period | Next Week Return | One-Month Return | Next Week Upside Probability | One-Month Upside Probability |
|---|---|---|---|---|
| 50 Years | +0.2% | +0.46% | 59.3% | 68.1% |
In practice, you can improve judgment accuracy by combining market context and technical indicators:
- Combining market context and technical indicators provides context and confirmation for the pattern, helping you better assess signal strength.
- You can identify key support and resistance levels to make more informed decisions.
- Automatically drawn red and green lines can serve as reliable support and resistance zones, aiding in judging price reversals.
You should continuously enhance risk prevention awareness and flexibly apply multiple signals to achieve higher success rates in trading.
FAQ
What is a bearish engulfing pattern?
You will see two candlesticks, with a large bearish candlestick fully engulfing a smaller bullish candlestick. This typically appears after an uptrend, signaling a potential price reversal.
Does a bearish engulfing pattern guarantee a price decline?
You cannot guarantee a price decline. You need to combine volume, trends, and other technical indicators to assess signal reliability.
How to judge signal strength using volume?
You can observe the trading volume of the second large bearish candlestick. If volume significantly increases, it indicates stronger selling pressure and a more reliable signal.
Can you rely solely on the bearish engulfing pattern for trading decisions?
You should not rely solely on this pattern. You need to combine moving averages, RSI, and market context for analysis to improve judgment accuracy.
How to set safer stop-losses in the U.S. market?
You can set the stop-loss above the high of the large bearish candlestick in the engulfing pattern. This effectively controls risk and avoids triggering from short-term fluctuations.
The Bearish Engulfing pattern, with its high 79% reversal success rate, is a crucial signal you must master in trading. It not only warns of a potential trend shift but also prompts you to adjust your strategy promptly to avoid being caught at the tail end of an uptrend. However, whether you’re using this pattern for precise short entries or risk hedging, an efficient, low-cost global trading channel is essential for capturing opportunities and mitigating risk.
BiyaPay is dedicated to providing you with this critical support. We enable seamless conversion between fiat and digital currencies (like USDT), helping you secure fast funding that bypasses complex channels. Deposits can arrive as quickly as the same day, ensuring you never miss a trading opportunity. For pattern traders who require quick execution, our stocks platform offers the low-cost benefit of zero fees on contract limit orders for position building, alongside the convenience of managing global assets through a single account. Furthermore, our Real-Time Exchange Rate Query tool lets you stay on top of currency dynamics and avoid hidden losses. Crucially, BiyaPay international remittance fees are as low as 0.5%, which can save you up to 90% compared to traditional banks.
Ready to open an account in 3 minutes for zero barriers to global investment, and execute your Bearish Engulfing trading strategy with lower costs and higher efficiency? Click to register with BiyaPay and start your journey of precise risk management and trading.
*This article is provided for general information purposes and does not constitute legal, tax or other professional advice from BiyaPay or its subsidiaries and its affiliates, and it is not intended as a substitute for obtaining advice from a financial advisor or any other professional.
We make no representations, warranties or warranties, express or implied, as to the accuracy, completeness or timeliness of the contents of this publication.


Contact Us
Company and Team
BiyaPay Products
Customer Services


is a broker-dealer registered with the U.S. Securities and Exchange Commission (SEC) (No.: 802-127417), member of the Financial Industry Regulatory Authority (FINRA) (CRD: 325027), member of the Securities Investor Protection Corporation (SIPC), and regulated by FINRA and SEC.
registered with the US Financial Crimes Enforcement Network (FinCEN), as a Money Services Business (MSB), registration number: 31000218637349, and regulated by FinCEN.
registered as Financial Service Provider (FSP number: FSP1007221) in New Zealand, and is a member of the Financial Dispute Resolution Scheme, a New Zealand independent dispute resolution service provider.