- EasyCard
- Trade
- Help
- Announcement
- Academy
- SWIFT Code
- Iban Number
- Referral
- Customer Service
- Blog
- Creator
What Does Beta in the Stock Market Mean? Understand the True Relationship between Risk and Return in One Article


Image Source: unsplash
When investing in stocks, you often come across the term “stock market Beta.” It is an important indicator for measuring a stock’s systematic risk, helping you assess the relationship between a stock’s price volatility and the overall market.
- When the Beta coefficient is 1, the stock’s volatility matches the market.
- A Beta coefficient less than 1 indicates the stock’s volatility is lower than the market.
- A Beta coefficient greater than 1 means the stock’s volatility is higher than the market.
By analyzing Beta values, investors can better balance risk and return, making wiser investment decisions.
| Evidence Type | Content |
|---|---|
| Historical Data | Studies show that during crises, the performance gap between high-Beta and low-Beta stocks widens, leading to increased portfolio volatility. |
| Data Analysis | Data from 1963 to 2012 indicates that portfolios of high-risk and low-risk stocks generate similar long-term returns. |
Key Takeaways
- Beta is a vital tool for assessing stock volatility. It helps you understand a stock’s relationship with the market and choose investments that align with your risk preferences.
- Stocks with a Beta greater than 1 have higher volatility than the market, suitable for investors seeking high returns. Stocks with a Beta less than 1 have lower volatility, better suited for those preferring stability.
- By calculating the overall Beta of a portfolio, you can understand the portfolio’s sensitivity to market fluctuations, optimizing risk management.
- Beta values change with market conditions and company performance, so regularly reviewing the latest Beta data ensures accurate investment decisions.
- Combining Beta with other risk metrics, such as Alpha and standard deviation, provides a comprehensive risk assessment, enhancing the scientific approach to asset allocation.
Stock Market Beta Definition

Image Source: pexels
What Is Beta
When investing, you often encounter the “stock market Beta” metric. It measures the relationship between a stock or fund’s price volatility and the overall market. You can consider the market’s overall Beta as 1, with other stocks’ Beta values measured against this benchmark. If a stock’s Beta is greater than 1, its price volatility is higher than the market; if less than 1, its volatility is lower.
The calculation of the Beta coefficient is clearly defined in finance. You can refer to the table below for common mathematical expressions of Beta:
| Beta Formula | Description |
|---|---|
| β = Cov(R_e, R_m) / Var(R_m) | The Beta coefficient is the ratio of the covariance between a specific stock’s returns and the market’s returns to the variance of the market’s returns. |
| r_{i,t} = β_{i} × r_{m,t} + error term | Beta is calculated through linear regression, representing the relationship between an asset’s returns and market returns. |
In practice, you typically use linear regression to estimate Beta. This process compares a stock’s historical returns with the market’s historical returns. Covariance and variance are two key statistical concepts: covariance measures the co-movement of two variables, while variance reflects a variable’s own volatility.
Using Beta values, you can quickly assess a stock’s risk level. For example, tech stocks in the U.S. market often have higher Beta values, indicating greater price volatility than the market. Utility stocks, on the other hand, typically have lower Beta values and less volatility.
Beta provides insight into the relationship between an individual stock’s volatility and the overall market. You can use it to compare the risk characteristics of different stocks.
Systematic Risk
When investing, besides focusing on individual company risks, you also need to consider market-wide risks. This is called systematic risk. Systematic risk refers to risks that cannot be eliminated through diversification. No matter how many stocks you hold, if the overall market declines, your investments will be affected.
Stock market Beta is a primary tool for measuring systematic risk. You can use Beta values to understand a stock’s sensitivity to overall market fluctuations.
Systematic risk mainly includes the following aspects:
- Market Risk: Risks arising from changes in the overall economic environment.
- Purchasing Power Risk: The risk of currency devaluation due to inflation.
- Interest Rate Risk: The impact of market interest rate changes on stock prices.
- Reinvestment Risk: The risk of earning lower returns on future reinvestments.
Empirical studies show that Beta is a highly effective tool for measuring systematic risk. For instance, researchers have estimated Beta using various statistical methods (such as mean absolute deviation and least squares) and found similar performance in estimating Beta and Alpha. Studies also found that during periods of market instability, a stock’s Beta value significantly increases, indicating heightened systematic risk.
When analyzing a portfolio, you can use stock market Beta to assess the overall risk level. High-Beta stocks typically fall more during market downturns, while low-Beta stocks are relatively stable.
Stocks with high Beta uncertainty generally underperform those with low Beta uncertainty, further supporting Beta’s effectiveness as a systematic risk measurement tool.
Beta Calculation

Image Source: pexels
Calculation Methods
When investing, you often need to know the Beta value of a stock or portfolio. You can use the following common methods to calculate it:
- You can calculate a single stock’s Beta by dividing covariance by variance. This method is suitable for stocks with historical price data.
- You can use the weighted average method to calculate a portfolio’s Beta. You need to find each stock’s Beta and weight, then sum them to get the overall Beta.
- You can also calculate manually: first determine each stock’s value and weight, find each stock’s Beta, and then compute the weighted average.
Different Beta calculation methods have their pros and cons. You can refer to the table below:
| Method | Advantages | Limitations |
|---|---|---|
| Regression Beta | Theoretically best represents a company’s risk, using its own market data. | May be biased in inefficient markets; cannot be used for companies without price data. |
| Industry Beta | Uses the average Beta of multiple companies, reducing market efficiency issues. | May lack representativeness if a company’s risk differs from the industry. |
| Peer Company Beta | Selects companies with similar risks for more precise estimation. | Requires industry knowledge and may lack industry Beta data. |
In practice, you typically choose the method best suited to your investment goals and data availability. For example, in the U.S. market, tech stocks often have higher Beta values, while utility stocks have lower ones. These methods allow you to quickly assess the risk level of different stocks or portfolios.
Tip: When calculating a portfolio’s Beta, remember to use each stock’s market value weights for more accurate results.
Capital Asset Pricing Model
When learning investment theory, you often encounter the Capital Asset Pricing Model (CAPM). CAPM is used to predict a stock’s expected return. Beta plays a central role in CAPM. You can refer to the table below for CAPM’s main variables:
| Variable | Description |
|---|---|
| E(R_i) | Expected return or cost of equity for the stock |
| R_f | Risk-free rate (e.g., U.S. Treasury yield) |
| β_i | Stock’s sensitivity to market return changes (stock market Beta) |
| E(R_m) | Expected market return |
| E(R_m) - R_f | Expected market risk premium |
You can understand it this way: the higher the Beta, the higher the stock’s expected return, but the risk also increases. For example, a stock with a Beta of 1.5 has volatility 150% of the market average. If the market’s average return is 8% and the risk-free rate is 3%, the stock’s expected return is 3% + 1.5 × (8%-3%) = 10.5%.
Empirical studies show that stock returns at night are positively correlated with Beta, indicating that Beta effectively reflects the risk-return relationship. When using CAPM, you can use Beta to determine whether a stock is worth investing in.
You can use CAPM and Beta to scientifically assess a stock’s risk and expected return, improving the rigor of investment decisions.
Beta Value Meanings
Greater Than 1, Less Than 1, Equal to 1
When analyzing stocks, you often encounter different Beta values. Each Beta value represents distinct risk and return characteristics. You can refer to the table below for a quick understanding:
| Beta Value | Relationship to Market Risk |
|---|---|
| β = 1 | Stock has the same risk as the market (no market sensitivity) |
| β > 1 | Stock has higher risk than the market (high market sensitivity) |
| β < 1 | Stock has lower risk than the market (low market sensitivity) |
You can understand it this way:
- When β = 1, the stock’s price moves in sync with the market. When you hold such stocks, the risk and return align with the overall market.
- When β > 1, the stock’s volatility is higher than the market. By choosing these stocks, you take on higher risk but also have the chance for higher returns. For example, some U.S. tech companies often have Beta values exceeding 1. When the market rises, these stocks gain more; when it falls, they lose more.
- When β < 1, the stock’s volatility is lower than the market. Investing in these stocks offers lower risk and more stable returns. U.S. utility companies typically have lower Beta values, suitable for those preferring conservative investments.
In practice, you can choose stocks with different Beta values based on your risk tolerance. If you seek high returns, consider high-Beta stocks. If you prioritize asset safety, opt for low-Beta stocks.
Beta measures how a stock’s price changes in response to the overall market. The market Beta is set at 1.0; a stock with a Beta of 1.20 typically fluctuates 20% more than the market average. A Beta of 0.70 fluctuates 30% less than the market average.
When analyzing historical data, note that Beta calculations depend on the chosen market index and time frame. Different indices and periods can affect Beta values. For example, using 60 months of monthly return data can more stably reveal an asset’s sensitivity to market fluctuations.
High-Beta stocks carry higher risk but also higher potential returns. Low-Beta stocks have lower risk but also lower potential returns.
Negative Beta
In portfolio management, you may encounter assets with negative Beta. A negative Beta means the stock or asset’s price moves inversely to the overall market. You can refer to the table below for real-world examples:
| Stock Name | Beta Value | Description |
|---|---|---|
| General Mills (GIS) | -0.01 | U.S. packaged food giant with stable long-term dividends. |
In the U.S. market, you may find that some mining and pharmaceutical companies often have negative Beta values. Last year, about half of the 285 companies with negative Beta values were from the mining and extraction industries. This year, the pharmaceutical industry accounts for over 50%.
You can use negative Beta assets to optimize portfolio risk. Negative Beta investments offer the following advantages:
- By including negative Beta assets (e.g., gold, put options) in your portfolio, you can mitigate systematic risk.
- Negative Beta assets often act as protective hedges during market uncertainty, helping you achieve better risk management.
- In a diversified strategy, negative Beta assets can effectively reduce overall volatility.
In practice, you can combine negative Beta assets with positive Beta assets based on your investment goals to enhance portfolio stability.
Negative Beta investments can help manage portfolio risk, enhancing diversification strategies.
When understanding stock market Beta, negative Beta is a unique but important concept. By allocating assets appropriately, you can improve your portfolio’s risk resistance.
Investment Applications
Risk Assessment
When investing, you can use stock market Beta to assess the risk level of individual stocks or an entire portfolio. Beta reflects an asset’s sensitivity to market fluctuations. You can perform risk assessments in the following ways:
- You can check a stock’s Beta value. A Beta greater than 1 indicates higher volatility than the market, suitable for those seeking high returns but willing to take greater risks. A Beta less than 1 suggests lower volatility, better for those preferring stability.
- You can calculate the overall Beta of a portfolio to understand the potential range of changes in your assets during market fluctuations. This allows you to adjust asset allocation based on your risk tolerance.
- You can use Beta as a measure of systematic risk. Systematic risk arises from the entire market, such as interest rate changes or economic cycles, and cannot be eliminated through diversification.
When assessing risk, you should not only focus on individual stock Betas but also consider the portfolio’s overall Beta to ensure your investment strategy aligns with your risk preferences.
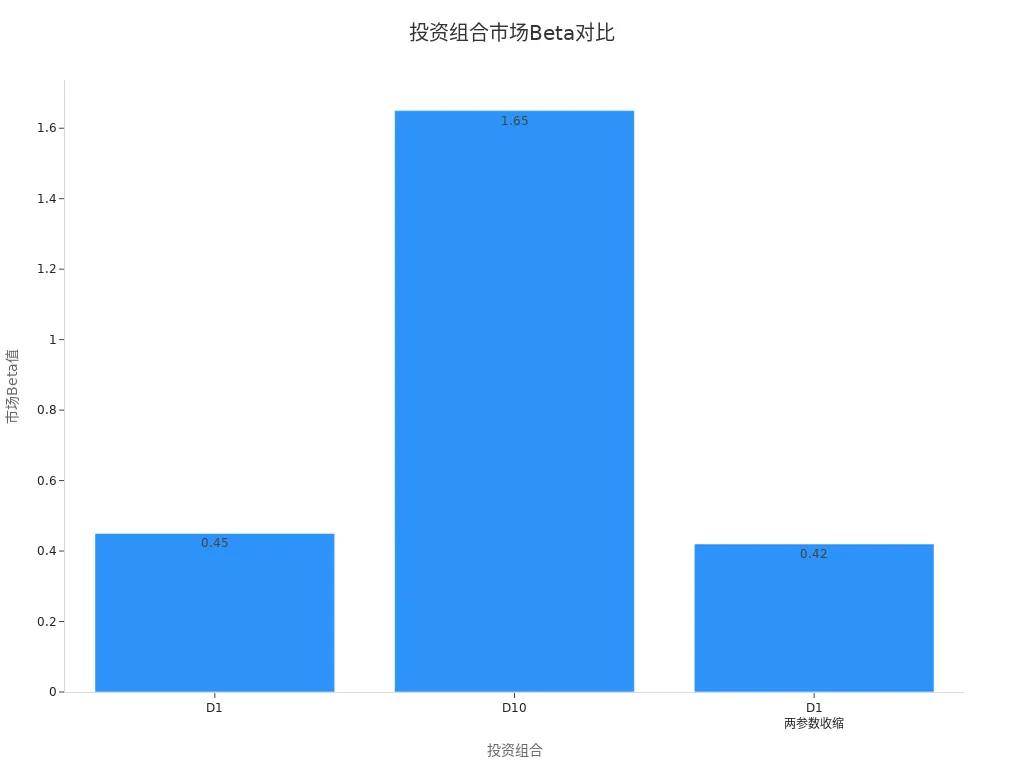
The table below illustrates the market Beta and risk-return characteristics of different portfolios:
| Portfolio | Average Excess Return | Volatility | Sharpe Ratio | Market Beta |
|---|---|---|---|---|
| D1 | 7.26% | 11.04% | 0.66 | 0.45 |
| D10 | 7.26% | 32.59% | 0.22 | 1.65 |
| Long-Short Portfolio | 10.14% | N/A | N/A | N/A |
You can use charts to more intuitively understand the market Beta distribution of different portfolios:
Portfolio Management
When managing a portfolio, you can use Beta as a key tool to optimize the risk-return structure. If you have a high risk tolerance, you can choose high-Beta stocks to pursue higher returns. If you prefer stability, you can allocate low-Beta stocks for greater consistency. By combining assets with different Beta values, you can optimize the overall risk-return profile.
Beta analysis not only helps you monitor industry-specific risk indicators but also allows you to dynamically adjust portfolio allocation based on market conditions. You can incorporate Beta analysis into a broader financial strategy, continuously updating methods to adapt to market trends. The table below summarizes common portfolio management methods:
| Key Method | Description |
|---|---|
| Monitor Industry-Specific Risk Indicators | Regularly monitor to assess risk changes |
| Adjust Portfolio Allocation Based on Market Conditions | Dynamically adjust to adapt to market fluctuations |
| Incorporate Beta Analysis into Broader Financial Strategies | Integrate Beta analysis to optimize investment decisions |
| Continuously Update Beta Methods | Ensure alignment with market trends |
Large U.S. institutions, such as the Missouri State Employees’ Retirement System and Delta Airlines’ pension fund, have long used Beta analysis to optimize asset allocation, significantly improving portfolio health. These cases demonstrate that properly applying Beta can help you achieve more scientific asset allocation and risk management goals.
Limitations
Scope of Application
When using Beta to assess stock risk, you need to understand its scope and limitations. Beta primarily measures the relationship between an asset’s volatility and the overall market, but it is not a universal tool. You can refer to the following points:
- Beta relies on historical data, making it a “rearview mirror” indicator that cannot accurately predict future volatility. When a company undergoes significant acquisitions or business changes, Beta values may shift rapidly.
- Beta assumes a linear relationship between a stock and the market, but real market dynamics are often nonlinear. In extreme market conditions or anomalies, Beta may not reflect true risk.
- Beta only addresses systematic risk, ignoring company-specific risks, such as management changes or industry competition pressures.
- Some industries consistently exhibit high or low Beta values, so relying solely on Beta for diversification may not fully cover industry-specific risks.
- Beta values are highly sensitive to the chosen market index. Different benchmarks can yield entirely different Beta results.
You can refer to the table below to understand Beta’s performance under different market conditions:
| Market Condition | Beta-Return Relationship |
|---|---|
| Rising Market | Positive correlation |
| Falling Market | Negative correlation |
In practice, you cannot rely solely on Beta to assess risk. Beta’s variability and limitations make it only a reference tool.
Other Risk Factors
When evaluating portfolio risk, you should combine multiple indicators. While Beta is important, it cannot cover all risk types. You can refer to the following commonly used risk indicators:
- Alpha: Measures an asset’s excess return relative to a benchmark, helping you assess a manager’s ability.
- Standard Deviation: Reflects the volatility of investment returns; lower standard deviation indicates lower risk.
- Sharpe Ratio: Measures risk-adjusted returns, considering both return and volatility.
- Sortino Ratio: Focuses on downside risk, helping you address negative returns.
- Treynor Ratio: Evaluates risk-adjusted returns, used in conjunction with Beta.
- Value at Risk (VaR): Quantifies potential losses at a specific confidence level and time frame.
- Maximum Drawdown: Measures the largest loss from peak to trough, helping you understand extreme risk.
When analyzing a portfolio, you can combine Beta with Alpha, standard deviation, and other indicators for a more comprehensive risk assessment. For example, Jensen’s Alpha can help you determine whether a manager truly generates excess returns, while standard deviation reveals overall volatility.
In practice, it’s recommended to combine multiple risk indicators to enhance the rigor and safety of investment decisions.
When investing, you can use stock market Beta to understand the true relationship between risk and return.
- Beta is a key tool for assessing stock volatility, helping you make choices based on risk preferences.
- Beta value calculations reflect the relationship between a stock’s returns and market returns.
- You can use Beta to adjust your portfolio, optimizing risk management.
| Strategy Type | Description | Expected Outcome |
|---|---|---|
| Portable Alpha | Utilizes multiple alpha streams to enhance portfolio potential. | Optimizes capital efficiency |
| Smart Beta | Employs rule-based strategies to provide risk premium exposure. | Enhances return potential |
You can combine Beta with other risk indicators for a comprehensive risk assessment. Applying Beta knowledge to real-world investments can help you improve asset allocation and risk management capabilities.
FAQ
What Is a Beta Value?
You can use a Beta value to measure a stock’s volatility relative to the overall market. A Beta of 1 means the stock’s volatility matches the market. A Beta greater than 1 indicates higher volatility, while a Beta less than 1 suggests lower volatility.
Beta values help you quickly assess a stock’s risk level.
Does Beta Value Change Over Time?
You’ll find that Beta values adjust with market conditions, company performance, and industry changes. You need to regularly review the latest Beta data to ensure accurate investment decisions.
Market fluctuations and major company events can affect Beta values.
How to Apply Beta in a Portfolio?
You can calculate a portfolio’s overall Beta to understand its sensitivity to market fluctuations. Based on your risk preferences, you can choose high-Beta or low-Beta assets to optimize portfolio structure.
| Beta Type | Suitable Investors |
|---|---|
| High Beta | Those seeking high returns |
| Low Beta | Those preferring stability |
Can Beta Values Predict Future Returns?
You cannot use Beta values to directly predict future returns. Beta primarily reflects risk levels. You need to combine it with other indicators, such as Alpha and standard deviation, to comprehensively assess investment returns.
Beta is a risk tool, not a return prediction tool.
Which Assets Might Have Negative Beta?
In the U.S. market, you may see assets like gold, put options, or certain mining companies with negative Beta. These assets may rise when the market falls, helping you diversify investment risk.
Negative Beta assets can enhance portfolio stability.
Beta is your essential tool for quantifying systematic risk, guiding your decision to seek higher volatility (Beta > 1) or greater stability (Beta < 1). But a smart portfolio structured around Beta only succeeds if you can fund your trades quickly and execute efficiently without the drag of high costs.
To ensure your calculated risk translates into actual returns, integrate the financial agility of BiyaPay into your strategy. Our platform supports the swift, mutual conversion between fiat and digital assets like USDT, providing you with the fastest, most reliable pathway to fund your brokerage accounts for timely asset rebalancing.
You can register quickly—in just 3 minutes without requiring an overseas bank account—and gain seamless access to US and Hong Kong Stocks. Leverage our real-time exchange rate checks to maintain full transparency and control over your international trading funds. Open your account today and gain the speed and cost efficiency needed to manage risk and maximize reward according to your personal Beta preference.
*This article is provided for general information purposes and does not constitute legal, tax or other professional advice from BiyaPay or its subsidiaries and its affiliates, and it is not intended as a substitute for obtaining advice from a financial advisor or any other professional.
We make no representations, warranties or warranties, express or implied, as to the accuracy, completeness or timeliness of the contents of this publication.


Contact Us
Company and Team
BiyaPay Products
Customer Services


is a broker-dealer registered with the U.S. Securities and Exchange Commission (SEC) (No.: 802-127417), member of the Financial Industry Regulatory Authority (FINRA) (CRD: 325027), member of the Securities Investor Protection Corporation (SIPC), and regulated by FINRA and SEC.
registered with the US Financial Crimes Enforcement Network (FinCEN), as a Money Services Business (MSB), registration number: 31000218637349, and regulated by FinCEN.
registered as Financial Service Provider (FSP number: FSP1007221) in New Zealand, and is a member of the Financial Dispute Resolution Scheme, a New Zealand independent dispute resolution service provider.