- EasyCard
- Trade
- Help
- Announcement
- Academy
- SWIFT Code
- Iban Number
- Referral
- Customer Service
- Blog
- Creator
Hammer Candlestick: How to Correctly Interpret this Crucial Reversal Signal?


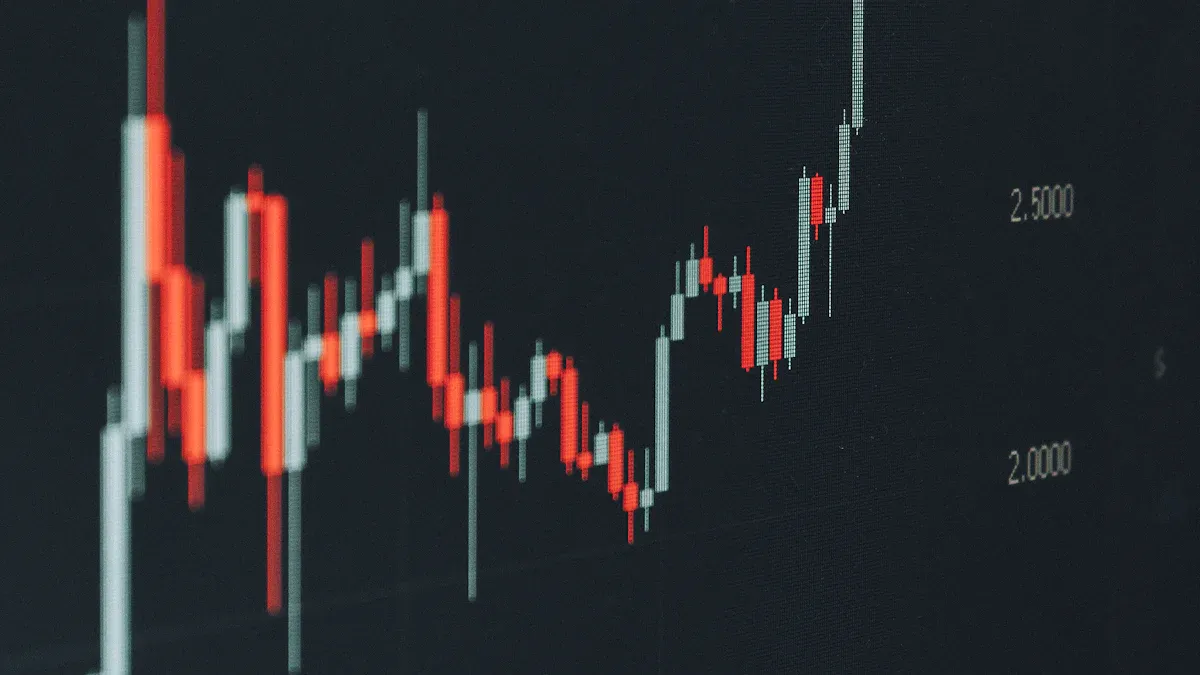
Image Source: pexels
When analyzing the market, you often encounter the hammer candlestick. It holds significant importance in a downtrend, especially when the price reaches a key support level. This pattern typically indicates that seller momentum is weakening, buyers are stepping in, and the market has tested lower prices but failed to sustain them, with buyers ultimately pushing the price higher. Correctly identifying the hammer candlestick can help you improve your trading success rate and strengthen risk management.
Key Takeaways
- The hammer candlestick is a bullish reversal signal in a downtrend, often appearing at key support levels, indicating buyer intervention.
- When identifying a hammer candlestick, note its characteristics: a small body, a long lower shadow, and little to no upper shadow, which reflect changes in market sentiment.
- Combining other technical indicators (such as volume, RSI, and MACD) with the hammer candlestick can enhance the signal’s accuracy and reliability.
- After confirming the hammer candlestick signal, set reasonable stop-loss and profit targets to effectively manage trading risks.
- The effectiveness of the hammer candlestick is influenced by market conditions and volume, requiring a comprehensive consideration of multiple factors to make informed trading decisions.
Hammer Candlestick Definition
Reversal Signal
When analyzing the market, you often see the hammer candlestick appear at the end of a downtrend. It is a typical bullish reversal signal. You can quickly understand the basic characteristics and formation conditions of the hammer candlestick through the following table:
| Feature | Description |
|---|---|
| Type | Bullish indicator |
| Shape | Small body at the top, long lower shadow, little to no upper shadow |
| Meaning | Indicates buyers successfully pushed the price up from the low, suggesting a shift in market sentiment, potentially from a downtrend to an uptrend. |
| Formation Conditions | The asset falls significantly after the open but closes near the opening price, forming a hammer-shaped candle. |
| Shadow Proportion | The lower shadow is at least twice the size of the body. |
The visual characteristics of the hammer candlestick are also distinct:
| Feature | Description |
|---|---|
| Lower Shadow Length | Should be at least twice the size of the body, reflecting extreme selling pressure. |
| Body Size | The body should be small, typically no more than one-quarter or one-third of the lower shadow, indicating intense conflict between bulls and bears. |
| Upper Shadow Presence | Must have a very small or no upper shadow, showing that buyers were able to push the price back near the opening level. |
You can use these characteristics to quickly identify the hammer candlestick and determine if it meets the conditions for a reversal signal. In various financial markets, the hammer candlestick is considered an important trend reversal signal. The following table shows interpretations of the hammer candlestick’s reversal significance from major financial institutions and analysis platforms:
| Source | Key Insight |
|---|---|
| Corporate Finance Institute | The hammer candlestick pattern is seen as a potential bullish reversal signal, especially after a prolonged downtrend, when it appears at a known price support level. |
| Stockgro | The hammer candlestick pattern indicates significant buying pressure after a price decline, potentially leading to a shift in market sentiment. |
| FXOpen | The hammer candlestick pattern is regarded as an important tool for trend reversal in technical analysis, particularly when formed at technical support levels. |
You can see that the hammer candlestick holds high reference value across different market conditions.
Market Significance
The hammer candlestick is not just a pattern on a chart; it also reflects changes in market sentiment and investor psychology. You can understand its market significance from the following aspects:
- When a hammer candlestick appears in a downtrend, it indicates that bearish sentiment may be weakening.
- The long lower shadow shows that sellers initially pushed the price down, but by the end of the trading day, the price recovered.
- This change suggests a more bullish outlook, laying the foundation for a potential reversal.
When analyzing in practice, you can use the appearance of a hammer candlestick to gauge whether market sentiment is shifting. Many traders and analysts closely monitor the formation of hammer candlesticks, as they often indicate that buyers are starting to support the price, and the market may be poised for a rebound.
- The formation of the hammer candlestick pattern is interpreted as a potential bullish reversal signal.
- The small body and long lower shadow indicate that despite selling pressure, buyers have regained control of the market.
- This pattern typically appears after a downtrend, suggesting that buyers are starting to support the price, potentially leading to a shift in market sentiment.
The reliability of the hammer candlestick is also supported by data. You can refer to the accuracy statistics chart below to understand its performance among various candlestick patterns:

From the chart, it is clear that the hammer candlestick has an accuracy rate of 59.86%, higher than other common reversal patterns. This indicates that when analyzing the market, the hammer candlestick has significant reference value as a reversal signal.
Pattern and Identification

Image Source: pexels
Pattern Characteristics
When analyzing price charts, you can quickly understand the typical characteristics of the hammer candlestick through the following table:
| Feature | Description |
|---|---|
| Body Size | The body should be small, typically green (bullish) or red (bearish). |
| Lower Shadow Length | The lower shadow should be at least twice the length of the body, ideally three to four times. |
| Upper Shadow Length | The upper shadow should be very small or nearly nonexistent. |
The body of the hammer candlestick is small, indicating intense competition between buyers and sellers. The long lower shadow shows that sellers initially dominated, but buyers ultimately pulled the price back. You will find that, regardless of whether the body is green or red, this pattern may signal a shift in market sentiment.
You need to note that a red hammer candlestick, although appearing bearish, can also reflect strengthening buyer momentum. In the market, a red hammer candlestick often means that selling pressure was absorbed by buyers, with the price ultimately returning near the opening price. Many traders may misjudge a red candlestick, overlooking the true meaning behind the price action.
Identification Method
You can follow these steps to accurately identify a hammer candlestick on a price chart:
- Identify the hammer pattern: First, observe whether a candle with a small body and long lower shadow appears and note its color.
- Confirm: The hammer candlestick is only valid if subsequent price action shows signs of a reversal.
- Place a trade: Once the pattern is confirmed, consider entering a position above the hammer’s high.
- Take profits: Exit the trade when the price reaches the expected target.
When operating in practice, it’s recommended to combine the market context and other technical indicators to avoid relying solely on the hammer candlestick signal.
Difference from Inverted Hammer
When studying candlestick patterns, you often encounter the inverted hammer. While the hammer candlestick and inverted hammer are similar in shape, their meanings and positions differ:
- The hammer candlestick appears at the end of a downtrend, with the body at the top, a long lower shadow, and a very short or no upper shadow, signaling a potential upward reversal.
- The inverted hammer also has a small body but features a long upper shadow and a short or no lower shadow, typically appearing at the end of a downtrend, also potentially signaling a reversal but with slightly weaker strength.
You need to observe the position of the body and shadows, combined with the market context, to accurately distinguish these two patterns.
Market Changes
Sentiment Shift
When you see a hammer candlestick in the market, you can often sense a clear change in sentiment. In a downtrend, seller momentum gradually weakens, and buyers start to intervene. Market sentiment shifts from panic and pessimism to cautious optimism. You can understand this shift through the following points:
- The hammer candlestick pattern often appears at the end of a downtrend, signaling a bullish reversal.
- This pattern reflects a change in market sentiment, with buyers stepping in to push the price higher.
- Although selling pressure exists initially, buyer strength gradually increases, and the market begins to test the bottom.
When analyzing, remember that the hammer candlestick is a single signal, and subsequent price action and other technical indicators can further confirm the sentiment shift.
Price Movement
After a hammer candlestick appears, the price typically shows significant changes. You can understand the typical price movements following a hammer candlestick in different asset classes through the table below:
| Pattern Feature | Price Behavior Description |
|---|---|
| Appears at the bottom of a downtrend | Buyers push the price higher, forming a small body and long lower shadow. |
| Bullish candle the next day | Typically confirms the reversal pattern, with the price likely to rise further. |
When observing in practice, you will find that if a bullish candle follows the hammer candlestick, the reversal signal strengthens, and the likelihood of a market uptrend increases.
Influencing Factors
The effectiveness of the hammer candlestick is influenced by various external factors. You can refer to the table below to understand which factors enhance or weaken its signal:
| External Factor | Impact Description |
|---|---|
| Overall Market Conditions | Broader market conditions and news can affect the effectiveness of technical patterns. |
| Volume during Hammer Formation | Higher volume enhances the pattern’s validity, indicating market participation. |
| Volume Confirmation | Increased volume in subsequent candles can further validate the reversal signal. |
| Relative Strength Index (RSI) | The hammer signal is more reliable when RSI is in the oversold zone. |
When analyzing the hammer candlestick, combining these factors can provide a more comprehensive judgment of market changes and signal reliability.
Hammer Candlestick Trading Strategies
Entry and Exit
In actual trading, you can use the hammer candlestick signal in various ways for entry and exit. Here are some common and effective strategies:
- When you spot a hammer pattern near a key support level, consider going long after the price breaks above the hammer’s high. For example, in the U.S. stock market, if the S&P 500 index forms a hammer candlestick at a significant support level and the price breaks above the hammer’s high the next day, you can choose to enter. Set the stop-loss below the hammer’s low to control risk.
- If you combine moving averages for analysis, when the price pulls back to the 50-day moving average and forms a hammer pattern, it often signals a potential trend resumption. Enter after the price breaks the hammer’s high, with the stop-loss set below the hammer’s low.
- You can also combine the RSI indicator. When the price hits a new low but RSI does not (showing divergence) and a hammer candlestick appears, this is typically a reversal signal. Enter above the hammer’s high, with the stop-loss below the low.
- When a hammer pattern forms near key Fibonacci retracement levels (e.g., 61.8%), it can serve as an entry basis. Place a buy order above the hammer’s high, with the stop-loss below the low.
- If you combine the MACD indicator, a hammer candlestick at a support zone, paired with the MACD line crossing above the signal line, strengthens the entry signal. Enter above the hammer’s high, with the stop-loss below the low.
In actual trading, always wait for the hammer candlestick to be confirmed before entering. Confirmation typically occurs when the next candle closes above the hammer’s high. This can effectively filter false signals and improve trading success.
Risk Management
When trading the hammer candlestick, risk management is critical. Professional traders typically follow these steps:
- Identify the hammer pattern, ensuring it appears after a downtrend.
- Wait for the next candle to confirm the reversal, such as a long bullish candle or a gap-up open.
- Enter at the open of the next trading session after confirmation.
- Place a stop-loss order below the hammer’s lower shadow to protect your capital if the price moves against you.
- Set profit targets based on your trading strategy. A common approach is to set the target at twice the stop-loss distance. For example, if your stop-loss is $2, the profit target can be $4.
When operating in the U.S. stock market, strictly adhering to stop-loss and profit targets helps maintain long-term capital safety and stable returns.
You can practice risk management through simulated trading to gradually develop your own trading discipline.
Indicator Combinations
When analyzing the hammer candlestick, combining other technical indicators can significantly improve signal accuracy. The table below summarizes the effectiveness of common indicator combinations with the hammer pattern:
| Indicator Combination | Signal Strength | Optimal Timeframe |
|---|---|---|
| Volume + Pattern | 75% accuracy | Daily |
| RSI + Pattern | 71% accuracy | 4-hour |
| MACD + Pattern | 68% accuracy | Weekly |
You can see that combining volume with the hammer candlestick yields the most reliable signals. RSI and MACD combinations also enhance judgment accuracy. In actual trading, you can choose the appropriate indicator combination based on different timeframes.
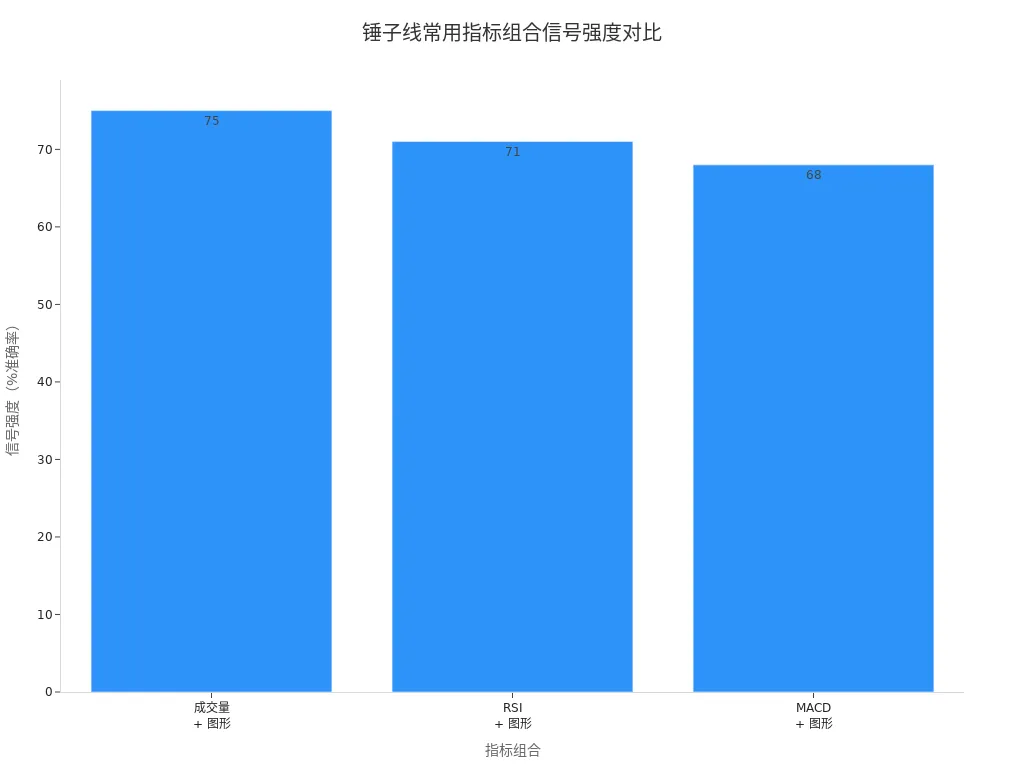
When analyzing the U.S. stock market, prioritize volume changes. If a hammer candlestick is accompanied by increased volume, the reversal signal is stronger. You can also use RSI to identify oversold zones or MACD to confirm trend changes.
By using scientific entry and exit strategies, strict risk management, and multiple indicator combinations, you can significantly improve the success rate of hammer candlestick trading.
Case Studies

Image Source: pexels
Success Cases
When analyzing the U.S. stock market, you often encounter reversal opportunities from hammer candlesticks. For example, with the S&P 500 index, a hammer pattern formed at a key support level, followed by a strong price rebound. You can review the historical return distribution after hammer patterns through the table below:
| Signal Type | Return (USD) |
|---|---|
| Hammer | -0.689 |
| Hammer | -0.487 |
| Hammer | 0.74 |
| Hammer | -0.407 |
| Hammer | -0.220 |
| Hammer | 0.61 |
| Hammer | -0.243 |
| Hammer | -0.117 |
| Hammer | 0.59 |
| Hammer | -0.103 |
| Hammer | -0.029 |
| Hammer | 0.53 |
You can see that while some trades resulted in small losses, positive returns are also evident. The bar chart below shows the return distribution of these historical cases:
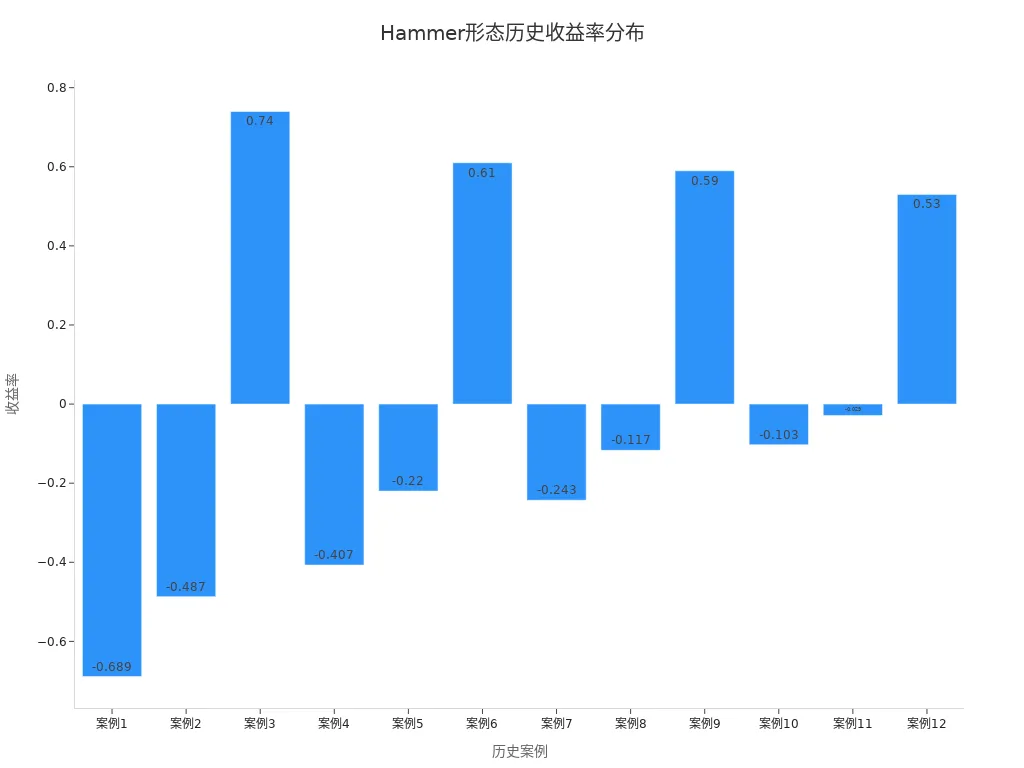
From these data, you can see that the hammer candlestick has some reference value during trend reversals, especially when formed at key support levels with increased volume, where success probability is higher.
Failure Cases
In actual trading, you may also encounter situations where the hammer pattern fails. Common reasons include:
- Lack of follow-through: If the next candle after the hammer fails to close above its high, buying pressure is insufficient, and the reversal fails.
- Lack of volume confirmation: A hammer pattern with low trading volume and weak price movement struggles to form a strong reversal.
- Formation in a choppy market: A hammer pattern in a sideways or volatile market is less reliable.
- Proximity to major resistance: If the hammer forms below a strong resistance level, the price may struggle to break through, leading to a failed reversal attempt.
When analyzing, be cautious of these factors to avoid blindly following a single signal.
Insights
You can draw the following lessons from successful and failed cases:
- Combine with support levels: A hammer pattern formed at key support levels is more reliable as a reversal signal.
- Wait for confirmation: After a hammer signal appears, wait for a subsequent bullish candle or higher close to filter out false signals.
- Review historical context: Examining an asset’s historical response to hammer patterns helps you better understand market behavior.
- Monitor market sentiment: When overall market sentiment is bearish, the reliability of hammer signals decreases.
- Use technical indicators for confirmation: Indicators like the stochastic oscillator or Fibonacci retracement can provide additional support for reversal signals.
By applying these methods, you can enhance your understanding and application of hammer candlestick signals, improving the rationality of your trading decisions.
Advantages, Limitations, and Misconceptions
Advantages and Limitations
When analyzing the market, the hammer candlestick provides an intuitive reversal signal. It has the following advantages and limitations:
- Advantages:
- The pattern is simple and easy to identify.
- It helps you seize entry opportunities at the start of a new trend, potentially yielding profits.
- Limitations:
- It is subjective. You may have doubts about the shadow length and body size.
- There is no guaranteed reversal. The hammer pattern may sometimes only test a downside breakout, with the downtrend continuing afterward.
- Identification depends on the candle’s open and close positions, and signals may vary across different timeframes.
- Improper stop-loss placement can lead to excessive risk.
Common Misconceptions
In actual trading, you may encounter the following misconceptions:
- Mistaking all small-body, long-lower-shadow candles as hammer candlesticks. Only those appearing after a clear downtrend are valid.
- Ignoring confirmation signals. Entering immediately upon seeing a hammer pattern can lead to false reversals.
- Neglecting market context. Relying solely on the candlestick pattern without considering the broader market environment can lead to inaccurate judgments.
You need to remind yourself that market context and subsequent price action are equally important.
Improvement Suggestions
You can improve the effectiveness of hammer candlestick application through the following methods:
- Combine with other technical analysis tools, such as moving averages, volume, and trendlines, rather than relying solely on candlestick patterns.
- Set reasonable stop-loss points to protect account safety.
- Analyze signals on larger timeframes (e.g., 1-hour, 4-hour, daily) to avoid noise interference.
- Wait for the next candle to confirm the reversal signal.
- Monitor the overall market trend and major news events to avoid unexpected risks.
- Strong volume and clear trend conditions can significantly enhance signal reliability.
By applying these methods, you can more scientifically interpret hammer candlestick signals and improve the accuracy of your trading decisions.
The hammer candlestick provides an intuitive reversal signal, but you need to interpret it correctly to enhance your trading judgment. You can combine real-world cases and various technical analysis tools to deepen your market understanding. The table below summarizes conclusions from different studies on the effectiveness of the hammer pattern, helping you view the signal rationally:
| Study | Conclusion |
|---|---|
| Caginalp & Laurent (1998) | Some three-day patterns have short-term predictive power. |
| Marshall, Young & Rose (2006) | 28 common candlestick patterns show no real advantage. |
| Lu & Shiu (2012) | Some bullish reversal patterns are profitable in Taiwan’s inefficient market. |
| Orquín et al. (2020) | No significant advantage after accounting for trading costs. |
| Ho et al. (2021) | Most patterns perform worse than random. |
When learning and practicing, you can adopt the following methods to continuously improve:
- Practice through simulated trading to gain experience.
- Backtest historical charts to verify pattern effectiveness.
- Continuously learn new knowledge to broaden your analysis perspective.
- Seek mentorship for practical insights.
- Identify a downtrend.
- Focus on the low points of each decline.
- Compare the low points with the RSI indicator.
- Identify divergence when the price hits a new low but RSI does not.
- Confirm RSI when a hammer candle appears at the low.
- Buy when the price breaks above the hammer’s high.
- Set the stop-loss below the hammer’s low.
- Set a reasonable profit target.
Only through continuous learning and practice can you truly master the application of the hammer candlestick and gradually optimize your trading system.
FAQ
What is the best timeframe for identifying a hammer candlestick?
You can identify hammer candlesticks on larger timeframes like daily or 4-hour charts. Larger timeframes produce more reliable signals. Shorter timeframes are prone to noise, which can distort signals.
Which markets is the hammer candlestick suitable for?
You can apply the hammer candlestick in various markets, including stocks, forex, futures, and cryptocurrencies. As long as the market exhibits clear trends, the hammer pattern has reference value.
How does a hammer candlestick differ from an inverted hammer?
You will notice that a hammer candlestick has a long lower shadow and a body at the top, commonly appearing at the end of a downtrend. An inverted hammer has a long upper shadow and a body at the bottom, with slightly weaker signal strength.
How can you confirm the validity of a hammer candlestick signal?
You can wait for the next candle to close above the hammer’s high. Increased volume and support from technical indicators make the signal more reliable.
The Hammer candlestick is a powerful indicator of a potential bullish reversal, providing you with a high-conviction entry point at the end of a downtrend. But the success of this strategy hinges on your ability to execute instantly and manage your capital with maximum agility when the confirmation candle appears.
To ensure your trading acts as quickly as the market reversal, integrate the efficiency of BiyaPay into your system. We offer zero commission for contract limit orders, a critical advantage that significantly lowers the cost of precision entries and exists based on candlestick patterns.
Our platform supports the swift, mutual conversion between fiat and digital assets like USDT, ensuring your trading capital is funded instantly and efficiently. You can register quickly—in just 3 minutes without requiring an overseas bank account—and gain seamless access to US and Hong Kong Stocks to apply your Hammer analysis. Leverage our real-time exchange rate checks to maintain full transparency and control over your international trading funds. Open your account today and turn candlestick signals into reliable profit.
*This article is provided for general information purposes and does not constitute legal, tax or other professional advice from BiyaPay or its subsidiaries and its affiliates, and it is not intended as a substitute for obtaining advice from a financial advisor or any other professional.
We make no representations, warranties or warranties, express or implied, as to the accuracy, completeness or timeliness of the contents of this publication.


Contact Us
Company and Team
BiyaPay Products
Customer Services


is a broker-dealer registered with the U.S. Securities and Exchange Commission (SEC) (No.: 802-127417), member of the Financial Industry Regulatory Authority (FINRA) (CRD: 325027), member of the Securities Investor Protection Corporation (SIPC), and regulated by FINRA and SEC.
registered with the US Financial Crimes Enforcement Network (FinCEN), as a Money Services Business (MSB), registration number: 31000218637349, and regulated by FinCEN.
registered as Financial Service Provider (FSP number: FSP1007221) in New Zealand, and is a member of the Financial Dispute Resolution Scheme, a New Zealand independent dispute resolution service provider.