- EasyCard
- Trade
- Help
- Announcement
- Academy
- SWIFT Code
- Iban Number
- Referral
- Customer Service
- Blog
- Creator
What are Oscillators: Master Key Usages and Practical Skills to Easily Judge Market Rhythms


Image Source: unsplash
When trading, you often ask, what are oscillators? In fact, oscillators are a type of technical tool used to measure market momentum and identify overbought or oversold conditions. You can use them to capture price reversal signals, helping to gauge market rhythm. However, interpreting these signals can present some challenges:
- You might misinterpret overbought or oversold signals, leading to incorrect decisions.
- Ignoring market context and relying solely on oscillators can lead to misinterpretation of signals.
- Over-reliance on oscillators without combining them with other analytical tools can reduce their effectiveness.
- Using inappropriate parameter settings can diminish the indicator’s effectiveness.
- Ignoring divergence and crossover signals may cause you to miss trading opportunities.
Mastering the correct use of these tools can enhance your trading judgment.
Key Takeaways
- Oscillators help you identify overbought and oversold market conditions, spotting potential price reversal signals.
- Combining oscillators with other technical analysis tools can improve trading decision accuracy and avoid misjudgments.
- In range-bound markets, using shorter-period oscillators can capture price reversal signals more quickly.
- Regularly optimizing oscillator parameters ensures they adapt to current market conditions, improving trading outcomes.
- Pay attention to market context and avoid relying solely on oscillators to reduce losses from false signals.
What Are Oscillators

Image Source: pexels
Definition and Characteristics
When learning technical analysis, you often encounter the question, “What are oscillators?” Oscillators are a class of technical tools specifically designed to measure price momentum in financial markets. You can use them to determine whether asset prices are too high or too low, thereby identifying overbought and oversold market conditions. The key characteristic of oscillators is that their values fluctuate within a fixed range, typically between 0 and 100. For example, the Relative Strength Index (RSI) and Stochastic Oscillator fall into this category.
Core characteristics of oscillators include:
- Oscillation values: Values fluctuate within a specific range, making it easy for you to intuitively assess market conditions.
- Overbought and oversold levels: Commonly set at 70 and 30, respectively, indicating potential market overheating or cooling.
- Fluctuation around a centerline or set level, helping you capture short-term price movements.
- Ideal for identifying potential market turning points, especially in range-bound markets.
Unlike trend-following indicators (such as moving averages), oscillators do not move in a single direction continuously but fluctuate around a centerline. This characteristic allows you to better grasp market rhythm, especially during sideways or range-bound price movements, where oscillators can provide clearer buy and sell signals.
You might be curious about the historical development of oscillators. As early as the late 1940s to 1950s, the field of technical analysis began exploring these tools. For instance, George Lane developed the famous Stochastic Oscillator in the 1950s, promoting the widespread use of oscillators in financial markets.
Role and Advantages
The most direct role of using oscillators is to determine whether the market is in an overbought or oversold state. For example, when RSI exceeds 70, the market may be overheated, with prices rising too quickly and a potential pullback looming; when RSI falls below 30, the market may be undervalued, with prices falling too fast, increasing the likelihood of a rebound. These signals are particularly effective in range-bound markets.
- What are oscillators? They are powerful tools that help you grasp market rhythm and capture reversal signals.
- You can identify high-probability buy or sell opportunities by recognizing overbought and oversold zones.
- Oscillators can be combined with different timeframes to help you filter higher-quality entry points.
- Using oscillators alongside other technical analysis tools (such as price action or trendlines) can significantly improve trading decision accuracy.
The table below highlights research findings from academia and industry on the effectiveness of oscillators:
| Research Topic | Research Method | Key Findings |
|---|---|---|
| Financial Time Series Forecasting Based on Oscillator Models | Using a damped driven oscillator model | In the U.S. stock market, this model achieved a 64.80% return on investment, outperforming a random model by 72.19%. |
You can also refer to the chart below to understand the performance of different oscillators in terms of prediction accuracy:
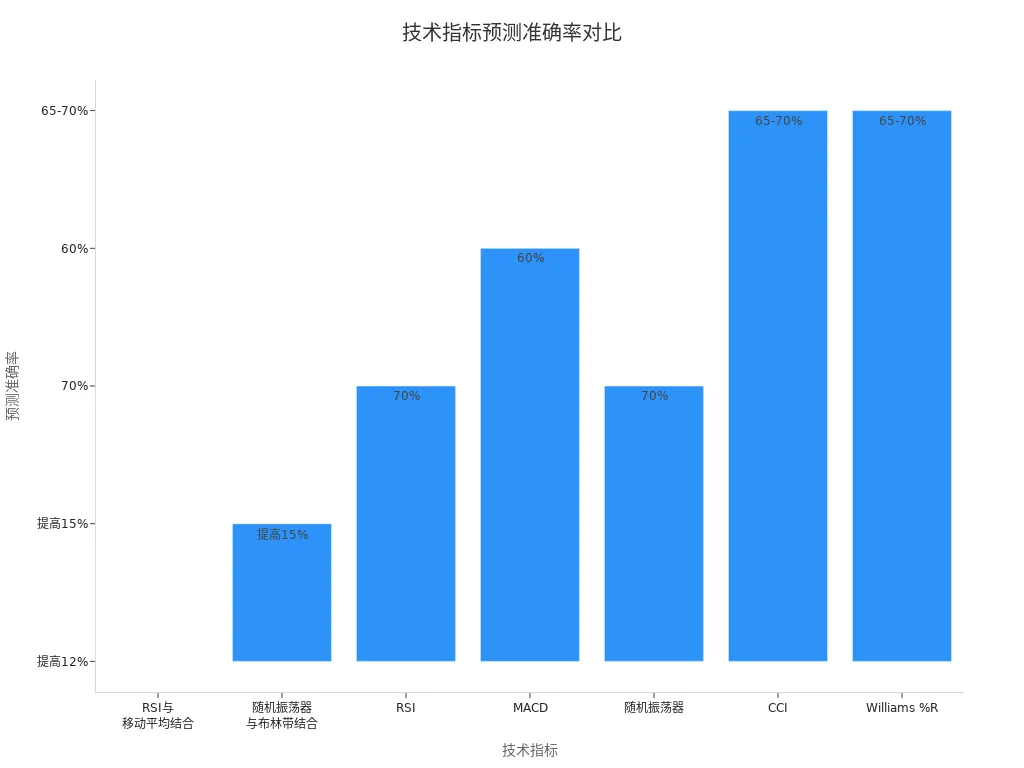
The advantages of oscillators lie not only in their intuitive signals and ease of use but also in their ability to significantly improve your trading success rate. By understanding the meaning of signals and applying them flexibly in the context of the market, you can achieve higher win rates in practice.
However, you should also note that relying solely on oscillators may have limitations. For example, in strong trending markets, oscillators may frequently issue reversal signals, causing you to miss opportunities in the main trend. Therefore, combining oscillators with other analytical tools is essential to maximize their effectiveness.
How Oscillators Work and Their Types
Operating Mechanism
When learning what oscillators are, you first need to understand their operating mechanism. Oscillators fluctuate within a fixed range, helping you assess market momentum and price conditions. Most oscillators’ values range between 0 and 100, allowing you to intuitively see whether the market is in an extreme state. For example, RSI and Stochastic Oscillators operate in this manner.
The frequency of an oscillator is primarily determined by its internal structure and can typically be adjusted only within a very narrow range. For instance, the frequency of a crystal oscillator varies within a very small range, ensuring signal stability.
You can refer to the table below to understand the principle of oscillators operating within a fixed range:
| Oscillator Type | Control Method | Frequency Adjustment Range |
|---|---|---|
| OCXO (Oven-Controlled Crystal Oscillator) | Temperature control | Extremely small (a fraction of a percent) |
Momentum oscillators also help you identify overbought and oversold signals by calculating the speed of price changes. You can use crossovers and thresholds to determine buy or sell opportunities. For instance, when prices reach new highs but the momentum indicator fails to follow, a bearish divergence may occur, signaling a potential market reversal.
Common Types
In practice, you will encounter various types of oscillators. The table below summarizes the most commonly used types in technical analysis and their primary functions:
| Oscillator Name | Function Description |
|---|---|
| Relative Strength Index (RSI) | Measures the speed and change of price movements, identifying overbought or oversold conditions |
| Stochastic Oscillator | Compares closing prices to a price range over a specific period, capturing reversal points |
| MACD | Shows the relationship between two moving averages, generating buy or sell signals |
| Commodity Channel Index (CCI) | Measures the deviation of prices from their average, aiding in identifying extreme market conditions |
| Williams %R | Measures overbought and oversold conditions, suitable for capturing trend reversals |
You can see that different oscillators have their own characteristics. For example, RSI values range between 0 and 100, with values above 70 indicating overbought and below 30 indicating oversold. The Stochastic Oscillator is more sensitive, with overbought lines typically set at 80 and oversold lines at 20. MACD generates buy and sell signals through crossovers of two exponential moving averages.
These oscillators can help you quickly identify market rhythm and potential reversal opportunities in environments like the U.S. market.
Key Uses
Identifying Buy and Sell Signals
In actual trading, you most commonly use oscillators to identify buy or sell opportunities. What are oscillators? They are tools that help you recognize market momentum and extreme conditions. You can capture potential reversal signals by observing whether the indicator’s value reaches overbought or oversold zones. For example, when RSI exceeds 70, the market may be overbought, and a pullback could be imminent; when RSI falls below 30, the market may be oversold, increasing the likelihood of a rebound.
You can also combine volume and other technical indicators to improve signal reliability. The table below summarizes the signal interpretation standards for common oscillators in practice:
| Oscillator Name | Signal Interpretation Standards | Suggestions for Improving Signal Reliability |
|---|---|---|
| Volume Zone Oscillator | Confirm buy/sell signals with price patterns and other indicators; signals are more reliable when volume bars align with price signals | Pay attention to whether volume reaches twice or more of the average level |
| Stock Oscillator | Identifies stock price trends and trading volume, aiding in determining buy or sell opportunities | Combine with other quantifiable indicators when price trends are unclear |
When using these signals, you can keep the following points in mind:
- Signals generated by oscillators can provide valuable insights into market trends and momentum.
- These signals cannot guarantee accurate predictions of short-term price movements.
- You should combine other analytical techniques and risk management strategies to improve the effectiveness of trading decisions.
Tip: You can combine oscillators with trendlines, support and resistance levels, and other tools to avoid misjudgments from single signals.
You can also use oscillators to identify trend reversals, overbought and oversold conditions, and confirm price movements. Combining them with other technical indicators and trading strategies can maximize their effectiveness.
Market Rhythm Identification
If you want to grasp market rhythm, oscillators can also assist you. Different types of oscillators have their own calculation and interpretation methods. For example, RSI primarily measures the speed and change of price movements, making it suitable for identifying overbought or oversold conditions. MACD, on the other hand, helps you assess trend strength through the relationship between two moving averages.
You can follow these steps to use oscillators to identify market rhythm:
- Choose an appropriate oscillator type, such as RSI or MACD.
- Understand the meaning of indicator readings. RSI above 70 indicates overbought, and below 30 indicates oversold. MACD line and signal line crossovers may signal trend changes.
- Pay attention to divergence. When prices reach new highs but the oscillator fails to follow, it may indicate a trend reversal signal.
You can refer to the table below for statistical evidence supporting market rhythm identification:
| Research Topic | Key Findings |
|---|---|
| Contagion Phenomena in Global Stock Exchanges | Each exchange can be viewed as an integrated and emitting oscillator, with nonlinear price behavior supported by empirical data, providing statistical evidence for market rhythm identification. |
Additionally, scientific research has found that the phase of slow cortical oscillations can predict the gain of evidence accumulation, and the motor activity of fast oscillations reflects the accumulation of decision-making information. These findings provide a theoretical basis for using oscillators to identify market rhythm.
- Predictive oscillators can forecast future price movements based on historical data.
- You can use them to identify trend reversals, overbought and oversold conditions, and confirm price movements.
- Combining other technical indicators and trading strategies can maximize the effectiveness of market rhythm identification.
Reminder: When using oscillators in environments like the U.S. market, you need to flexibly adjust parameters based on market characteristics to improve the accuracy of market rhythm identification.
Practical Techniques

Image Source: pexels
Operational Suggestions
When encountering range-bound markets in the U.S., you can use oscillators to improve trading accuracy. The Stochastic Oscillator performs exceptionally well in range-bound markets. You can refer to the table below to quickly identify buy and sell signals:
| Signal | Condition | Action |
|---|---|---|
| Buy | %K crosses above %D below 20 | Enter near support levels |
| Sell | %K crosses below %D above 80 | Exit near resistance levels |
| Neutral Zone | Between 40-60 | Avoid opening new positions |
When operating in practice, you should also note the following:
- Pay attention to overbought and oversold levels, which are typically key indicators.
- Prioritize crossovers at significant support or resistance levels.
- Watch for potential reversal points within the range.
You can fine-tune Stochastic Oscillator settings to increase sensitivity to small price fluctuations. For example, shorten the period to 5-9 days and adjust the boundaries to 70/30. Using a faster %K setting (e.g., 3-period %K) can better capture short-term opportunities.
When applying oscillators, you may make common mistakes, such as misinterpreting overbought or oversold signals, ignoring market context divergences, using incorrect parameter settings, skipping multi-timeframe analysis, lacking volume confirmation, or trading against the dominant trend. You should adjust parameters based on market type and industry characteristics and combine volume and trend direction to enhance signal effectiveness.
Indicator Pairing
In actual trading, pairing oscillators with trend-following indicators can significantly improve trading performance. The table below lists commonly used indicators and their roles:
| Indicator | Role Description |
|---|---|
| RSI | Confirms overbought/oversold conditions, reduces false signals, and enhances entry points. |
| Moving Average | 50-day MA identifies trend direction; 200-day MA confirms major support/resistance levels. |
| OBV | Confirms price movements; volume surges validate breakout signals. |
| Candlestick Patterns | Strengthens reversal signals; confirms entry/exit points at support/resistance levels. |
| Trendline | Validates breakout opportunities. |
You can use the following methods to enhance the effectiveness of multi-indicator combinations:
- Trend Confirmation: Use moving averages to confirm the trend direction identified by oscillators. For example, when the price is above the 200-day MA and RSI shows overbought conditions, you can look for sell opportunities.
- Signal Confirmation: Use MA crossovers and oscillators to validate trading signals. After a short-term MA breaks above a long-term MA, wait for MACD or RSI confirmation before entering.
- Divergence Analysis: Observe divergences between MAs and oscillators to identify potential trend reversals. For example, if the price reaches a new high but the oscillator does not, momentum may be weakening.
- Identifying Entry/Exit Points: Use the convergence or divergence of MAs and oscillators to determine optimal entry/exit points. When the price breaks a key MA and RSI confirms momentum, the buy signal is stronger.
By combining multiple technical indicators, you can analyze the market more comprehensively, reduce misjudgments, and improve trading success rates.
Flexible Application
Market Environment Adjustments
When using oscillators, you must flexibly adjust strategies based on different market environments. The U.S. market often exhibits two main patterns: trending and range-bound. You can choose appropriate parameters and uses based on market conditions:
- In range-bound markets, it’s recommended to use shorter periods to capture price reversal signals more quickly.
- In trending markets, using longer periods helps filter noise and smooth signals.
- You should combine other technical indicators to confirm signals and avoid misjudgments from a single indicator.
Oscillators are prone to false signals in highly volatile markets. You need to interpret them cautiously and combine them with market context and other analytical tools. Oscillators should serve as supplementary tools, not the sole basis for decision-making. Ignoring market context may lead to misjudgments and unnecessary losses.
Parameter Optimization
To make oscillators better suit your trading style, you can optimize parameters. You can adjust indicator settings based on different trading instruments and timeframes:
- Adjust the period based on your chosen timeframe. For example, short-term trading can use shorter periods, while daily or weekly trading can use longer periods.
- Validate the effectiveness of custom parameters through historical backtesting.
- In highly volatile markets, shorten periods to increase sensitivity; in stable markets, extend periods to reduce noise.
- Regularly review and adjust parameters to ensure the indicator adapts to current market conditions.
- Adjust smoothing values and test different %K and %D periods to find the settings that best suit you.
- Combine other technical indicators to improve signal reliability.
By continuously optimizing parameters, you can ensure oscillators remain effective in environments like the U.S. market. This allows you to better grasp market rhythm and improve trading decision accuracy.
Once you master oscillators, you can better gauge market rhythm and enhance trading decision-making. Different oscillators have their own strengths:
| Oscillator | Primary Use | Key Signals | Best Market Type |
|---|---|---|---|
| RSI | Momentum detection | Overbought (>70), Oversold (<30) | Range-bound |
| MACD | Trend validation | Line crossover, zero-line changes | Trending |
| Stochastic | Price range evaluation | %K and %D crossovers, 80/20 levels | Range-bound |
You can improve practical results through the following methods:
- Use divergence, crossover, and overbought/oversold methods to identify signals.
- Record strategies and emotional changes to continuously optimize trading methods.
- Practice repeatedly in real markets to accumulate experience.
Continuous learning and reflection will allow you to flexibly apply oscillators in environments like the U.S. market, steadily improving trading performance.
FAQ
What market environments are oscillators suitable for?
You can use oscillators in range-bound markets in the U.S. to identify price reversal points. In trending markets, it’s recommended to combine them with other indicators for analysis.
What’s the difference between oscillators and trend indicators?
You use oscillators to identify overbought and oversold conditions, suitable for range-bound markets. You use trend indicators to identify price direction, suitable for trending markets. Combining both yields better results.
How to set oscillator parameters?
You can adjust parameters based on the trading timeframe. Use shorter periods for short-term trading and longer periods for daily or weekly trading. Find the best settings through historical backtesting.
Can oscillator signals fail?
In strong trending markets, oscillator signals may fail. You need to combine trend indicators and volume analysis to avoid misjudgments from single signals.
Can you rely solely on oscillators for decision-making?
It’s not recommended to rely solely on oscillators. You should combine trends, volume, and price action to improve the accuracy of trading decisions.
Oscillators are invaluable tools for gauging market momentum and identifying overbought/oversold conditions. But the true power of these indicators is unlocked only when you pair your analysis with instant funding and cost-effective execution. When an oscillator signals a high-conviction reversal, a slow transfer or high commission can mean the difference between capitalizing on the market rhythm and missing the move entirely.
To ensure your strategy benefits from professional-grade execution, integrate the financial agility of BiyaPay into your trading. We offer zero commission for contract limit orders, significantly reducing the costs associated with the frequent entries and exits often dictated by oscillator signals. Furthermore, our platform supports the swift, mutual conversion between fiat and digital assets like USDT, ensuring your trading capital is funded instantly and efficiently. You can register quickly—in just 3 minutes without requiring an overseas bank account—and gain seamless access to US and Hong Kong Stocks. Leverage our real-time exchange rate checks to maintain transparent control over your funding costs. Open your BiyaPay account today and translate your technical analysis into decisive, profitable action.
*This article is provided for general information purposes and does not constitute legal, tax or other professional advice from BiyaPay or its subsidiaries and its affiliates, and it is not intended as a substitute for obtaining advice from a financial advisor or any other professional.
We make no representations, warranties or warranties, express or implied, as to the accuracy, completeness or timeliness of the contents of this publication.


Contact Us
Company and Team
BiyaPay Products
Customer Services


is a broker-dealer registered with the U.S. Securities and Exchange Commission (SEC) (No.: 802-127417), member of the Financial Industry Regulatory Authority (FINRA) (CRD: 325027), member of the Securities Investor Protection Corporation (SIPC), and regulated by FINRA and SEC.
registered with the US Financial Crimes Enforcement Network (FinCEN), as a Money Services Business (MSB), registration number: 31000218637349, and regulated by FinCEN.
registered as Financial Service Provider (FSP number: FSP1007221) in New Zealand, and is a member of the Financial Dispute Resolution Scheme, a New Zealand independent dispute resolution service provider.