- EasyCard
- Trade
- Help
- Announcement
- Academy
- SWIFT Code
- Iban Number
- Referral
- Customer Service
- Blog
- Creator
A Comprehensive Analysis of the PE Ratio: How to Use the Price - to - Earnings Ratio for Stock Valuation and Investment Decisions


Image Source: unsplash
You can use the price-to-earnings ratio to measure the value of a stock. The price-to-earnings ratio, through the relationship between stock price and earnings per share, helps you assess a company’s profitability. This comprehensive PE ratio analysis allows you to understand the calculation methods and practical applications of the PE ratio. You need to be aware of the advantages and disadvantages of the PE ratio and combine it with other indicators for analysis to make more scientific investment decisions.
Key Points
- The price-to-earnings ratio (P/E Ratio) is an important tool for evaluating stock value, helping investors assess a company’s profitability through the ratio of market price per share to earnings per share.
- Static PE ratio and dynamic PE ratio are two commonly used calculation methods; the static PE ratio focuses on current earnings, while the dynamic PE ratio considers future growth expectations, suitable for analyzing different types of companies.
- When performing stock valuation, combining the industry average PE ratio and the company’s historical PE ratio can more accurately determine whether a stock is overvalued or undervalued.
- The limitation of the PE ratio lies in its reliance on a company’s earnings data, where earnings fluctuations may distort the PE ratio, so it should be analyzed in conjunction with other financial indicators.
- During investment, the PE ratio should be used as a supplementary tool, combined with market sentiment, industry characteristics, and company growth potential, to make more scientific investment decisions.
PE Ratio Comprehensive Analysis: Definition and Significance

Image Source: unsplash
PE Ratio Definition
When analyzing stocks, you often encounter the term price-to-earnings ratio. The price-to-earnings ratio (P/E Ratio) is an indicator used to measure the relationship between a company’s stock price and its earnings per share (EPS). You can quickly understand a company’s market valuation level through the PE ratio.
The following table can help you better understand the standard definition of the PE ratio:
| Term | Definition |
|---|---|
| P/E Ratio | The P/E ratio is the relationship between a company’s stock price and its earnings per share (EPS). It is a popular ratio that helps investors better understand a company’s value. |
| Formula | P/E Ratio = Market Price per Share / Earnings per Share (EPS) |
You can think of the PE ratio as the price investors are willing to pay for each dollar of a company’s profit. This indicator is widely used in the U.S. market, helping you compare the valuation levels of different companies.
Calculation Formula
In practice, you only need to divide the current price per share by the earnings per share (EPS) to obtain the PE ratio.
- The calculation formula for the P/E ratio is: Current Price per Share / Earnings per Share (EPS).
- You can directly find the earnings per share in the financial reports of U.S.-listed companies and calculate the PE ratio using the market price.
- The PE ratio is a simple tool used to compare a company’s stock price with its earnings.
For example, if a U.S. company’s stock price is USD 50 and its earnings per share is USD 2, the PE ratio is 25. This means you need to pay USD 25 to obtain USD 1 of the company’s profit.
Role and Significance
When making investment decisions, the PE ratio can serve as an important reference indicator.
- The PE ratio helps you compare the investment value of different companies, especially in the U.S. market, where investors commonly use it to screen potential stocks.
- You can use the PE ratio to identify undervalued or overvalued stocks, avoiding paying excessively high prices for stocks.
- The PE ratio is a core component of this comprehensive PE ratio analysis and a fundamental tool for stock valuation.
Tip: When analyzing the PE ratio, it’s best to consider the company’s earnings quality and industry characteristics, rather than focusing solely on a single number. Although the PE ratio is simple, in this comprehensive analysis, you also need to pay attention to other financial indicators to make more scientific investment judgments.
Types and Calculations
Static PE Ratio
When analyzing stocks, you often use the static PE ratio. The static PE ratio is a simplified valuation method. You only need to divide the current price per share by the earnings per share (EPS) from the past year to obtain this value. The static PE ratio does not consider the company’s future growth or the time value of money. You can use it to quickly assess a company’s current market valuation, but it cannot reflect future earnings changes.
- The static PE ratio is a simplified indicator that does not account for growth or the time value of money.
Dynamic PE Ratio
The dynamic PE ratio (also called PPP) focuses more on a company’s future. When calculating the dynamic PE ratio, you consider the expected earnings growth rate and interest rates. The dynamic PE ratio helps you understand when a company’s earnings can recover your investment. You can use it to compare the attractiveness of different companies, especially for startups or companies with unstable earnings. The dynamic PE ratio is more forward-looking than the static PE ratio, providing a more accurate assessment of intrinsic value.
- The dynamic PE ratio evaluates a stock’s value by considering the expected earnings growth rate and interest rates.
- PPP provides a clear time-based indicator, helping you understand when a company’s earnings can recover your investment.
- The dynamic PE ratio is suitable for situations where the traditional PE ratio may not be relevant, such as startups or companies with unstable earnings.
Industry Average
When conducting industry comparisons, the industry average PE ratio is an important reference. By comparing a company’s PE ratio with the industry average, you can determine whether the company’s valuation is reasonable. The following table shows the average PE ratios for major industries in the U.S. market over the past five years:
| Metric | Value |
|---|---|
| Current PE Ratio | 26.50 |
| Past Five-Year Average PE Ratio | 22.42 |
| 1 Standard Deviation Range | [19.97, 24.88] |
| 2 Standard Deviation Range | [17.51, 27.33] |
You can use these data to determine whether a stock is overvalued or undervalued.
Calculation Pitfalls
When using this comprehensive PE ratio analysis, you may encounter some common pitfalls.
- Some investors use outdated earnings per share (EPS) data, leading to distorted PE ratios.
- Sometimes, failing to exclude one-time gains or losses can distort a company’s true valuation.
- A low P/E ratio does not necessarily mean a stock is valuable.
- A high P/E ratio does not always mean a stock is expensive.
Tip: When analyzing the PE ratio, you should combine the company’s earnings quality and industry characteristics to avoid making decisions based solely on a single number.
Valuation Applications
Overvaluation and Undervaluation
When analyzing stocks, you often encounter issues of overvaluation or undervaluation. The PE ratio is an important tool for assessing stock value. By comparing the current PE ratio with historical averages, you can quickly identify whether a stock is overvalued or undervalued.
Investors generally believe that a higher PE ratio may indicate that a stock is overvalued, while a lower PE ratio may suggest that a stock is undervalued. However, you cannot rely solely on a single number; you must also consider the industry and the company’s specific circumstances.
| Period | PE Ratio |
|---|---|
| 1870 - 2022 | 16.79 |
| 1970 - 2022 | 20.92 |
| 1996 - 2022 | 27.9 |
| Current (2023) | 35 |
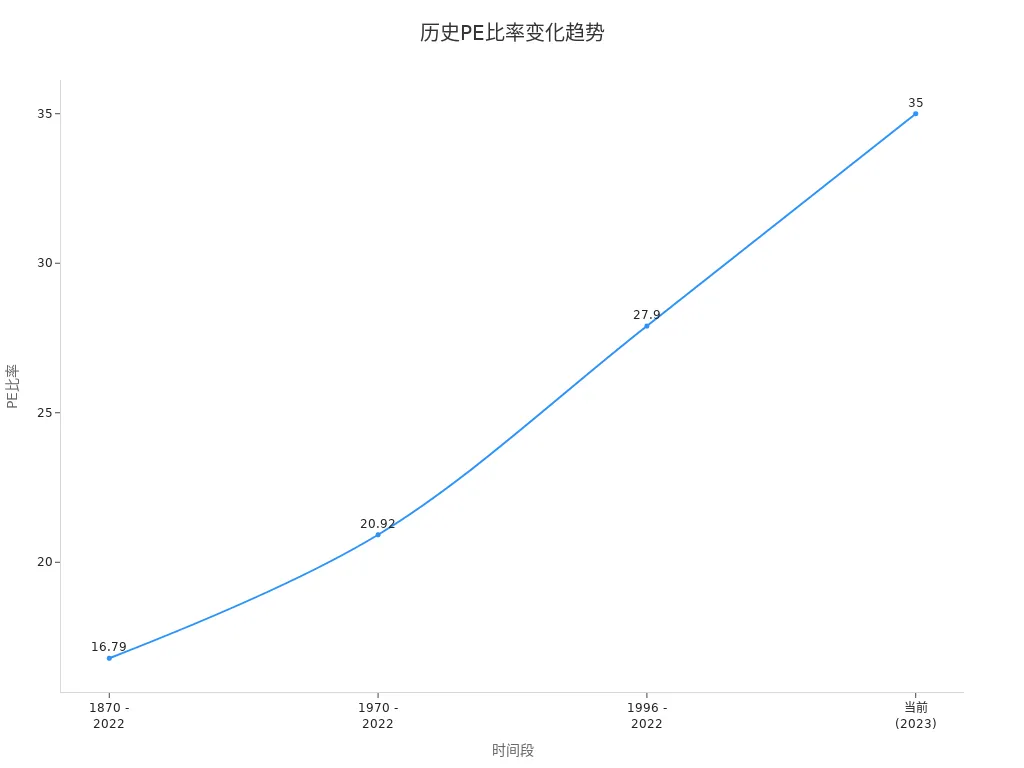
You can see that the PE ratio has been gradually rising over the past few decades. The current PE ratio is significantly higher than the historical average, indicating that some stocks may carry overvaluation risks. When making judgments, you can compare the current PE ratio with historical ranges to avoid buying stocks at excessively high prices.
You can also use the following methods to determine whether a stock is overvalued or undervalued:
- Compare the current PE ratio with the company’s historical PE ratio range.
- Compare the current PE ratio with those of other companies in the same industry.
- Combine the company’s earnings quality and future expectations to comprehensively assess valuation reasonableness.
Industry Comparison
When analyzing stocks, you cannot focus solely on a single company’s PE ratio. Different industries have different PE ratio ranges. You need to compare the target company’s PE ratio with the industry average to more accurately determine whether the valuation is reasonable.
| Industry Name | P/E Ratio |
|---|---|
| Advertising | 40.78 |
| Aerospace & Defense | 30.21 |
| Agricultural & Farm Machinery | 15.68 |
| Agricultural Products & Services | 15.21 |
| Air Freight & Logistics | 18.88 |
| Airport Services | 16.32 |
| Alternative Carriers | 20.64 |
| Aluminum | 11.06 |
| Apparel Retail | 26.23 |
| Application Software | 57.31 |
| Biotechnology | 25.30 |
| Movies & Entertainment | 50.46 |
| Semiconductors | 43.21 |
| Insurance Brokers | 33.43 |
| Other Specialty REITs | 21.24 |
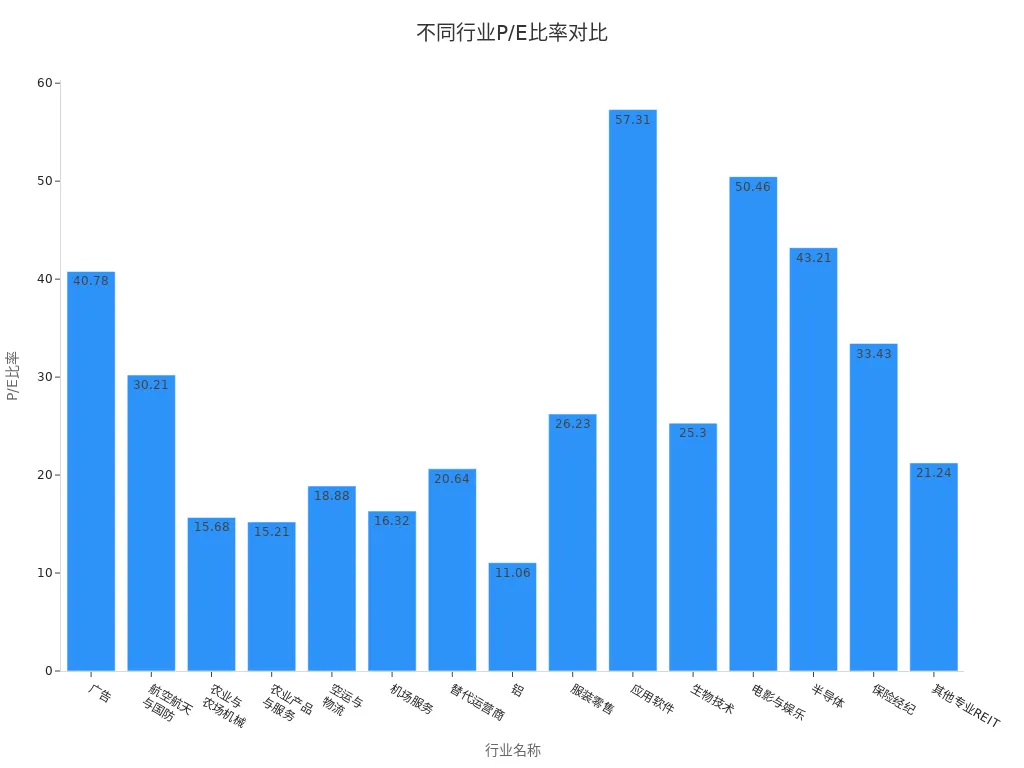
You can observe that the PE ratios in the technology and entertainment industries are generally higher, while those in traditional manufacturing and agriculture-related industries are lower. When judging stock valuations, you must consider industry characteristics and avoid applying a uniform standard. For example, the average PE ratio in the application software industry is much higher than in the aluminum industry, reflecting the market’s optimistic expectations for the future growth of technology companies.
You can follow these steps for industry comparisons:
- Find the average PE ratio for the target company’s industry.
- Compare the company’s PE ratio with the industry average.
- Analyze the company’s competitive position and growth potential within the industry.
Growth Analysis
When conducting a comprehensive PE ratio analysis, growth is a factor that cannot be ignored. The PE ratio not only reflects current profitability but also embodies the market’s expectations for a company’s future growth.
Empirical studies show that companies with higher expected growth rates typically have higher PE ratios. This indicates that investors are willing to pay a higher price for future earnings growth. When analyzing growth, you can focus on the company’s earnings growth rate and industry trends.
You can refer to the following points to understand the relationship between the PE ratio and growth:
- Earnings growth is a major factor affecting the PE ratio, particularly evident in emerging markets.
- Companies with high expected growth rates often have higher PE ratios, reflecting investors’ optimism about the future.
- When judging growth, you can combine the company’s historical performance, industry prospects, and market expectations to comprehensively analyze the reasonableness of the PE ratio.
You can analyze growth using the following methods:
- Review the company’s earnings growth rate over the past few years.
- Focus on the industry’s overall development speed and future potential.
- Combine market expectations for the company’s future to determine whether the PE ratio is reasonable.
When making investment decisions, you cannot judge solely based on the PE ratio’s level; you must also consider growth, industry comparisons, and historical ranges to make scientific judgments.
Advantages and Limitations
Advantages
When analyzing stocks, the PE ratio provides you with an intuitive valuation reference. This indicator is simple, easy to understand, and its data is readily available, applicable to most publicly listed companies. You can use the PE ratio to quickly determine whether a stock is undervalued or overvalued.
- The PE ratio helps you compare companies within the same industry to understand which companies offer greater investment value.
- You can use the PE ratio to assess whether a company is within a reasonable valuation range.
- Companies with low PE ratios are often considered undervalued, suitable for inclusion in your investment portfolio.
- Companies with high PE ratios may indicate high future earnings potential, aiding your investment decisions.
Limitations
When using the PE ratio, you need to be aware of its limitations. The PE ratio relies on a company’s earnings data, which may fluctuate. For companies with unstable or negative earnings, the PE ratio may lose its reference value.
- The PE ratio does not reflect a company’s growth potential.
- PE ratios vary significantly across industries, which can lead to misleading comparisons.
- The PE ratio does not account for a company’s debt levels.
- If a company’s earnings are negative or extremely low, the PE ratio cannot accurately reflect the company’s value.
- Some companies may manipulate earnings through accounting practices, leading to distorted PE ratios.
Tip: When analyzing the PE ratio, it’s best to combine the company’s earnings quality and industry characteristics to avoid relying solely on the PE ratio for decision-making.
Earnings Quality Impact
When evaluating the PE ratio, earnings quality is a critical factor. High-quality earnings are typically supported by real cash flow, making the PE ratio more reliable. If a company’s reported earnings include significant non-recurring items or accounting adjustments, the PE ratio may be inflated, potentially misleading you into making incorrect investment decisions. You need to focus on the company’s core business profitability to avoid being deceived by superficial numbers.
Special Charges Interference
When analyzing financial reports, special charges can affect the accuracy of the PE ratio. Non-recurring expenses, extraordinary items, or other unusual gains and losses may obscure a company’s true profitability. These items vary in frequency across industries, with some industries experiencing greater volatility. You need to carefully distinguish between core business earnings and special items to more accurately assess a company’s value.
Applicable Scope
Applicable Companies
When analyzing the PE ratio, you should prioritize companies with stable earnings and transparent financials. The PE ratio is more effective for valuing such companies. You can refer to the table below to understand which industries are more suitable for PE ratio analysis:
| Industry | P/E Ratio Range |
|---|---|
| Technology | 20-40+ |
| Healthcare | 15-30 |
| Banking | 8-15 |
| Utilities | 12-18 |
| Retail | 12-25 |
The technology and healthcare industries typically have higher PE ratios due to market expectations for future growth. The banking and utilities industries have lower PE ratios, reflecting stable but limited growth. When analyzing these industries, you can use the PE ratio to quickly determine whether a valuation is reasonable.
Inapplicable Companies
When using the PE ratio, you need to be aware that some companies are not suitable for valuation with this metric. The following types of companies may lead to distorted PE ratios:
- Companies affected by changes in accounting rules
- Companies exploiting accounting loopholes
- Companies where assets and liabilities significantly impact valuation but are not reflected in the PE ratio
These companies may affect profit performance through accounting adjustments, making the PE ratio unable to accurately reflect their value. When analyzing, you should combine other financial indicators and avoid relying solely on the PE ratio.
Cyclical Industries
When analyzing cyclical industries, the reference value of the PE ratio decreases. Cyclical industries such as aviation, automotive, or raw materials experience significant earnings fluctuations, causing the PE ratio to vary sharply with economic cycles. A low PE ratio during a boom may be a temporary phenomenon. You need to combine industry cycles, historical data, and future expectations to comprehensively assess a company’s valuation. The PE ratio in cyclical industries can only serve as a supplementary tool, not the sole basis.
Case Studies

Image Source: pexels
High PE Ratio Case Study
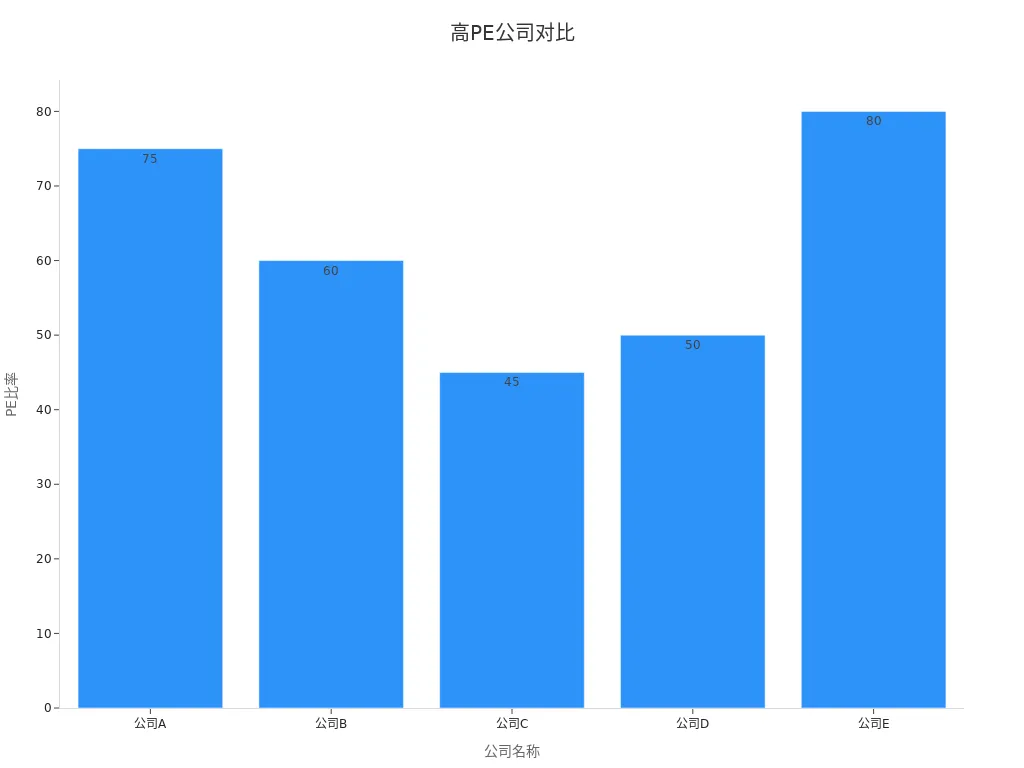
When investing, you may encounter companies with extremely high PE ratios. These companies are typically in a rapid growth phase, with the market having high expectations for their future. For illustrative purposes, the table summarizes representative high P/E firms in the U.S., labeled as A, B, C, and D.
| Company Name | Industry | PE Ratio | Growth Reasons | Risks |
|---|---|---|---|---|
| Company A | Artificial Intelligence | 75 | Leader in generative AI, surging demand | Intense competition, reliance on a few clients, regulatory risks |
| Company B | Biotechnology | 60 | Developing potentially groundbreaking new drugs | Clinical trial failures, regulatory approval risks |
| Company C | Luxury Goods | 45 | Strong brand recognition and sustained demand | Economic slowdown, changes in consumer preferences |
| Company D | Cloud Computing | 50 | Key player in digital transformation | Intense competition, technological disruption risks |
| Company E | Electric Vehicles | 80 | Growing demand for sustainable transportation | Supply chain issues, intense competition, technological limitations |
You can see that these companies’ PE ratios are significantly higher than the industry average. High PE ratios often indicate high investor expectations for future growth, but they also come with significant risks. Before investing, you need to analyze the company’s growth potential and industry competition landscape.
Low PE Ratio Case Study
In the market, you may also find companies with low PE ratios. These companies are often in a mature stage with stable earnings but limited growth. A low PE ratio may indicate undervaluation, but it could also reflect a lack of market confidence in their future. For example, some traditional manufacturing or utilities companies have PE ratios of only 10-15. When investing, you need to be cautious of the reasons behind a low PE ratio, not just focus on the number, and combine it with an analysis of the company’s fundamentals.
Tip: You can assess whether a low PE ratio presents an investment opportunity by reviewing the company’s historical performance and industry prospects.
Earnings Volatility
When analyzing the PE ratio, you must pay attention to the stability of a company’s earnings. Some companies experience significant earnings volatility, causing the PE ratio to fluctuate dramatically. Cyclical industries like aviation and automotive are significantly affected by economic conditions, with PE ratios potentially appearing low during peak periods but rising rapidly during downturns. You need to combine historical data and industry cycles to avoid misjudging a company’s value due to short-term earnings changes.
Recommendation: Before investing, you should analyze the sustainability and volatility of a company’s earnings. The PE ratio is only a reference tool and should not be the sole basis for decisions.
Investment Timing
Buy and Sell Point Judgment
When investing, you often use the PE ratio to judge the timing of buying or selling. When the PE ratio is low, many investors believe the stock is undervalued, presenting a good buying opportunity. When the PE ratio is high, the market has high expectations for the company’s future growth, and some investors may choose to sell for profit. However, you cannot rely solely on the PE ratio for decisions. You also need to combine the company’s earnings quality, industry averages, and market trends to comprehensively judge buy and sell points. In the U.S. market, many investors observe the PE ratio’s deviation from historical ranges to identify valuation signals.
Return Rate Relationship
When analyzing the relationship between the PE ratio and investment returns, you need to consider academic research conclusions. Studies show that the PE ratio has limited predictive power for long-term investment returns, particularly in certain market contexts. You can refer to the following points:
- The PE ratio has only weak statistical significance in predicting returns over the next year, with limited predictive power.
- The CAPE ratio (Cyclically Adjusted Price-to-Earnings Ratio) has a stronger correlation with future returns, especially over longer time frames.
- Higher CAPE ratios are associated with lower expected future returns.
In actual investments, you can use the PE ratio as a supplementary tool but should not rely solely on it to judge long-term returns. You can also combine other valuation indicators like CAPE to improve judgment accuracy.
Market Sentiment
When analyzing the PE ratio, the impact of market sentiment cannot be ignored. When market sentiment is positive, investors’ expectations for a company’s future growth increase, often leading to a rising PE ratio. Conversely, negative sentiment can depress valuations even if the company’s current earnings remain unchanged. You need to learn to distinguish whether the PE ratio is driven by the company’s actual performance or by market sentiment. Studies show that market sentiment has a greater impact on the returns of small-cap and value stocks. During high-sentiment periods, these stocks may have lower returns. When investing, combining market sentiment analysis can help you identify potential investment opportunities or risks.
When investing, this comprehensive PE ratio analysis provides you with an intuitive valuation tool. You need to pay attention to the following points:
- The P/E ratio is suitable for comparing a company’s current stock price with its earnings per share, but it cannot solely determine overvaluation or undervaluation.
- You should combine industry characteristics, earnings quality, and indicators like PEG to avoid misjudging a company’s value.
- You can use multiple indicators like EV/EBITDA, P/S, and P/FCF for a more comprehensive analysis.
- You should regularly update data and exclude one-time items to improve judgment accuracy.
Only by combining multidimensional information can you make scientific investment decisions.
FAQ
Is a Lower PE Ratio Always Better?
You cannot assume a stock is worth buying just because its PE ratio is low. A low PE ratio may result from poor company prospects or declining earnings. You need to analyze the company’s fundamentals and industry conditions.
Which Companies Are Suitable for PE Ratio Analysis?
You can use the PE ratio to analyze companies with stable earnings and transparent financials. Companies in industries like technology, healthcare, and banking are more suitable for PE ratio valuation.
Why Do Some Companies Have No PE Ratio?
You may notice that some companies have no PE ratio. This is usually because the company is in a loss-making state with no positive earnings per share. You can use other indicators for supplementary analysis.
Can the PE Ratio Predict Future Returns?
You cannot use the PE ratio alone to predict future returns. The PE ratio only reflects the current valuation level. You need to combine growth potential, industry trends, and other financial indicators for judgment.
How to Avoid PE Ratio Calculation Pitfalls?
When calculating the PE ratio, you should use the latest earnings per share data. You also need to exclude one-time gains or losses and focus on core business profitability to improve analysis accuracy.
By mastering the P/E ratio’s comprehensive analysis, you’re equipped to assess stock value and refine investment decisions using static and forward P/E, but high cross-border fees, currency volatility, and offshore account complexities can limit seizing U.S. low-valuation opportunities, especially during swift valuation corrections or earnings seasons. Imagine a platform with 0.5% remittance fees, same-day global transfers, and contract limit orders with zero fees, enabling seamless valuation strategies via one account?
BiyaPay is tailored for value investors, offering instant fiat-to-digital conversions to act on low P/E signals nimbly. With real-time exchange rate query, monitor USD trends and transfer at optimal moments to cut costs. Covering most regions with instant arrivals, it powers rapid allocations to S&P 500 ETFs (like VTV) or low P/E stocks. Crucially, trade U.S. and Hong Kong markets through a single account, leveraging contract limit orders with zero fees for industry-average P/E-based limit strategies.
Whether chasing undervaluation plays or dodging overvaluation risks, BiyaPay fuels your precision. Sign up now, visit stocks for U.S. prospects—quick setup unlocks cost-effective, data-driven investing. Join global investors and profit in 2025 markets!
*This article is provided for general information purposes and does not constitute legal, tax or other professional advice from BiyaPay or its subsidiaries and its affiliates, and it is not intended as a substitute for obtaining advice from a financial advisor or any other professional.
We make no representations, warranties or warranties, express or implied, as to the accuracy, completeness or timeliness of the contents of this publication.


Contact Us
Company and Team
BiyaPay Products
Customer Services


is a broker-dealer registered with the U.S. Securities and Exchange Commission (SEC) (No.: 802-127417), member of the Financial Industry Regulatory Authority (FINRA) (CRD: 325027), member of the Securities Investor Protection Corporation (SIPC), and regulated by FINRA and SEC.
registered with the US Financial Crimes Enforcement Network (FinCEN), as a Money Services Business (MSB), registration number: 31000218637349, and regulated by FinCEN.
registered as Financial Service Provider (FSP number: FSP1007221) in New Zealand, and is a member of the Financial Dispute Resolution Scheme, a New Zealand independent dispute resolution service provider.