- EasyCard
- Trade
- Help
- Announcement
- Academy
- SWIFT Code
- Iban Number
- Referral
- Customer Service
- Blog
- Creator
Market Barometer: How to Interpret Short Positions and Gain Insights into the Battle between Bulls and Bears?


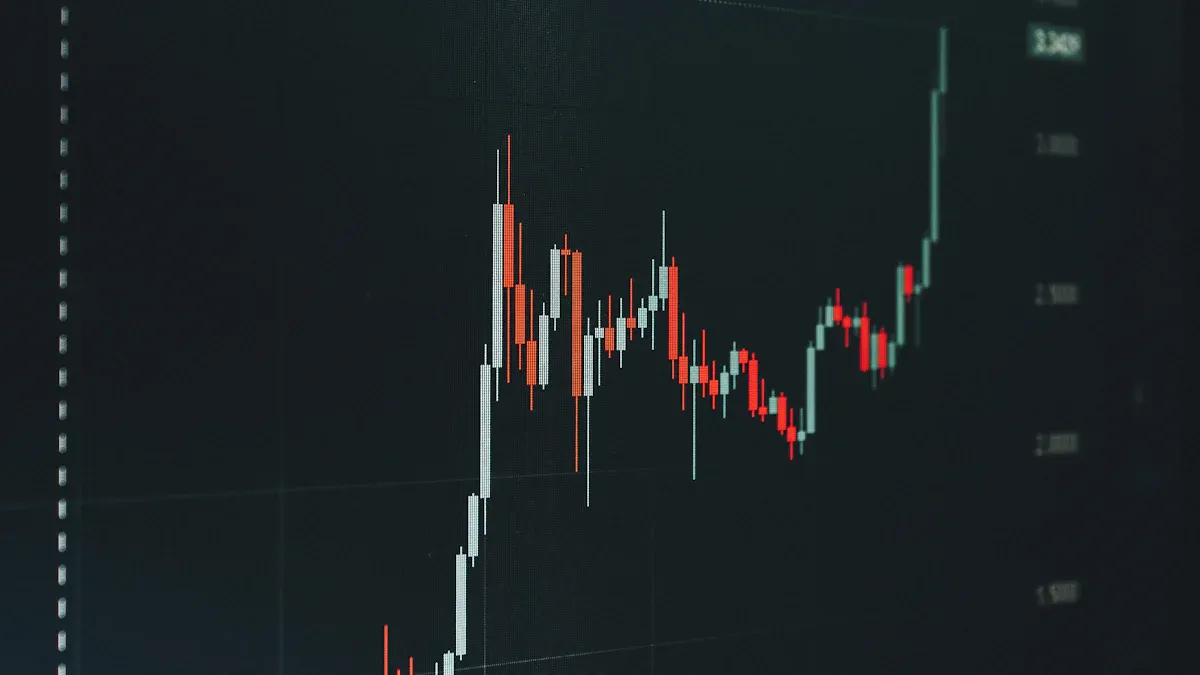
Image Source: unsplash
To grasp the market indicator, you need to learn how to interpret short interest. By observing core signals and volume-price relationships, you can quickly identify changes in long and short forces. Changes in volume often reveal the true intentions of market movers. Once you understand these changes, you can better judge market trends and enhance your investment decision-making capabilities.
Key Points
- Understanding the definition and operation of short interest helps you make wiser investment decisions in the market.
- By observing changes in open interest, you can gauge the activity level of market participants and adjust your trading strategy in time.
- Focusing on the comparison of buying and selling volume helps identify shifts in market sentiment and capture turning points in long-short dynamics.
- Combining volume-price analysis and the OBV indicator improves the accuracy of market trend judgments and boosts investment confidence.
- Avoiding common pitfalls, maintaining rationality and discipline, ensures long-term stable investment growth.
Market Indicator and Short Interest

Image Source: pexels
Definition of Short Interest
You often hear the term “short interest” in investing. Short interest refers to selling an asset in the hope that its price will fall, then buying it back later to profit from the price difference. You can engage in short selling in various markets such as stocks, ETFs, currencies, options, and futures. When you hold a short position, you are generally pessimistic about the market, expecting prices to decline. The operation of short interest involves selling borrowed assets first, then buying them back to return after the price drops. This way, you can profit from the price decline.
You need to understand that short interest is not only a tool for individual investors but also a key signal for analyzing the market indicator. High levels of short interest often indicate that many market participants expect prices to fall, reflecting a pessimistic market sentiment.
Long-Short Relationship
In the market, you encounter two forces: long and short. Long positions hope for price increases, while short positions expect price declines. By observing the ratio of long to short positions, you can judge changes in the market indicator. The table below shows the risk and return characteristics of long and short positions:
| Position Type | Risk Characteristics | Return Potential |
|---|---|---|
| Long Position | Maximum loss is limited | Theoretically unlimited returns |
| Short Position | Theoretically unlimited loss | Limited returns (price cannot fall below zero) |
You notice that when the proportion of short interest rises, market volatility may increase. Long-short strategies can help you reduce risk in volatile markets, making your judgment of the market indicator more accurate.
Market Sentiment
You can gauge market sentiment through short interest levels. High short interest (e.g., exceeding 20%) typically indicates that market participants are pessimistic about future trends. You can also monitor factors like leveraged fund positions, retail investor sentiment, and macroeconomic catalysts, which influence changes in the market indicator. Positive news or unexpected buying pressure can sometimes trigger short covering, leading to rapid shifts in market sentiment. By tracking these signals, you can better grasp the market indicator and enhance your investment judgment.
Signal Interpretation
Changes in Open Interest
When analyzing the market indicator, you should first focus on changes in open interest. Open interest (OI) reflects the number of outstanding contracts in the market. By observing increases or decreases in open interest, you can gauge the activity level of market participants and the strength of trends.
- An increase in open interest usually indicates new capital entering the market, with traders establishing new positions, which strengthens the current trend. If you see prices rising alongside increasing open interest, it suggests stronger bullish forces, and the market may continue to rise.
- A decrease in open interest means traders are closing positions, and market activity is declining. This may indicate a weakening trend or profit-taking by investors. If prices rise but open interest falls, it could be due to short covering rather than new long positions, suggesting a weakening trend.
- During price declines, increasing open interest indicates stronger bearish forces and greater downward pressure. Conversely, declining open interest may signal that the downtrend is nearing its end.
You can use these signals to judge changes in long-short dynamics and adjust your trading strategy in time.
Buy-Sell Volume Comparison
You also need to focus on the comparison of buying and selling volume. Buy-sell volume reflects the balance of power between buyers and sellers in the market. You can interpret it through the following aspects:
- High trading volume typically indicates strong market commitment to the current price movement. If you see prices rising with increasing volume, it suggests high investor enthusiasm, strong buying pressure, and likely continued price increases.
- In a downtrend, increasing volume indicates a lack of investor confidence, strong selling pressure, and potential further price declines.
- If prices rise but volume decreases, it suggests insufficient upward momentum, and the market may reverse. Conversely, if prices fall but volume decreases, it indicates weakening selling pressure, and the market may stabilize.
By analyzing changes in buy-sell volume, you can capture early signals of the market indicator and seize turning points in long-short dynamics.
Volume-Price Analysis
Volume-price analysis is a crucial tool for judging the market indicator. By analyzing the relationship between price and trading volume, you can improve the accuracy of market trend judgments. The table below summarizes the key role of volume-price analysis in interpreting short interest:
| Evidence Point | Description |
|---|---|
| Volume Confirms Price Trend | When price movement is accompanied by increasing volume, it confirms the reliability of the price trend. |
| Identifying Strong Selling Pressure | High volume during downward movements indicates strong selling pressure, aiding accurate short interest interpretation. |
| Evaluating Price Reversal | Volume analysis helps assess the reliability of potential price reversals. |
In practice, you can combine volume-price analysis to identify trend continuation or reversal. For example, in the U.S. market, if a tech stock’s price keeps rising with increasing volume, it suggests bullish dominance and a likely continuation of the trend. If the price rises but volume shrinks, beware of a potential market reversal.
Tip: You can combine volume-price analysis with other technical indicators to improve the accuracy of judging the market indicator.
OBV Indicator
You can also use the OBV (On-Balance Volume) indicator to assist in judging long-short dynamics. OBV is a momentum indicator that reflects capital flow and market sentiment by accumulating daily trading volume.
- The OBV calculation is simple: if the price rises on a given day, add the day’s volume to OBV; if the price falls, subtract the volume. This way, you can see whether capital is flowing into or out of the market.
- In short interest analysis, OBV helps you identify bearish divergences. When the price hits a new high but OBV does not, it suggests insufficient upward momentum and a potential reversal signal. Conversely, if the price hits a new low but OBV does not, it indicates weakening downward momentum, and the market may stabilize.
- OBV can also confirm trends. If price and OBV rise together, it indicates strong bullish forces; if they fall together, bearish forces dominate.
By combining the OBV indicator with volume-price analysis, you can gain a more comprehensive understanding of the market indicator and enhance your insight into the long-short game.
Practical Analysis

Image Source: pexels
Long-Short Transition
You often encounter transitions between long and short forces in the market. Different chart patterns can help you identify these turning points. The table below summarizes common long-short transition patterns:
| Chart Pattern | Description |
|---|---|
| Diamond Top | Increased market uncertainty, potentially shifting from bullish to bearish, confirmed by a price break below the lower boundary. |
| Diamond Bottom | Appears after a downtrend, confirmed as bullish reversal when the price breaks above the upper boundary. |
| Bearish Rectangle | Consolidation in a downtrend, continuing downward after breaking support. |
| Rounding Top | Weakening buyer strength, with sellers starting to dominate the market. |
| Rounding Bottom | Weakening seller strength, with buyers starting to dominate the market. |
| Head and Shoulders | Intense long-short battle, with sellers eventually dominating, leading to a market downturn. |
You can use these patterns to judge changes in the market indicator and adjust your investment strategy in time.
Intentions of Major Players
When analyzing the market, you need to focus on the actions of major capital. Institutional investors often express confidence in a stock through block trades. For example, in the U.S. market, institutional investors are more likely to increase short positions in less liquid companies. The appearance of block trades often leads to significant changes in trading volume, affecting market sentiment and price volatility. By observing these large transactions, you can infer the true intentions of major players.
- Institutional investors adjust short interest based on market conditions and company liquidity.
- They quickly adjust positions to adapt to new market conditions in the face of uncertainty.
- During major news releases, the buying and selling behavior of major capital directly impacts market prices.
Capital Flow
You also need to monitor capital flow in the market. Capital flow reflects investor confidence and expectations. U.S. market experience shows that institutional investors reduce short positions in highly liquid companies while increasing them in less liquid ones. This capital flow affects market trends and volatility. By analyzing capital flow, you can determine whether the market is in an expansion, peak, contraction, or trough phase. The table below shows common strategies for different market cycle phases:
| Market Cycle Phase | Strategy | Description |
|---|---|---|
| Expansion Phase | Volatility Stop-Loss | Use Average True Range (ATR) to set dynamic stop-losses. |
| Peak Phase | Partial Profit-Taking | Gradually sell portions of positions to protect capital when indicators weaken. |
| Contraction Phase | Tighter Stop-Loss | Narrow stop-loss bands and reduce position sizes to handle high volatility. |
| Trough Phase | Gradual Position Building | Enter positions gradually when initial bullish signals appear to capture rebound opportunities. |
Case Studies
You can understand the practical significance of short interest through real-world cases. In the U.S. market, renowned investor James Chanos identified accounting fraud at Enron through financial report analysis, establishing short positions early, and ultimately profiting from the market’s sharp decline. In the GameStop incident, retail investors collectively bought shares, forcing hedge funds to cover short positions, leading to a short-term price surge. You can also see that short sellers’ activities sometimes signal market reversals in advance, accelerating information dissemination and affecting the market indicator.
When analyzing the market, combining chart patterns, major capital movements, and capital flow allows you to more accurately grasp the essence of the long-short game and improve investment judgment.
Tips and Pitfalls
Practical Tips
When interpreting short interest, you can adopt several practical tips to enhance your judgment. The following methods are particularly effective during U.S. market volatility:
- Hedging: You can establish offsetting positions using options to protect yourself from sharp price fluctuations. For example, when holding a short position, you can buy call options as protection.
- Scalping or Breakout Trading: You can try scalping or breakout trading, which requires completing trades in a very short time to reduce risk exposure.
- Gamma Scalping: You can continuously adjust hedging positions to maintain delta neutrality. This strategy suits highly volatile markets and helps reduce risk.
In practice, it’s recommended to combine the market indicator with the above techniques to enhance capital safety and trading efficiency.
Common Pitfalls
When analyzing short interest, you may fall into common pitfalls. Experienced traders avoid losses through the following methods:
- They focus on risk management, always setting stop-loss points to prevent significant losses from a single trade.
- They prioritize emotional control, staying calm and avoiding impulsive decisions due to market volatility.
- They strictly adhere to discipline, avoiding blindly increasing positions or leverage when trades are unfavorable.
- When trades are profitable, they appropriately scale up positions rather than prematurely reducing profit potential.
- They prioritize capital preservation to ensure long-term stable growth.
You can learn these methods to avoid erroneous decisions due to emotions or lack of discipline. Staying rational and patient is key to long-term success in the market.
Combining Indicators
When judging short interest, you cannot rely on a single indicator. Combining multiple technical indicators improves analysis accuracy. The table below shows common indicator combinations:
| Indicator Name | Function Description | Applicable Scenario |
|---|---|---|
| Open Interest Changes | Gauge market participant activity | Trend confirmation |
| Volume-Price Analysis | Identify trend continuation or reversal | Key turning points |
| OBV Indicator | Track capital flow and market sentiment | Changes in long-short dynamics |
| MACD | Identify trend strength and buy-sell signals | Medium- to long-term trend analysis |
You can combine these indicators to comprehensively judge changes in the market indicator. This approach allows you to gain deeper insights into the long-short game and enhance the scientific basis of investment decisions.
In investing, the market indicator helps you quickly identify changes in long-short dynamics. By combining multiple signals and practical experience, you can significantly improve decision-making effectiveness. The table below shows the investment return performance of multi-signal strategies in the U.S. market:
| Evidence Point | Description |
|---|---|
| Zero-Cost Portfolio Yields Over Three Times in Three Years | Strong signals, clear short-term investment advantages |
| Long-Short Strategy Average Daily Return of 13.43 Basis Points | High strategy effectiveness |
By applying these methods, you can continuously optimize your investment strategy and reduce common pitfalls.
FAQ
Does an Increase in Short Interest Always Mean the Market Will Fall?
When you see an increase in short interest, the market may become pessimistic. You need to combine trading volume and price trends to more accurately judge market direction.
How Is the OBV Indicator Applied in Actual Trading?
You can use the OBV indicator to observe capital flow. If OBV aligns with the price trend, it indicates strong market forces. If there’s a divergence, beware of a potential trend reversal.
How Should You Adjust Your Strategy When Open Interest Decreases?
When you notice a decrease in open interest, market activity declines. You can consider reducing trading frequency and wait for new trend signals before making decisions.
What Impact Does Short Covering Have in the U.S. Market?
When you see short covering in the U.S. market, prices may rise rapidly. You can monitor changes in trading volume and adjust your position structure in time.
Can Volume-Price Analysis and MACD Indicator Be Used Together?
You can combine volume-price analysis with the MACD indicator. This allows you to more comprehensively judge market trends and improve the accuracy of investment decisions.
By mastering short interest analysis, you’ve learned to decode market signals through open interest, volume-price dynamics, and OBV, unlocking insights into bull-bear battles, but high cross-border fees, currency volatility, and offshore account complexities can limit acting on U.S. short signals or rapid position adjustments, especially during short squeezes or trend reversals. Imagine a platform with 0.5% remittance fees, same-day global transfers, and contract limit orders with zero fees, enabling seamless multi-strategy trades via one account?
BiyaPay is tailored for multi-directional traders, offering instant fiat-to-digital conversions to act on market signals nimbly. With real-time exchange rate query, monitor USD trends and transfer at optimal moments to cut costs. Covering most regions with instant arrivals, it powers rapid allocations to S&P 500 index futures (like /ES) or individual stock short positions. Crucially, trade U.S. and Hong Kong markets through a single account, leveraging contract limit orders with zero fees for OBV or volume-price-based strategies.
Whether capitalizing on short squeezes or hedging reversal risks, BiyaPay fuels your edge. Sign up now, visit stocks for U.S. prospects—quick setup unlocks cost-effective, data-driven trading. Join global traders and thrive in 2025’s market battles!
*This article is provided for general information purposes and does not constitute legal, tax or other professional advice from BiyaPay or its subsidiaries and its affiliates, and it is not intended as a substitute for obtaining advice from a financial advisor or any other professional.
We make no representations, warranties or warranties, express or implied, as to the accuracy, completeness or timeliness of the contents of this publication.


Contact Us
Company and Team
BiyaPay Products
Customer Services


is a broker-dealer registered with the U.S. Securities and Exchange Commission (SEC) (No.: 802-127417), member of the Financial Industry Regulatory Authority (FINRA) (CRD: 325027), member of the Securities Investor Protection Corporation (SIPC), and regulated by FINRA and SEC.
registered with the US Financial Crimes Enforcement Network (FinCEN), as a Money Services Business (MSB), registration number: 31000218637349, and regulated by FinCEN.
registered as Financial Service Provider (FSP number: FSP1007221) in New Zealand, and is a member of the Financial Dispute Resolution Scheme, a New Zealand independent dispute resolution service provider.