- EasyCard
- Trade
- Help
- Announcement
- Academy
- SWIFT Code
- Iban Number
- Referral
- Customer Service
- Blog
- Creator
Market Panic or Mania? The Put/Call Ratio Tells the Truth!


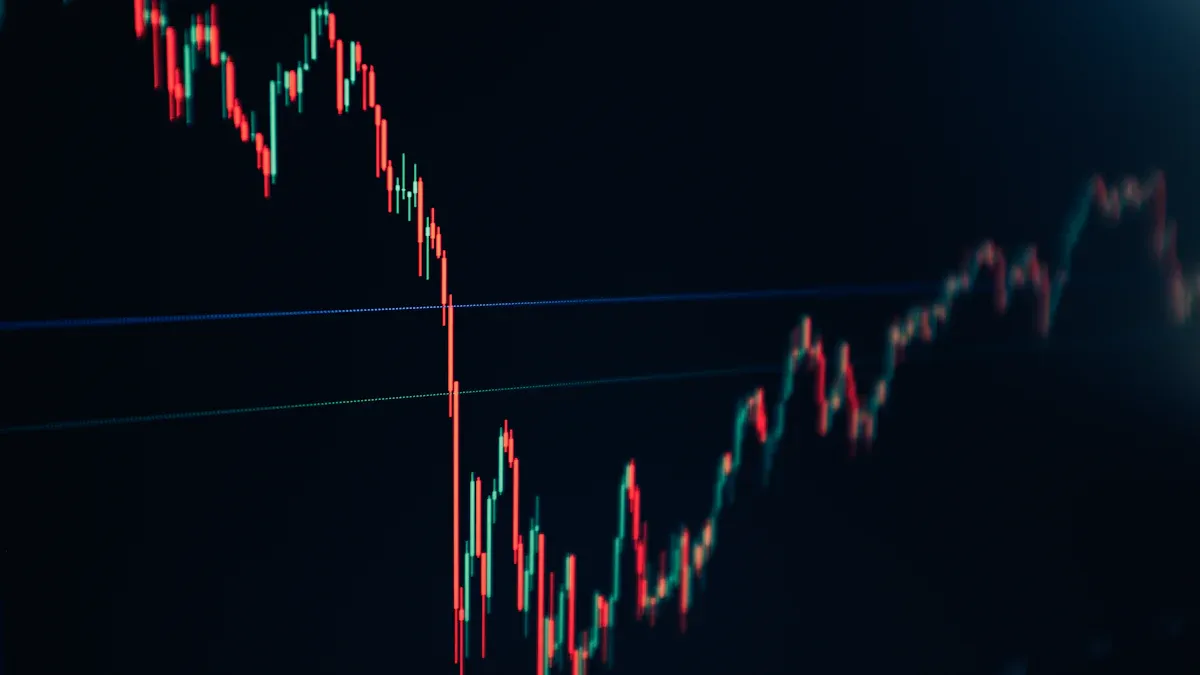
Image Source: unsplash
Market panic often makes it difficult for investors to gauge the true sentiment of the market. Many professionals and retail investors focus on the Put-Call Ratio (PCR) because it reflects changes in market sentiment. Data shows that the VIX index surged significantly in April, signaling market panic, while it dropped to a multi-year low in June, indicating investor optimism. Studies have found that PCR is not only positively correlated with portfolio returns but is also considered a reliable tool for predicting market direction.
- The put-call ratio sharply reverses during sentiment shifts.
- The AAII Investor Sentiment Survey reveals similar dynamics.
| Time | VIX Index Change | Sentiment State |
|---|---|---|
| April | Up 30.8 points | Panic |
| June | Dropped to multi-year low | Optimistic |
Key Points
- The Put-Call Ratio (PCR) is an essential tool for assessing market sentiment, helping investors gauge whether the market is optimistic or pessimistic.
- A high PCR value typically indicates market panic, and investors should pay attention to this signal to identify potential buying opportunities.
- A low PCR value reflects market optimism, but extremely low values may signal an approaching market top, requiring investor caution.
- Combining PCR with other market indicators, such as the Relative Strength Index (RSI), allows for a more comprehensive analysis of market sentiment, improving decision accuracy.
- During market sentiment shifts, timely adjustments to investment strategies can help seize trading opportunities based on PCR changes.
PCR Overview
Definition
The Put-Call Ratio (PCR) is a commonly used sentiment indicator in financial markets. Many investors and analysts use it to assess the overall market sentiment and future trends.
- This ratio compares the trading volume of put options to call options for a market index over a specific period, reflecting investors’ views on the market.
- When the PCR value is high, the trading volume of put options exceeds that of call options, typically indicating a bearish investor sentiment.
- When the PCR value is low, call option trading volume dominates, suggesting bullish market sentiment.
- Many large financial institutions and regulators use PCR as a key tool to measure market sentiment.
Calculation Method
Investors typically use the following formula to calculate PCR:
In addition to trading volume, some analysts use open interest to calculate PCR:
- PCR = Put Option Open Interest / Call Option Open Interest
Common data sources include major exchanges and financial information providers. For example, the Chicago Board Options Exchange (CBOE) publishes PCR data every half hour, serving as an authoritative source for real-time PCR data in the U.S. market.
| Source | Description |
|---|---|
| CBOE | The Chicago Board Options Exchange calculates PCR every half hour, serving as a reliable source for real-time PCR data. |
Data quality and timeliness are critical for market sentiment analysis. When interpreting PCR, investors typically combine it with other market indicators for a more comprehensive judgment.
Market Panic and PCR

Image Source: pexels
Value Ranges
Investors commonly use the Put-Call Ratio (PCR) to measure the degree of market panic. The PCR value range provides an intuitive reference for market sentiment. Academic research and industry practices have found that when PCR exceeds 0.7 or 1.0, market panic sentiment significantly intensifies.
The table below summarizes some authoritative studies on PCR value ranges:
| Researcher | Finding | Conclusion |
|---|---|---|
| Chakravarty, Gulen, and Mayhew (2004) | When PCR is in the lowest quintile (below 0.8), stocks have an average positive return of 0.43% in the following week | Low PCR values are typically associated with strong market performance |
| Billingsley and Chance (1988) | PCR values above the 95th percentile or below the 5th percentile are correlated with market reversals 68% of the time | Extreme PCR values can serve as contrarian indicators |
Typically, when PCR exceeds 1.0, the trading volume of put options significantly surpasses call options, indicating widespread investor concern about downside risks. This value range is often seen as a signal of market panic. Historical data shows that during the 2008 financial crisis, PCR surged above 1.2, reflecting extreme market panic. In March 2020, during the COVID-19 outbreak, PCR also spiked sharply, with investors broadly adopting defensive strategies.
Sentiment Signals
When the PCR value rises rapidly, investor sentiment often becomes extremely pessimistic. During market panic, many investors buy large amounts of put options to hedge risks, causing a significant increase in PCR.
Below are typical examples of PCR spikes associated with market panic:
- During the 2008 financial crisis, PCR exceeded 1.5, with investor panic at its peak, leading to massive market sell-offs. Some experienced traders used this period to engage in contrarian strategies, capitalizing on low prices caused by market panic.
- In March 2020, PCR surged sharply, with investors broadly worried about further market declines. Despite intense panic, the market subsequently experienced a historic rebound.
- Before the 1987 “Black Monday” crash, PCR also issued warning signals, indicating rising market panic.
High PCR values not only reflect market panic but are often a signal for contrarian investors. Many studies suggest that extreme market panic often foreshadows a market reversal. When interpreting PCR, investors should combine it with other market indicators to avoid relying solely on it.
Investor behavior patterns during market panic are also evident. Data shows that PCR, as a sentiment indicator, with high values typically represents bearish sentiment. Historical experience suggests that during market panic, investors tend to engage in irrational selling, but extreme panic may create conditions for a market rebound.
Market Euphoria and PCR
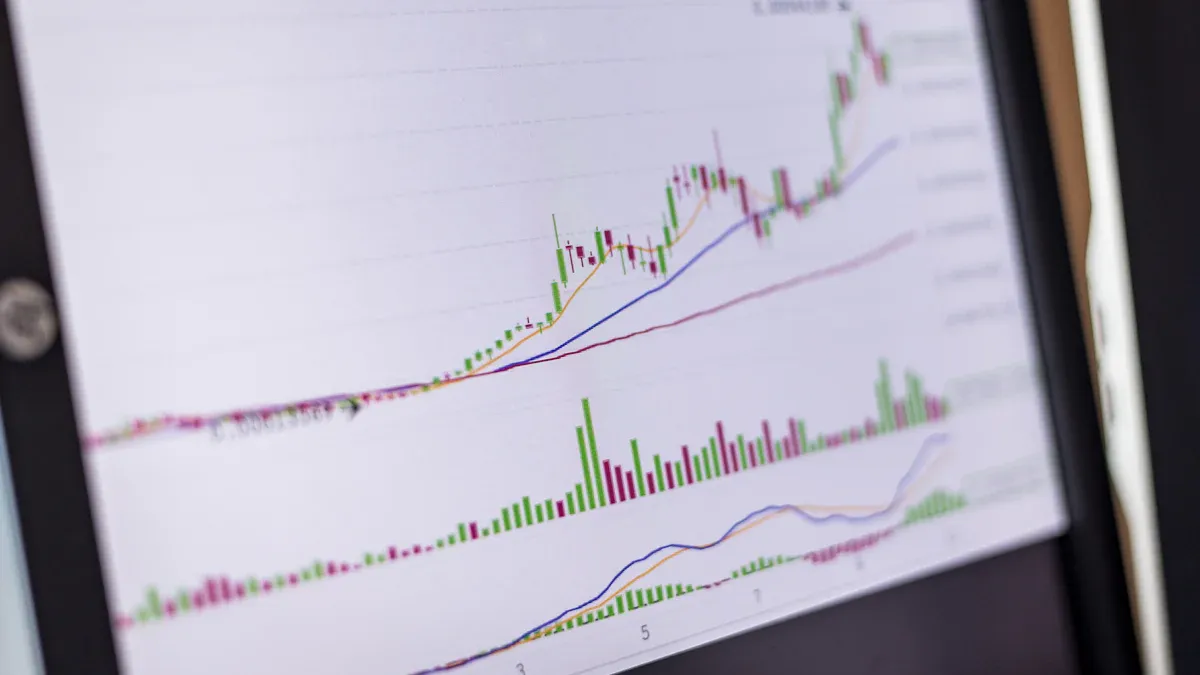
Image Source: pexels
Value Changes
During market euphoria, the Put-Call Ratio (PCR) typically declines significantly. Lower PCR values indicate that call option trading volume increases relative to put options, reflecting optimistic investor expectations.
Many empirical studies have found that when PCR declines, market participants generally believe the market will continue to rise. Investors during this phase are more inclined to buy call options, expecting to profit from market gains.
Below are typical characteristics of PCR value changes during market euphoria:
- During market optimism, PCR continues to decline, showing investor confidence in future trends.
- During major bull markets, the 21-day moving average (21dma) of PCR typically trends downward, reflecting sustained high market sentiment.
- At the end of the U.S. market bull run in early 2000, the number of traded call options was more than double that of put options, indicating extreme investor optimism.
- Low PCR values not only reflect optimism but may also signal an approaching market top. Institutional investors often view extremely low values as signs of market complacency and speculative bubbles.
While low PCR values reflect market optimism, extremely low values may also suggest overconfidence, requiring investors to remain cautious of potential risks.
Optimistic Signals
Historical data shows that extremely low PCR values are often accompanied by market euphoria and speculative sentiment. Below are typical optimistic signals and cases in the U.S. market:
- After the 2009 financial crisis, the U.S. stock market gradually recovered. PCR peaked at 1.3 in February, then quickly declined, kicking off a multi-year bull market. Early adopters capitalized on low prices during market panic, and as sentiment turned optimistic, PCR continued to drop.
- During the 2021 GameStop event, PCR fell to 0.39, indicating extreme optimism among retail traders. Many investors chased popular stocks, ignoring fundamental risks, leading to significant market volatility.
- Industry reports indicate that low PCR values typically signal bullish sentiment, potentially foreshadowing market gains. However, excessively low PCR often reflects market complacency and speculative bubbles, requiring investor caution.
When interpreting PCR, investors should focus on its relationship with market sentiment. Lower PCR values indicate market optimism, but extremely low values may signal an approaching market top. Institutional investors typically combine other indicators to comprehensively assess whether the market is entering an irrational euphoria phase.
Signal Interpretation
Neutral Range
When analyzing the Put-Call Ratio (PCR), investors often focus on the value range. Generally, a PCR value around 0.7 indicates neutral market sentiment. At this level, the trading volumes of call and put options are relatively balanced, with the market showing no clear optimistic or pessimistic bias. The table below summarizes market sentiment corresponding to different PCR values:
| PCR Value | Market Sentiment |
|---|---|
| 0.7 | Neutral |
| >0.7 | Bearish |
| <0.7 | Bullish |
Investors can observe PCR changes to determine whether market sentiment is shifting.
- A PCR value of 0.7 typically indicates the market is in a wait-and-see phase, with investor sentiment relatively stable.
- When PCR exceeds 0.7, bearish sentiment strengthens, and investors lean toward defensive strategies.
- Below 0.7, the market shows optimism, with investors more willing to take risks.
Comparing current PCR with historical data helps identify significant shifts in market sentiment. For example, in 2020, the U.S. market saw PCR spike during periods of panic, then gradually return to the neutral range, reflecting a sentiment recovery process.
Contrarian Indicator
Many professional investors use PCR as a contrarian indicator to aid decision-making. High PCR values typically indicate extremely pessimistic market sentiment, prompting some investors to believe the market decline is nearing its end, seeking buying opportunities. Conversely, extremely low PCR values reflect excessive optimism, potentially signaling an approaching market top, leading some investors to consider reducing positions or selling.
- High PCR values (e.g., above 1.0) often occur during significant market declines or panic, followed by potential rebounds.
- Low PCR values (e.g., below 0.7) are common during sustained market uptrends with high investor sentiment, but they may also conceal risks.
Historical data shows that extreme PCR readings often precede market reversals. In practice, investors typically do not rely solely on PCR signals but combine them with other technical indicators, volume patterns, or volatility indices (e.g., VIX) for comprehensive judgment.
Traders have found that combining PCR with other market sentiment indicators provides a more comprehensive understanding of market psychology, enhancing investment decision accuracy.
Advantages and Limitations
Advantages
The Put-Call Ratio (PCR) offers several advantages in market sentiment analysis.
- PCR provides traders with intuitive insights into overall market sentiment, helping identify trading opportunities.
- The indicator excels at identifying extreme market states (e.g., overbought or oversold), promptly reflecting changes in investor sentiment.
- Many contrarian traders use extreme PCR values to capture opportunities arising from market psychology biases.
- Compared to other sentiment indicators, PCR data is transparent and publicly available, accessible in real-time through major U.S. exchanges and financial information providers.
By observing PCR changes, investors can better understand market sentiment fluctuations, providing strong references for investment decisions.
Limitations
While PCR offers valuable insights for market sentiment analysis, it is not a foolproof tool.
Many novice investors may misinterpret PCR signals. For example, some assume high PCR values inevitably signal an imminent rebound, ignoring market context and other influencing factors. PCR has no absolute boundaries, and extreme values do not always accurately predict market trends. Even if PCR indicates high bearish sentiment, the market may continue to decline. Thus, risk management remains critical.
- PCR cannot be used as the sole basis for investment decisions. Investors should combine it with other technical indicators and market data for comprehensive analysis. For example, integrating open interest (OI), Relative Strength Index (RSI), Bollinger Bands, Intraday Momentum Index (IMI), and Money Flow Index (MFI) provides a fuller assessment of market conditions.
- Market sentiment is influenced by multiple factors, such as macroeconomic data, policy changes, and unexpected events, and relying solely on PCR may lead to misjudgments.
Professional investors typically use PCR as a supplementary tool for market sentiment, combining multiple analysis methods to enhance the scientific rigor and safety of investment decisions.
Misconceptions
Common Misunderstandings
Many investors make mistakes when interpreting the Put-Call Ratio (PCR). Financial education institutions have summarized the following common errors:
- Investors often assume PCR is directly correlated with market sentiment, overlooking the complex market mechanisms behind it.
- High PCR values do not always indicate an imminent market decline; they can also appear during price uptrends.
- Market sentiment often peaks before prices reach their highs, leading investors to misjudge timing.
- Momentum investors may view high PCR as a bearish signal and choose to short the market, while contrarian investors see high PCR as a bullish signal, opting to establish long positions.
- Different investment styles lead to divergent interpretations of PCR, which can cause decision biases.
When analyzing PCR, investors should consider market realities and their own investment strategies, avoiding mechanical application of formulas or reliance on single signals.
Risk Warnings
Investment professionals caution that relying solely on PCR as a market sentiment indicator carries multiple risks:
- PCR cannot fully reflect market sentiment, potentially overlooking significant factors like economic events, policy changes, or breaking news.
- For stocks without options, PCR cannot be calculated, limiting its applicability.
- Relying only on PCR without other technical indicators may lead to misjudgments of market trends.
- Small PCR changes can sometimes trigger significant market volatility, requiring accurate chart interpretation.
- When making decisions based on PCR, investors should fully consider their risk tolerance and financial goals, avoiding blind trend-following.
Using PCR rationally, combined with multiple market indicators and information sources, helps improve the scientific rigor and safety of investment decisions. Investors should remain rational and cautious of misguidance from single indicators.
Practical Methods
Quick Assessment
Investors can quickly gauge market sentiment by observing PCR changes. Experienced traders commonly use the following methods for judgment:
| Put-Call Ratio | Market Sentiment Interpretation |
|---|---|
| PCR rises with slight uncertainty in a downtrend | Option sellers actively write during declines, expecting an imminent trend. |
| PCR declines while struggling at resistance levels | Bearish trend signal. |
| PCR declines in a bearish market | Option sellers actively sell call options in the stock market. |
In practice, investors have found that when the market is in an uptrend and PCR is below 1, sentiment leans optimistic. At this time, many traders consider increasing call option positions. Conversely, if PCR rises and market prices fall, sentiment turns pessimistic, and investors may focus on put option opportunities. By combining PCR with market trends, investors can more quickly identify sentiment shifts and adjust strategies accordingly.
Operational Recommendations
In different market environments, investors should adopt corresponding strategies:
- When the market is optimistic and PCR is below 1, investors can focus on call options to capture upside opportunities.
- During market declines with rising PCR, investors may consider allocating put options to hedge risks.
- When PCR is in the neutral range (around 0.7), market sentiment is stable, and investors can remain observant, waiting for clearer signals.
- When extreme PCR values appear, some contrarian investors choose to act against prevailing sentiment. For example, at extremely high PCR, they seek buying opportunities; at extremely low PCR, they stay cautious of market pullbacks.
When applying PCR in practice, investors should combine it with other market indicators and their risk tolerance, avoiding sole reliance. Multi-dimensional analysis enhances the scientific rigor and safety of investment decisions.
The Put-Call Ratio (PCR) plays a central role in identifying market panic and euphoria. Investors can combine the following table of market sentiment indicators to enhance analysis comprehensiveness:
| Indicator Name | Description |
|---|---|
| NYSE Short Interest | Reflects short-term market sentiment |
| Put/Call Ratio | Directly reflects market panic and euphoria |
| AAII Survey | Shows retail investor sentiment |
Experts recommend that investors combine PCR with technical indicators like moving averages and Relative Strength Index to rationally assess market changes and flexibly adjust strategies.
- When model readings fall below -0.17, the probability of a market rebound after panic is high.
- When model readings exceed 0.41, the probability of a market decline after euphoria is significant.
FAQ
What is the Put-Call Ratio (PCR)?
The Put-Call Ratio (PCR) is the ratio of put option trading volume to call option trading volume. Investors commonly use it to measure market sentiment. The U.S. market frequently references this indicator.
Where Can I Obtain PCR Data?
Investors can access PCR data from major U.S. exchanges like the Chicago Board Options Exchange (CBOE). Financial information providers also offer real-time PCR values.
Which Markets Is PCR Applicable To?
PCR is primarily used in markets with active options trading, such as the U.S. stock market and index options markets. Assets without options cannot have PCR calculated.
Can PCR Be Used as a Standalone Buy/Sell Signal?
Professionals advise against relying solely on PCR. Investors should combine it with other technical indicators and market information to assess sentiment comprehensively, reducing investment risks.
What Do Extreme PCR Values Indicate?
High PCR typically indicates market panic, while low PCR reflects market optimism. Historical data suggests that extreme values may foreshadow market reversals. Investors should interpret them cautiously.
By mastering the Put-Call Ratio (PCR) to gauge market fear or euphoria, you’ve unlocked signals for sentiment shifts, but high cross-border fees, currency volatility, and offshore account complexities can limit acting on U.S. options market swings, especially during PCR extremes or sentiment reversals. Imagine a platform with 0.5% remittance fees, same-day global transfers, and zero-fee contract limit orders, enabling seamless sentiment plays via one account?
BiyaPay is tailored for sentiment traders, offering instant fiat-to-digital conversions to capitalize on PCR signals nimbly. With real-time exchange rate query, monitor USD trends and transfer at optimal moments to cut costs. Covering most regions with instant arrivals, it powers rapid allocations to S&P 500 options (like SPX) or high-PCR stocks. Crucially, trade U.S. and Hong Kong markets through a single account, leveraging zero-fee contract limit orders for contrarian strategies.
Whether seizing high-PCR fear rebounds or dodging low-PCR euphoria pullbacks, BiyaPay fuels your edge. Sign up now, visit stocks for U.S. prospects—quick setup unlocks cost-effective, data-driven trading. Join global traders and thrive in 2025’s sentiment swings!
*This article is provided for general information purposes and does not constitute legal, tax or other professional advice from BiyaPay or its subsidiaries and its affiliates, and it is not intended as a substitute for obtaining advice from a financial advisor or any other professional.
We make no representations, warranties or warranties, express or implied, as to the accuracy, completeness or timeliness of the contents of this publication.


Contact Us
Company and Team
BiyaPay Products
Customer Services


is a broker-dealer registered with the U.S. Securities and Exchange Commission (SEC) (No.: 802-127417), member of the Financial Industry Regulatory Authority (FINRA) (CRD: 325027), member of the Securities Investor Protection Corporation (SIPC), and regulated by FINRA and SEC.
registered with the US Financial Crimes Enforcement Network (FinCEN), as a Money Services Business (MSB), registration number: 31000218637349, and regulated by FinCEN.
registered as Financial Service Provider (FSP number: FSP1007221) in New Zealand, and is a member of the Financial Dispute Resolution Scheme, a New Zealand independent dispute resolution service provider.