- EasyCard
- Trade
- Help
- Announcement
- Academy
- SWIFT Code
- Iban Number
- Referral
- Customer Service
- Blog
- Creator
Still Watching Price? The Real Pros Are Eyeing Volume Moving Average!


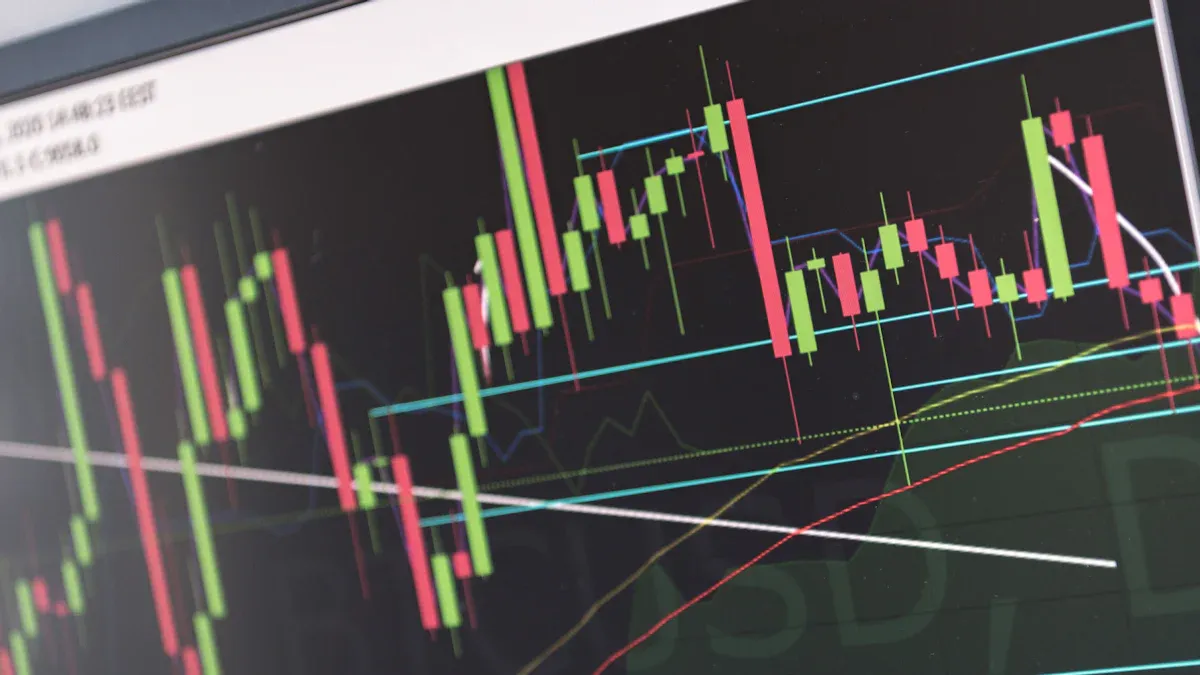
Image Source: pexels
Do you often rely solely on price to judge buying and selling opportunities? In fact, experts pay more attention to volume moving averages. By observing volume moving averages, you can uncover the true movements of major funds. In the U.S. market, many investors use volume moving averages to gauge market sentiment and capital flow. If you only focus on price, you may miss the signals of major players’ strategies. Volume moving averages can help you enhance your analysis and see the true nature of the market.
Key Points
- Focusing on volume moving averages allows you to better gauge market sentiment and capital flow, avoiding the misguidance caused by only watching prices.
- Volume moving averages help identify the authenticity of market trends, with consistently rising volume often indicating trend continuation.
- Through volume analysis, you can filter out false market signals, improving the accuracy of trading decisions.
- Observing divergences between price and volume can help predict market trend changes in advance, reducing investment risks.
- Combining volume moving averages with other technical indicators allows for a more comprehensive market analysis, enhancing the scientific basis of investment decisions.
Pitfalls of Watching Prices
Limitations of Price Fluctuations
If you only look at prices, you can easily be misled by market appearances. Many investors fall into common pitfalls:
- Believing that investing is like gambling and market outcomes are unpredictable.
- Feeling the need to monitor the market constantly, which often increases anxiety.
- Assuming all stocks are similar, ignoring the importance of diversification.
- Always aiming for quick riches, leading to impulsive decisions.
Research from the U.S. market shows that prices are often manipulated, and investors who only focus on prices are prone to buying manipulated stocks, ultimately suffering losses. The table below shows relevant research findings:
| Research Topic | Results |
|---|---|
| Impact of opening price manipulation on market behavior | Manipulated stocks typically experience significantly lower returns and higher price reversal probabilities. |
| Outcomes for investors buying manipulated stocks at opening or weighted average prices on manipulation days | Investors suffer losses. |
| Impact of manipulation on market trading activity and price volatility | Manipulation increases market trading activity and price volatility. |
If you only focus on prices, you often overlook the underlying capital flows and market sentiment.
True Market Intentions
Price fluctuations do not accurately reflect the true intentions of major funds. For example, from 2021 to the end of 2023, U.S. 10-year Treasury rates rose significantly, but the change in capitalization rates was much smaller than expected, indicating that prices did not fully reflect market changes. The U.S. REIT market index only fell slightly during tariff announcements, with limited actual value changes.
Volume moving averages can help you uncover the true intentions of market participants. By observing volume moving averages, you can see where funds are concentrated, gauge market psychology, and understand the strategies of major players. Volume moving averages also reduce subjective judgments in technical analysis, allowing you to analyze market activity and capital flow with data rather than just prices.
Role of Volume Moving Averages
Image Source: pexels
Volume moving averages are not just auxiliary indicators. You can use them to directly observe market activity and capital flow. Many U.S. investors use volume moving averages to gauge market sentiment and the true movements of major funds. The table below shows several common volume-related indicators and their functions:
| Indicator Name | Function Description |
|---|---|
| Money Flow Index | Measures capital inflow and outflow over a specific period. |
| Negative Volume Index | Gauges “smart money” activity on low-volume days, assuming smart money is more active on such days. |
| On-Balance Volume | Uses trading volume to predict subsequent price changes, assuming that if volume changes without significant price reaction, price movement may follow. |
| Positive Volume Index | Shows institutional investor activity on low-volume days, assuming they are more likely to buy or sell when volume rises. |
| Williams Accumulation/Distribution | Observes divergences between security prices and volume flow to determine whether traders are accumulating (buying) or distributing (selling). For example, when prices hit a new low but the indicator does not, it may indicate accumulation (buying). |
Trend Confirmation
When analyzing market trends, you cannot rely solely on prices. Volume moving averages can help you verify the authenticity of trends. U.S. market experience shows that Moving Average Volume Divergence (MAVD) is highly effective in predicting stock returns and confirming market trends.
- When volume moving averages rise consistently, it indicates active market funds and a higher likelihood of trend continuation.
- If volume moving averages decline, market participation weakens, and the trend may reverse soon.
- Research shows that volume moving averages have a negative predictive effect on future returns. You can use them to assess market sentiment and potential price movements.
- During periods of high sentiment and investor attention, the effect of volume moving averages is more pronounced. By observing changes in volume moving averages, you can detect trend turning points earlier, avoiding being misled by short-term price fluctuations.
Signal Filtering
The market often produces false signals. If you only focus on prices, you can easily be misled by false breakouts or reversals. Volume moving averages can help you filter out this noise.
- You can use On-Balance Volume (OBV) to verify price movements. If prices rise but volume moving averages do not follow, the upward momentum is weak, and the signal is unreliable.
- Divergences between OBV and price action often signal an impending trend reversal or weakening market participation.
- During breakouts at key price levels, if volume moving averages significantly increase, it indicates active participation by major funds, making the breakout more credible. Conversely, low-volume breakouts often fail quickly.
- You can also combine volume moving averages with support and resistance levels to form more robust trading strategies, reducing misjudgments. Through these methods, you can effectively improve the accuracy of trading signals and reduce unnecessary losses.
Judging Major Player Behavior
If you want to understand the true movements of major funds, volume moving averages are an indispensable tool.
- When prices rise with high volume, it indicates that major funds are actively driving the market.
- If prices rise but volume moving averages do not increase, it may be retail investors following the trend, with major players not truly participating.
- You can identify divergences between price and volume to predict trend changes in advance.
- In the U.S. market, investors often use Volume-Weighted Average Price (VWAP) to determine optimal entry and exit points.
- When the market experiences significant selling with a surge in volume, it often signals that a market bottom is near, and major funds may start accumulating.
- Unusual volume patterns often indicate institutional fund activity. Volume moving averages help you see the capital flow behind the market, improving your ability to identify major player behavior.
Tip: Volume not only reflects market liquidity but also reveals investor sentiment. High-volume stocks react faster to market information, with stronger short-term return predictability. By combining volume moving averages with price trends, you can more scientifically grasp the market rhythm.
Price-Volume Relationship
Price Rises, Volume Increases
When analyzing the market, you often see prices rising with increasing volume. This phenomenon indicates strong buying pressure and active participation by major funds. Many studies find that higher trading volume is closely related to higher stock returns. For example, Chui and others’ research in Pacific capital markets shows that stock returns are higher when trading volume rises. Statman and others also found a positive correlation between trading volume and lagged returns.
- When trading volume increases, price rises are more sustainable.
- If prices rise but volume does not increase accordingly, the upward trend is often unsustainable.
Subsequent studies also indicate a correlation between the absolute value of price changes and trading volume. You can assess whether price rises have momentum by observing volume changes.
Price Falls, Volume Decreases
When you see prices falling but volume decreasing, it suggests weakening seller confidence. Many market studies show that this phenomenon often signals a potential trend reversal. The table below summarizes related phenomena and explanations:
| Phenomenon | Explanation |
|---|---|
| Price falls + Volume decreases | Weakening seller confidence, potentially leading to a trend reversal. |
| Low trading volume | Limited market confidence in price changes. |
| Weak trend | Increased potential for price rebounds. |
By focusing on volume changes during price declines, you can capture signals of market reversals in time.
Volume Divergence
Volume divergence is an important tool for identifying market turning points. There are two common types of divergence:
- When prices fall but internal market indicators (e.g., A/D line) rise, it often signals an upcoming upward reversal.
- When prices rise but volume or internal indicator momentum weakens, it often signals an upcoming downward reversal.
When you notice prices at highs but volume decreasing, it may indicate that major funds are gradually selling off, increasing the risk of a trend reversal. By observing the lack of synchronization between price and volume, you can detect market changes in advance.
Extreme Sentiment and Reversals
Extreme sentiment is often accompanied by unusual volume. In the market, you’ll notice that during positive sentiment, investors buy heavily, volume surges rapidly, and prices rise sharply in the short term. During negative sentiment, investors sell off urgently, volume spikes, and prices fall quickly.
- During sentiment-driven periods, volume often reaches 3-5 times the usual level.
- During high-sentiment periods, price fluctuations exceed the average by 2-3 standard deviations.
By analyzing extreme volume changes, you can determine whether market sentiment is overheated or overly cold. When volume suddenly surges or drops significantly, it often signals an impending trend reversal. Volume analysis helps you assess the strength and health of trends, improving your ability to grasp market turning points.
Practical Applications
Bottom Identification
When judging market bottoms, you cannot rely solely on prices. Volume moving averages can help you spot subtle signs of a market bottom. In the U.S. market, many investors focus on the following signals:
- After consecutive price declines, volume moving averages gradually converge, indicating weakening selling pressure.
- Certain trading days show high volume with long lower shadows, suggesting funds are absorbing at low levels.
- Volume moving averages show mild increases in the bottom area, indicating quiet entry by major funds.
You can combine candlestick patterns with volume moving averages to improve the accuracy of bottom identification. For example, bottom areas often show tight price action, reduced volume, and similar weekly closing prices. These characteristics suggest institutional investors are quietly accumulating stocks without significantly pushing up prices. By observing these signals, you can detect market bottoms earlier and avoid missing rebound opportunities.
Major Player Accumulation
If you want to determine whether major funds are accumulating, volume moving averages are a key tool. U.S. market experience shows that accumulation periods typically have the following characteristics:
- Price fluctuation ranges narrow, with volume moving averages remaining low.
- Weekly closing prices show little change, and the market appears stable.
- Volume moving averages occasionally increase mildly, but prices do not rise significantly.
These phenomena indicate that institutional investors are quietly accumulating to avoid attracting market attention. You can identify major player accumulation through the following methods:
- Observe the interaction between volume moving averages and prices to detect funds repeatedly entering and exiting at low levels.
- Combine candlestick patterns to identify signals like bottom consolidation and low-volume ranges.
- Pay attention to tight price action and reduced volume, which are typical signs of major player accumulation.
Through these methods, you can better grasp the rhythm of major fund strategies and improve the safety of your buying decisions.
Capital Flow
When analyzing market capital flow, volume moving averages provide intuitive signals. U.S. market research shows a close relationship between capital flow and price trends. You can track capital flow through the following methods:
- When prices rise and net capital inflow is active within a unit of time, the market is strong, and future prices are more likely to continue rising.
- When stock prices rise but net capital outflow is active within a unit of time, the market is moderately strong, and future price increases will slow.
- When stock prices fall but net capital inflow is active within a unit of time, the market is weak, and future prices are more likely to continue falling.
- When stock prices fall and net capital outflow is active within a unit of time, the market is moderately weak, and future price declines will slow.
By combining volume moving averages with capital flow, you can more accurately judge market strength and adjust your strategies in time.
Indicator Coordination
To improve trend prediction accuracy, you cannot rely on a single indicator. U.S. market investors often use the following methods:
- Use moving averages to confirm trends and determine market direction.
- Combine volume analysis with candlestick patterns to identify key turning points.
- Use technical indicators like MACD or RSI to validate buy and sell signals.
- Apply candlestick pattern filters to assess overall market trends and overbought or oversold conditions.
By combining volume moving averages with candlestick patterns, you can analyze the market more comprehensively. Volume moving averages reveal capital flow, while candlestick patterns reflect price action. You can also use indicators like MACD and RSI to assist in judgments, avoiding errors from single signals. This way, you can improve your ability to predict future trends and make more scientific investment decisions.
Case Studies

Image Source: pexels
Stock Case Study
By analyzing historical stock data from the U.S. market, you can discover the practical value of volume moving averages. Many investors use historical price and volume data to identify market trends and patterns.
- You can use moving averages to identify support and resistance levels and determine price trend directions.
- When prices approach volume moving averages, the market often sees rebounds or breakouts, providing dynamic buy and sell signals.
- Simple Moving Averages (SMA) and Exponential Moving Averages (EMA) each have advantages. SMA signals are more stable, while EMA reacts more quickly but may produce false breakouts.
- You can combine different types of moving averages to improve trend judgment accuracy.
Identifying Buy and Sell Points
In actual trading, you can use volume moving averages to assist in identifying buy and sell points.
- When prices pull back to volume moving averages and find support, the market often rebounds, and you can consider buying.
- If prices break below volume moving averages with increased volume, the market may enter a downtrend, and you can consider selling.
- Moving averages not only track trends but also serve as dynamic support and resistance, helping you time entries and exits.
- By observing the relationship between prices and moving averages, combined with volume changes, you can enhance the scientific basis of trading decisions.
Technique Tip: When analyzing buy and sell points, you can combine volume moving averages with candlestick patterns and indicators like MACD to avoid errors from single signals.
Avoiding Pitfalls
When using volume moving averages, you may encounter common pitfalls.
- You may misinterpret VWMA signals in low-volume markets, leading to incorrect decisions.
- Over-relying on VWMA while ignoring other market factors can cause you to miss optimal buy and sell opportunities.
- VWMA has a lagging nature, making it less effective in rapidly changing markets.
- Failing to distinguish between short-term and long-term VWMA applications may lead to misjudgments of market direction.
By combining multiple technical indicators and focusing on the overall market environment, you can avoid these pitfalls. Maintaining rational analysis is key to improving your investment skills.
Experts vs. Ordinary Investors
Price-Volume Thinking
If you only focus on prices, you may overlook the true forces behind the market. Experts combine volume and price for analysis, forming a price-volume mindset. You can understand their approach through the following points:
- Professional traders use volume analysis to confirm trends, while ordinary investors often overlook this.
- During breakout trades, experts focus on volume increases as a key signal for trend confirmation.
- You can use volume changes to judge whether price trends are sustainable. Price movements with low volume often lack confidence.
By combining price and volume, you can better grasp market sentiment and trend strength, improving the scientific basis of trading decisions.
Common Pitfalls
Many ordinary investors fall into pitfalls during actual trading:
- Focusing only on prices and ignoring volume, missing the true movements of major funds.
- Chasing price rises without analyzing whether volume increases accordingly.
- Ignoring high-volume nodes and control points, failing to accurately gauge market sentiment.
- Treating price fluctuations in low-volume conditions as signals, leading to being misled by market illusions.
By avoiding these pitfalls, you can reduce the risk of being swayed by market sentiment.
Tip: Traders who focus on volume often achieve greater success, as volume reflects market psychology and trend strength. By analyzing high-volume nodes, you can uncover major fund strategies.
Practical Advice
To improve your trading skills, you can refer to the following practical advice:
- Look for volume increases in the direction of the trend. Rising volume in an uptrend indicates a stronger trend.
- Be skeptical of price movements without corresponding volume. Low-volume price changes may not reflect true market sentiment.
- Use Volume Price Trend (VPT) to confirm price breakouts. Rising VPT suggests breakouts are more likely to continue.
- Monitor volume divergences. If prices hit new highs but volume does not confirm, it may signal weakening trends.
- You can also use Volume-Weighted Average Price (VWAP) as dynamic support or resistance to identify entry and exit points.
By applying these methods, you can more effectively incorporate volume moving averages into your trading strategies, improving their scientific basis and stability.
By focusing on volume moving averages, you can better protect yourself, especially during market volatility. Moving averages not only help you manage risk but also combine with candlestick patterns to confirm buy signals. You can learn the basic concepts of moving averages, crossover strategies, and advanced applications. By combining volume analysis, you can more accurately judge market trends and improve your trading skills. Start focusing on volume moving averages now and take steps toward becoming an expert.
FAQ
What’s the difference between volume moving averages and price moving averages?
You can use price moving averages to judge price trends. You use volume moving averages to analyze market activity and capital flow. Combining both can improve your analysis accuracy.
How do I choose the right volume moving average period?
You can choose based on your trading timeframe. Short-term traders often use 5-day or 10-day moving averages. Medium- to long-term traders can use 20-day or 30-day moving averages.
Can volume moving averages be used alone as buy and sell signals?
You are not advised to rely solely on volume moving averages for decisions. You can combine them with candlestick patterns, MACD, and other indicators to improve signal reliability.
What volume indicators are commonly used in the U.S. market?
You can use indicators like OBV, VWAP, and Money Flow Index. These tools help you gauge capital flow and market sentiment.
Are volume moving averages effective in different market environments?
You’ll find volume moving averages more effective in trending markets. In choppy markets, you need to combine them with other indicators for analysis.
By mastering volume moving averages, you’ve learned to track institutional money flows and avoid price-driven missteps, but high cross-border fees, currency volatility, and offshore account complexities can limit acting on U.S. volume-price signals, especially for swift breakouts or position tweaks. Imagine a platform with 0.5% remittance fees, same-day global transfers, and contract limit orders with zero fees, enabling seamless volume-based strategies via one account?
BiyaPay is tailored for volume-price traders, offering instant fiat-to-digital conversions to capitalize on volume signals nimbly. With real-time exchange rate query, monitor USD trends and transfer at optimal moments to cut costs. Covering most regions with instant arrivals, it powers rapid allocations to S&P 500 ETFs (like SPY) or high-volume stocks. Crucially, trade U.S. and Hong Kong markets through a single account, leveraging contract limit orders with zero fees for VWAP or OBV-based limit strategies.
Whether chasing trend breakouts or dodging false signals, BiyaPay fuels your edge. Sign up now, visit stocks for U.S. prospects—quick setup unlocks cost-effective, data-driven trading. Join global traders and thrive in 2025’s market swings!
*This article is provided for general information purposes and does not constitute legal, tax or other professional advice from BiyaPay or its subsidiaries and its affiliates, and it is not intended as a substitute for obtaining advice from a financial advisor or any other professional.
We make no representations, warranties or warranties, express or implied, as to the accuracy, completeness or timeliness of the contents of this publication.


Contact Us
Company and Team
BiyaPay Products
Customer Services


is a broker-dealer registered with the U.S. Securities and Exchange Commission (SEC) (No.: 802-127417), member of the Financial Industry Regulatory Authority (FINRA) (CRD: 325027), member of the Securities Investor Protection Corporation (SIPC), and regulated by FINRA and SEC.
registered with the US Financial Crimes Enforcement Network (FinCEN), as a Money Services Business (MSB), registration number: 31000218637349, and regulated by FinCEN.
registered as Financial Service Provider (FSP number: FSP1007221) in New Zealand, and is a member of the Financial Dispute Resolution Scheme, a New Zealand independent dispute resolution service provider.