- EasyCard
- Trade
- Help
- Announcement
- Academy
- SWIFT Code
- Iban Number
- Referral
- Customer Service
- Blog
- Creator
Detailed Explanation of the 10-K Report: A Guide to Understanding Corporate Finances for Investment


Image Source: unsplash
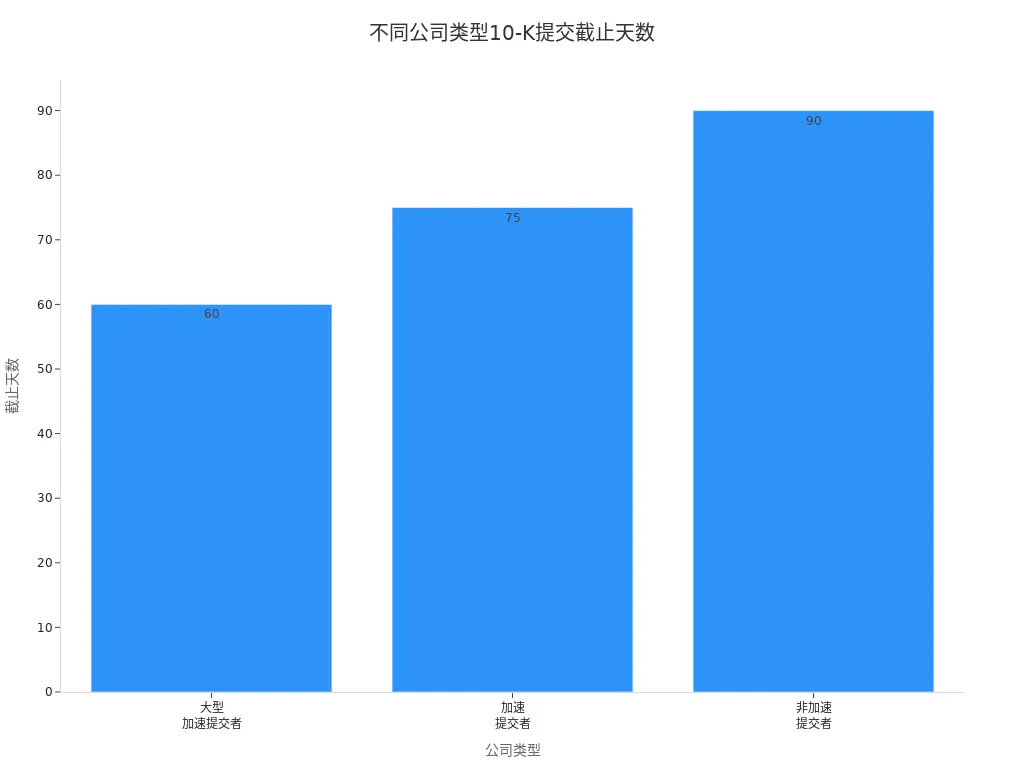
When investing in U.S. companies, you will frequently encounter the 10-K report. U.S. public companies are required to file a 10-K report with the Securities and Exchange Commission (SEC), disclosing detailed information about the past fiscal year’s operations, including audited financial statements and management’s analysis. The filing deadlines for different company types are as follows:
| Filer Category (Public Float) | 10-K Filing Deadline | 10-Q Filing Deadline |
|---|---|---|
| Large Accelerated Filer ($700MM or more) | 60 days | 40 days |
| Accelerated Filer ($75MM or more but less than $700MM) | 75 days | 40 days |
| Non-Accelerated Filer (Less than $75MM) | 90 days | 45 days |
You may wonder about the difference between a 10-K report and an annual report. The 10-K report is more detailed, suitable for accounting research, and contains minimal images or charts. The annual report, on the other hand, is more visually appealing and concise, making it easier to quickly understand a company’s situation. By mastering the structure and reading methods, you can quickly filter out key information, especially in the MD&A and business sections, to uncover investment value.
Key Takeaways
- The 10-K report is a detailed financial report that U.S. public companies must file, providing authoritative information on a company’s operating condition and financial health.
- When reading a 10-K report, focus on the Management’s Discussion and Analysis (MD&A) section, which includes in-depth insights into the company’s future outlook and potential risks.
- The 10-K report differs from the annual report; the former is more detailed and suitable for in-depth analysis, while the latter is more visually appealing and ideal for a quick overview.
- Mastering the structure of the 10-K report and key financial metrics, such as Return on Investment (ROI) and Earnings Per Share (EPS), can help you better evaluate a company’s performance.
- Using effective reading methods, such as quick navigation and information filtering, can help you find the most valuable content amidst vast amounts of information.
Detailed Guide to 10-K Reports and Investment Value

Image Source: pexels
Investor Focus Areas
What should you focus on when reading a detailed guide to 10-K reports? The 10-K report provides the most authoritative and comprehensive financial information about a company. You can use it to understand the company’s operating condition, financial health, and future development direction. Many investors pay particular attention to the following aspects:
- The company’s core business and industry position
- The authenticity and reliability of financial statements
- Management’s outlook and plans for the company’s future
- Potential risk factors and mitigation measures
You need to know that the disclosures in a 10-K report carry significant legal weight. The SEC requires companies to truthfully disclose all material information. Companies face severe penalties for false disclosures.
Studies on the accuracy and reliability of 10-K reports show:
| Study Content | Result |
|---|---|
| Accelerating 10-K filing by 15 days | Leads to more financial restatements |
| Accelerating 10-K filing by 15 days | Reduces information asymmetry |
| Accelerating 10-K filing by 15 days | Does not lead to stronger market reactions |
| Investor attention to accelerated 10-K filings | Lower, due to limited attention |
You can see that while accelerating 10-K filings helps reduce information asymmetry, it may also lead to more financial restatements. When interpreting the report, you should focus on its completeness and whether there are subsequent revisions.
Additionally, the 10-K report adheres to the reliability principle. Companies only record transactions verifiable by objective evidence, such as sales orders, purchase receipts, invoices, and bank statements, which are reliable data sources.
Key Information Interpretation
When analyzing a 10-K report, the most important task is to focus on key financial metrics. These metrics help you quickly assess a company’s profitability, solvency, and growth potential. Common key financial metrics include:
- Return on Investment (ROI): Measures the returns generated from investments.
- Earnings Per Share (EPS): Reflects the company’s per-share profitability.
- Debt-to-Equity Ratio: Shows the proportion of debt financing to equity financing.
- Price-to-Earnings Ratio (P/E Ratio): Evaluates the relationship between the company’s current stock price and its profitability.
- Dividend Yield: Measures the proportion of dividend income relative to the investment price.
- Price-to-Book Ratio (P/B Ratio): Compares the company’s market value to its book value.
- Operating Profit Margin: Reflects the company’s operational efficiency.
- Free Cash Flow (FCF): Indicates the company’s financial flexibility.
- Return on Equity (ROE): Measures the company’s ability to generate profits using shareholders’ funds.
- Beta: Measures the volatility of the company’s stock price.
You should also pay special attention to the Management’s Discussion and Analysis (MD&A) section. Analysts typically interpret MD&A as follows:
| Theme | Description |
|---|---|
| Structure | MD&A should provide an overview and analysis of financial statements, focusing on significant changes, budget variances, capital assets, and related matters. |
| Objective | MD&A aims to analyze the company’s financial condition and operating results, discussing improvements or deteriorations in financial status. |
| Readability | MD&A should be written by financial managers, maintaining objectivity and readability, using charts to enhance understanding. |
Through the MD&A section, you can understand management’s views on the company’s future, challenges, and strategies. This section often provides more investment value than raw financial data alone.
Differences Between 10-K and Other Financial Reports
Comparison with Annual Reports
When investing in U.S. public companies, you will often see both 10-K reports and annual reports. While both help you understand a company, their structure and purpose differ significantly. The 10-K report is primarily for compliance, with more formal and detailed content. The annual report focuses on attracting shareholders, with a more visually appealing design and concise information. You can quickly compare the two in the table below:
| Feature | 10-K Report | Annual Report |
|---|---|---|
| Purpose | Complies with SEC guidelines, providing detailed information | Aims to attract shareholders, includes more qualitative information |
| Format | More formal and clinical | More visually appealing, often a glossy booklet |
| Content Focus | Financial activities, risks, legal liabilities, etc. | Includes CEO letter, company structure overview, etc. |
| Level of Detail | More detailed financial information | Simplified financial information |
When reading, note that the 10-K report must be filed with the SEC, with strict requirements for content organization and disclosure. The annual report is more flexible, often serving as corporate promotional material with a focus on visual appeal. The table below further illustrates their regulatory differences:
| Feature | 10-K Report | Annual Report |
|---|---|---|
| Purpose | Filed with the SEC for compliance checks | Directed at shareholders, typically a marketing tool |
| Content | Includes detailed financial activities, risks, legal descriptions, etc. | Includes CEO letter, company history, and key activity overviews |
| Design | Lengthy and complex, less consumable for investors | Colorful, professionally presented, easy to read and understand |
| Organizational Requirements | SEC has strict guidelines for information organization and content | More flexible content, designed to attract shareholders |
If you want to deeply analyze a company’s financial condition, prioritize reviewing the 10-K report. The annual report is better suited for quickly understanding corporate culture and development vision.
Differences with 10-Q and 8-K
You will also encounter 10-Q and 8-K filings during the investment process. Like the 10-K report, these are important documents that U.S. public companies must disclose, but their purposes and filing timelines differ. You can refer to the table below:
| File Type | Disclosure Requirements | Filing Timeline |
|---|---|---|
| 10-K | Contains detailed annual financial information and company operations | Filed annually |
| 10-Q | Contains quarterly financial information | Filed for the first, second, and third quarters of each fiscal year |
| 8-K | Reports major events or changes | Filed promptly after the event |
The 10-Q report primarily reflects the company’s quarterly operating condition, with simpler content than the 10-K report. The 8-K report is used to disclose significant events, such as executive changes, mergers, or major litigation. These filings allow you to stay updated on company developments and enhance your investment judgment.
Report Structure

Image Source: unsplash
When reading a 10-K report, you should first understand its structure. The SEC has strict regulations on the content and order of the 10-K report. A standard 10-K report is divided into four main parts, containing fifteen sub-items. You can quickly understand the overall structure through the table below:
| Main Section | Sub-Items and Content Overview |
|---|---|
| Part I | 1. Business 1A. Risk Factors 1B. Unresolved SEC Comments 1C. Cybersecurity 2. Significant Assets 3. Legal Proceedings 4. Mine Safety |
| Part II | 5. Stock Market Information 6. Selected Financial Data 7. Management’s Discussion and Analysis 7A. Quantitative and Qualitative Market Risk Disclosures 8. Financial Statements 9. Changes in Accountants 9A. Internal Controls 9B. Other Information |
| Part III | 10. Directors and Executives 11. Executive Compensation 12. Related Party Transactions 13. Director Independence 14. Accounting Fees |
| Part IV | 15. Exhibits |
You can see that the 10-K report’s structure is very clear. Each section serves different disclosure needs. Below, I will guide you through the core content and investment value of each section.
Business Section
In the “Business” section, you can find the most fundamental information about the company. This section details the company’s history, core business, market positioning, and competitive environment. You can quickly understand the company’s fundamentals through the following content:
- Company history and current operating condition
- Future plans and major projects
- Main products or services and their markets
- Distribution methods for products or services
- Competitive business conditions and the company’s competitive position
- Major customers and suppliers
- Intellectual property such as patents, trademarks, and licenses
- Impact of government regulations and environmental laws
- Total number of employees and full-time staff
- Subsidiaries and their businesses
Through this information, you can assess the company’s position in its industry and its future development potential. For example, if a tech company discloses significant R&D investment and new product plans in the business section, it indicates a focus on innovation and potential for future growth. You can also evaluate dependency risks by understanding major customers and suppliers.
The business section provides firsthand information on the company’s strategy and market positioning. You can use it to assess the company’s core competitiveness and industry outlook.
MD&A Section
The Management’s Discussion and Analysis (MD&A) is one of the most valuable sections of the 10-K report for investors. Here, you can see management’s in-depth analysis of the company’s financial performance, strategic initiatives, and future goals. The MD&A section typically includes:
- Business Overview: Introduces the company’s overall operations, including key product lines and industry outlook.
- Key Accounting Estimates: Explains significant accounting policies and their impact on financial results.
- Liquidity and Capital Resources: Analyzes changes in the company’s cash flow, financing channels, and capital structure.
- Operating Results: Compares recent financial data with previous years, explaining fluctuations in revenue, costs, and profits.
Through the MD&A section, you can understand management’s perspective on the company’s future. Management explains the reasons behind financial data, discusses industry trends, market risks, and the company’s response strategies. For example, if management mentions the impact of rising raw material prices on costs in the MD&A, you can assess the company’s future profitability.
The MD&A section not only helps you understand the company’s past performance but also provides insight into its future direction. You should prioritize this section in your investment decisions.
Financial Statements
In the 10-K report, you will find complete financial statements. These statements are independently audited and highly authoritative. They include:
- Balance Sheet: Shows the company’s assets, liabilities, and shareholders’ equity at the end of the reporting period.
- Income Statement: Reflects the company’s revenue, costs, and net profit during the reporting period.
- Cash Flow Statement: Reveals the company’s cash inflows and outflows.
Auditors ensure the accuracy of financial statements through the following process:
- Planning Phase: Define audit objectives and key risks, and develop a detailed plan.
- Fieldwork Phase: Collect evidence, review original documents, test account balances, and evaluate internal controls.
- Reporting Phase: Issue an audit opinion confirming whether the financial statements accurately reflect the company’s condition.
You can analyze the company’s profitability, solvency, and cash flow status through the financial statements. For example, the balance sheet helps you assess whether the company has excessive debt, while the cash flow statement reveals its ability to sustain operations.
Other Sub-Items
In addition to the core business, MD&A, and financial statements, the 10-K report includes various supplementary disclosures. These help you gain a comprehensive understanding of the company’s risk management and compliance. Common supplementary disclosures include:
- Risk Factors: Lists key risks and uncertainties that may affect the company’s performance.
- Cybersecurity: Discloses the company’s cybersecurity management and strategies, reflecting its focus on data protection.
- Legal Proceedings: Details significant legal cases involving the company.
- Executive Compensation and Related Party Transactions: Helps you understand the company’s governance structure and potential conflicts of interest.
- Internal Controls and Accounting Policy Changes: Reflects the company’s financial management standards.
Since 2023, the SEC has required companies to specifically disclose cybersecurity-related content in 10-K reports. You can use this information to assess the company’s ability to address emerging risks.
When reading the 10-K report, don’t overlook these supplementary disclosures. They help you identify potential risks and enhance the comprehensiveness of your investment decisions.
Efficient Reading Methods
Quick Navigation
When reading a 10-K report, you may feel overwhelmed by the volume of information. After mastering the structure, you can use the following methods to quickly locate key content:
- Focus on specific sections. Prioritize reviewing the business description, Management’s Discussion and Analysis (MD&A), risk factors, and financial statements.
- Check market and share information. Pay attention to changes in dividend policies and share activities, which typically appear in the early sections.
- Focus on property information. For retail companies, store counts and sales trends reflect expansion or contraction.
- Note changes in accountants and internal controls. Be cautious of auditor disagreements or significant deficiencies, as these may indicate risks.
You can also use tools to improve efficiency:
| Tool | Function Description |
|---|---|
| ChatGPT | Helps analyze reports and provide insights, supporting plugins like PDF readers to extract information. |
| AlphaSense | Subscription-based, analyzes various reports, including SEC filings and financial statements, to identify trends and investment opportunities. |
| Daloopa | Offers free options, allows uploading files to extract detailed information from SEC filings, including annual reports. |
Information Filtering
The 10-K report contains vast amounts of information, so you need to learn to filter the most valuable content. Focus on the following areas:
- Business description and operational summary. This provides qualitative analysis of the company’s goals and market position.
- Risk factors. Pay attention to the main risks listed by the company and assess their priority.
- Legal proceedings. Note whether the company is involved in unusual legal disputes.
- Management’s Discussion and Analysis. This includes detailed explanations of the past year’s business results and risk disclosures.
- Financial data. Use audited financial statements to evaluate the company’s health.
You can start by browsing the table of contents to locate these sections and use tools to save time.
Common Pitfalls
Many investors make common mistakes when interpreting 10-K reports:
- Ignoring important sections. You may focus only on financial statements, overlooking risk factors and management analysis.
- Misinterpreting financial data. You need to review financial statement notes for context.
- Focusing only on the income statement and balance sheet, ignoring the cash flow statement. The cash flow statement reflects the company’s true cash position.
- Overlooking financial statement notes. These contain critical details and explanations to help you fully understand the data.
When reading a 10-K report, only by comprehensively reviewing all sections and combining tools and methods can you make more informed investment judgments.
Key Recommendations
Financial Metrics
When analyzing a 10-K report, financial metrics are core tools for assessing a company’s operating condition. These metrics help you understand the company’s profitability and operational efficiency. The table below shows the financial metrics most predictive of company performance and their impact:
| Financial Metric | Impact Type |
|---|---|
| ROA | Reduces negative sentiment |
| Tobin’s Q | Reduces negative sentiment |
| ROE | Reduces negative sentiment |
| ROIC | Reduces negative sentiment |
You should focus on ROA (Return on Assets), ROE (Return on Equity), and ROIC (Return on Invested Capital). These metrics reflect the company’s ability to generate profits from its resources. Tobin’s Q measures the relationship between the company’s market value and asset value. When investing, prioritize companies with strong performance in these metrics to reduce investment risk.
Risk Factors
In a 10-K report, you will see various risk factors disclosed by the company. These help you identify the main challenges the company faces. The table below summarizes the most common risk categories and their descriptions:
| Risk Factor Category | Description |
|---|---|
| Artificial Intelligence (AI) | Risks related to AI products and cybersecurity |
| Banking System | Banking system stability and liquidity risks |
| COVID / Pandemic | Uncertainties from potential pandemic resurgences |
| Cybersecurity | Growing cybersecurity threats |
| Data Protection Regulations | Risks related to consumer data protection |
| Economic | Economic slowdown and inflation impacts |
| ESG | Reputation and environmental, social, governance risks |
| Financial Reporting | Ongoing risks from past financial issues |
| Reputation Risk | Risks to brand image and stakeholder perceptions |
| War / Conflict | Risks from geopolitical issues |
| Labor | Issues with skills and employee retention |
You can use these risk factors to assess the company’s ability to address external challenges. Before investing, prioritize evaluating the company’s strategies for cybersecurity, economic fluctuations, and ESG issues.
Management Analysis
In the MD&A section, you can see management’s outlook and strategic plans for the future. Management’s forward-looking statements directly impact investor sentiment and stock liquidity. The table below shows related research findings:
| Research Finding | Description |
|---|---|
| Level of Forward-Looking Disclosure | Correlated with improved stock liquidity |
| Investor Sentiment | Transmission mechanism affecting stock liquidity |
By analyzing management’s perspective, you can gauge the company’s future direction. If management actively discloses future plans, it typically boosts investor confidence and promotes active stock trading. When investing, focus on the forward-looking content in the MD&A section, combining it with financial metrics and risk factors for more informed judgments.
Enhancing Investment Judgment
Fundamental Analysis
To enhance your investment judgment, you should master fundamental analysis methods. Fundamental analysis relies on reliable data sources, such as financial statements, industry reports, and economic indicators. The 10-K report provides a comprehensive view of a company’s financial condition. You can systematically analyze a company through the following steps:
- Review public financial statements, including the income statement, balance sheet, and cash flow statement.
- Read the first section of the 10-K report to understand the industry overview and competitive environment.
- Obtain company-specific information from the MD&A section to analyze financial performance and risk assessments.
- Use financial ratios (e.g., ROE, ROA) to evaluate improvements or deteriorations in the company’s financial performance.
By comparing financial data across different years, you can assess whether the company has sustained growth potential. Industry reports and economic indicators can also help you understand the external environment’s impact on the company.
The table below summarizes data sources commonly used in fundamental analysis:
| Data Source | Description |
|---|---|
| Financial Statements | Reflect the company’s operating condition and financial health |
| Regulatory Filings | Provide compliance and risk information |
| Financial News Websites/Platforms | Display real-time market trends and data |
Practical Application
In the actual investment process, you can translate information from the 10-K report into specific decisions. Many investors analyze the balance sheet, income statement, and cash flow statement to understand the company’s assets, liabilities, and cash flow dynamics. In the MD&A section, you can identify management’s plans and challenges, helping you assess the company’s ability to adapt to market changes.
- The business overview helps you understand the company’s products, services, and market position, providing context for financial data.
- The risk factors section helps you identify potential challenges such as economic changes, competition, and legal issues.
- By combining financial ratios and industry trends, you can identify companies with growth potential.
When investing, use the 10-K report as a core reference tool. Systematically analyzing its sections while considering industry and economic environments can significantly enhance your investment judgment and success rate.
When conducting investment analysis, the 10-K report provides the most authoritative corporate financial information. By mastering its structure and efficient reading methods, you can quickly filter key information. It is recommended to use the 10-K report as an essential tool for investment decisions. Continuous learning and practice will steadily improve your financial analysis skills, enabling more informed investment judgments.
FAQ
What is the difference between a 10-K report and a 10-Q report?
You will find that the 10-K report is an annual report with more detailed content. The 10-Q report is a quarterly report with simpler information. You can use the 10-K to understand the company’s full-year operations.
Where can I find a 10-K report?
You can freely access all public companies’ 10-K reports on the SEC’s EDGAR system. Simply enter the company’s name or ticker symbol.
How often is a 10-K report filed?
You can see a company file a 10-K report once a year. Filing deadlines vary by company size, with large companies typically filing within 60 days after the fiscal year ends.
Why should investors read a 10-K report?
By reading a 10-K report, you gain access to the company’s most authoritative financial and operational information. This helps you better assess the company’s risks and growth prospects, enabling informed investment decisions.
What is the most important part of a 10-K report?
You should focus on the business description, Management’s Discussion and Analysis (MD&A), and financial statements. These sections help you quickly understand the company’s fundamentals and future plans.
By mastering 10-K report analysis, you’ve learned to uncover critical financial insights and assess company risks, but high cross-border fees, currency volatility, and complex account setups can hinder swift action on U.S. market opportunities, especially when analyzing MD&A or seizing earnings season signals. Imagine a platform with 0.5% remittance fees, same-day global transfers, and zero-fee limit orders, enabling seamless 10-K-driven investing via one account?
BiyaPay is tailored for financial analysis investors, offering instant fiat-to-digital conversions to act on market signals nimbly. With real-time exchange rate query, monitor USD trends and transfer at optimal moments to cut costs. Covering most regions with instant arrivals, it powers rapid allocations to S&P 500 stocks (like AAPL) or ETFs. Crucially, trade U.S. and Hong Kong markets through a single account, leveraging zero-fee limit orders for ROE or FCF-based strategies.
Whether targeting high-ROA firms or avoiding risky companies, BiyaPay fuels your edge. Sign up now, visit stocks for U.S. prospects—quick setup unlocks cost-effective, data-driven investing. Join global investors and thrive in 2025’s earnings season!
*This article is provided for general information purposes and does not constitute legal, tax or other professional advice from BiyaPay or its subsidiaries and its affiliates, and it is not intended as a substitute for obtaining advice from a financial advisor or any other professional.
We make no representations, warranties or warranties, express or implied, as to the accuracy, completeness or timeliness of the contents of this publication.


Contact Us
Company and Team
BiyaPay Products
Customer Services


is a broker-dealer registered with the U.S. Securities and Exchange Commission (SEC) (No.: 802-127417), member of the Financial Industry Regulatory Authority (FINRA) (CRD: 325027), member of the Securities Investor Protection Corporation (SIPC), and regulated by FINRA and SEC.
registered with the US Financial Crimes Enforcement Network (FinCEN), as a Money Services Business (MSB), registration number: 31000218637349, and regulated by FinCEN.
registered as Financial Service Provider (FSP number: FSP1007221) in New Zealand, and is a member of the Financial Dispute Resolution Scheme, a New Zealand independent dispute resolution service provider.