- EasyCard
- Trade
- Help
- Announcement
- Academy
- SWIFT Code
- Iban Number
- Referral
- Customer Service
- Blog
- Creator
Risk Return Rate: Understanding the relationship between risk and return in trading and optimizing decisions


Image Source: pexels
Investors often face the risk-return relationship when trading. Data shows that different assets, despite having the same expected return, bear significantly different risks. For example, the table below illustrates:
| Expected Return | Risk | |
|---|---|---|
| Asset 1 | 10% | 2% |
| Asset 2 | 10% | 5% |
Understanding risk and reward helps effectively manage investment risks. Successful investors focus on managing risk exposure rather than attempting to eliminate risk entirely. Pursuing returns without considering risk is unwise, and scientific decision-making requires balancing both factors.
Key Points
- Understanding the risk-return relationship helps investors make more informed decisions.
- Calculating the risk/reward ratio allows you to evaluate the attractiveness of each trade, ensuring potential returns justify the risks taken.
- Setting stop-loss and take-profit points helps control losses and lock in profits, improving overall trading performance.
- Diversifying investments reduces overall risk and optimizes the risk/reward structure of the portfolio.
- Dynamically adjusting the risk/reward ratio adapts to market changes, ensuring the effectiveness of investment strategies.
Risk-Return Relationship

Image Source: unsplash
Risk Definition
Risk in financial trading has multiple interpretations. Every trader considers risk before making decisions. Risk can refer to potential financial losses from an investment or the uncertainty caused by market volatility. The table below summarizes common risk definitions in the financial domain:
| Definition Type | Description |
|---|---|
| Financial Risk | Encompasses various risks related to financing, including potential financial losses and uncertainty. |
| Downside Risk | Focuses solely on potential financial losses. |
| Modern Portfolio Theory | Defines risk through variance or standard deviation, aiming to manage market and financial risks. |
Risk encompasses a wide range, from the failure probability of a single trade to the possibility of an entire market collapse. In a sense, risk cannot be absolutely defined, but investors must acknowledge its existence.
Return Definition
Return is the profit or loss an investor gains over a specific period. The Rate of Return (RoR) is a key metric for measuring investment performance, typically expressed as a percentage. Investors use RoR to compare the performance of different assets. Returns can come from capital appreciation, interest, dividends, or rent. The calculation formula is as follows:
RoR = (Ending Value - Beginning Value) / Beginning Value × 100
Investors sometimes set a minimum acceptable rate of return to screen investment opportunities. Note that RoR does not account for time value or inflation, so caution is needed when analyzing complex investments.
Trade-Off Principle
The risk-return relationship is inseparable. Research from the U.S. market shows that investors typically need to take on higher risks to achieve higher potential returns. Data from developed and emerging economies confirm this. If investors are unwilling to bear risk, they usually can only achieve the risk-free rate of return. The trade-off principle of risk and return reminds investors that they cannot solely pursue high returns or focus only on low risk. Scientific investment decisions require finding a balance between the two. Risk management plays a central role throughout the investment process, helping investors control losses while pursuing returns.
Risk/Reward Ratio Concept
Definition
The risk/reward ratio is a commonly used tool in trading decisions. It reflects how many units of return an investor can expect for each unit of risk taken. By analyzing the risk-return relationship, investors can more clearly assess the attractiveness of a trade. The risk/reward ratio is typically expressed as “1:2” or “1:3.” A higher ratio indicates that potential returns significantly outweigh potential losses. Traders in the U.S. market widely use the risk/reward ratio as a key criterion for screening investment opportunities.
The risk/reward ratio is not only applicable to stock trading but also widely used in bonds, forex, gold, and other asset classes. Both individual and institutional investors need to evaluate the reasonableness of each trade using the risk/reward ratio.
Calculation Method
Investors use various methods to calculate the risk/reward ratio in practice. The most common calculation methods are as follows:
| Risk/Reward Ratio Formula | Example |
|---|---|
| Risk/Reward Ratio = (Entry Point - Stop-Loss Point) / (Take-Profit Point - Entry Point) | If the entry point is $1800, stop-loss is $1750, and take-profit is $2000, the risk/reward ratio is 1:4. |
| Risk/Reward Ratio = Potential Profit / Potential Loss | If the stop-loss is $100 and the take-profit is $300, the risk/reward ratio is 3:1. |
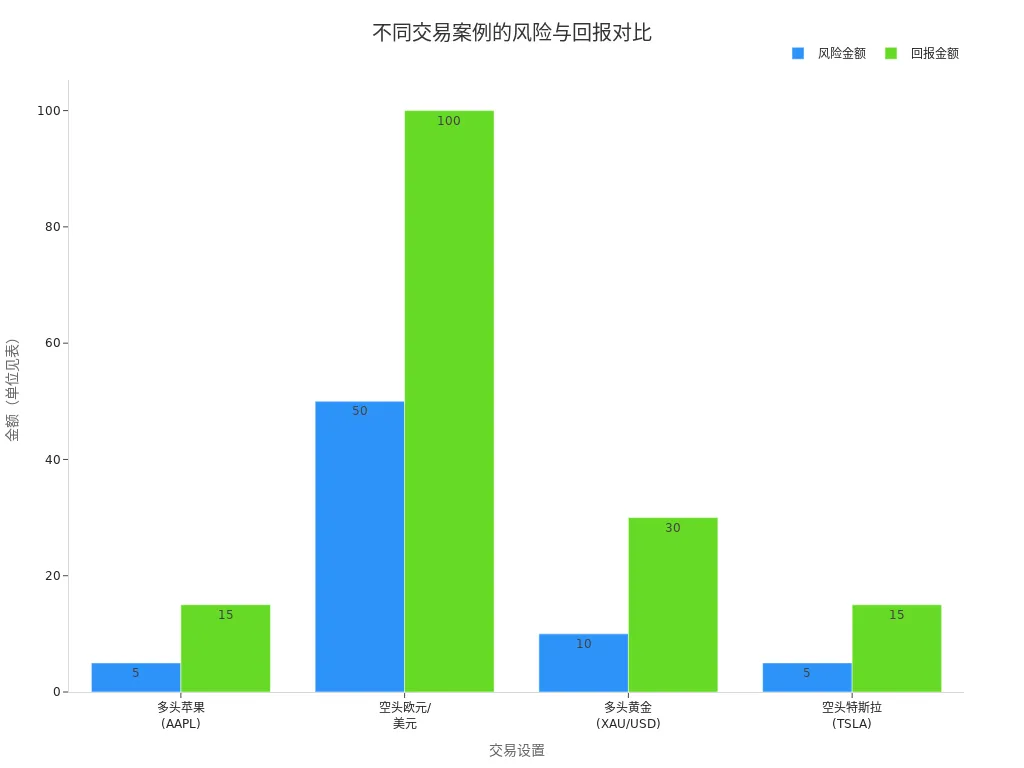
In actual trading, investors adjust the calculation method based on different market conditions and asset classes. The following table shows risk/reward ratio calculations for common trading scenarios in the U.S. market:
| Trading Setup | Entry Price | Stop-Loss | Profit Target | Risk Amount | Reward Amount | Risk/Reward Ratio |
|---|---|---|---|---|---|---|
| Long Apple (AAPL) | $155 | $150 | $170 | $5 | $15 | 1:3 |
| Short EUR/USD | 1.0800 | 1.0850 | 1.0700 | 50 pips | 100 pips | 1:2 |
| Long Gold (XAU/USD) | $2,350 | $2,340 | $2,380 | $10 | $30 | 1:3 |
| Short Tesla (TSLA) | $180 | $185 | $165 | $5 | $15 | 1:3 |
Investors can also use bar charts to visually compare the risk and reward amounts of different trades:
In practice, many investors use professional tools for risk/reward ratio calculations. For example, software like Easy RRR Expert and Take Profit & Stop Loss Calculator Indicator helps investors quickly set stop-loss and take-profit levels and automatically display the risk/reward ratio. These tools are also integrated into trading systems offered by licensed Hong Kong banks, facilitating efficient capital management.
Practical Significance
The risk/reward ratio plays a critical role in trading decisions. It helps investors evaluate potential profits versus losses before entering a trade, avoiding the pitfall of blindly chasing high returns while ignoring risks. Investors can choose an appropriate risk/reward ratio based on their risk tolerance. For example, conservative investors prefer a ratio of 1:3 or higher, moderate investors favor 1:2, while aggressive investors may accept 1:1.5.
| Risk/Reward Ratio | Description |
|---|---|
| Conservative | 1:3 or higher, suitable for low win-rate strategies |
| Moderate | 1:2, suitable for balanced trading approaches |
| Aggressive | 1:1.5, suitable for high-probability setups |
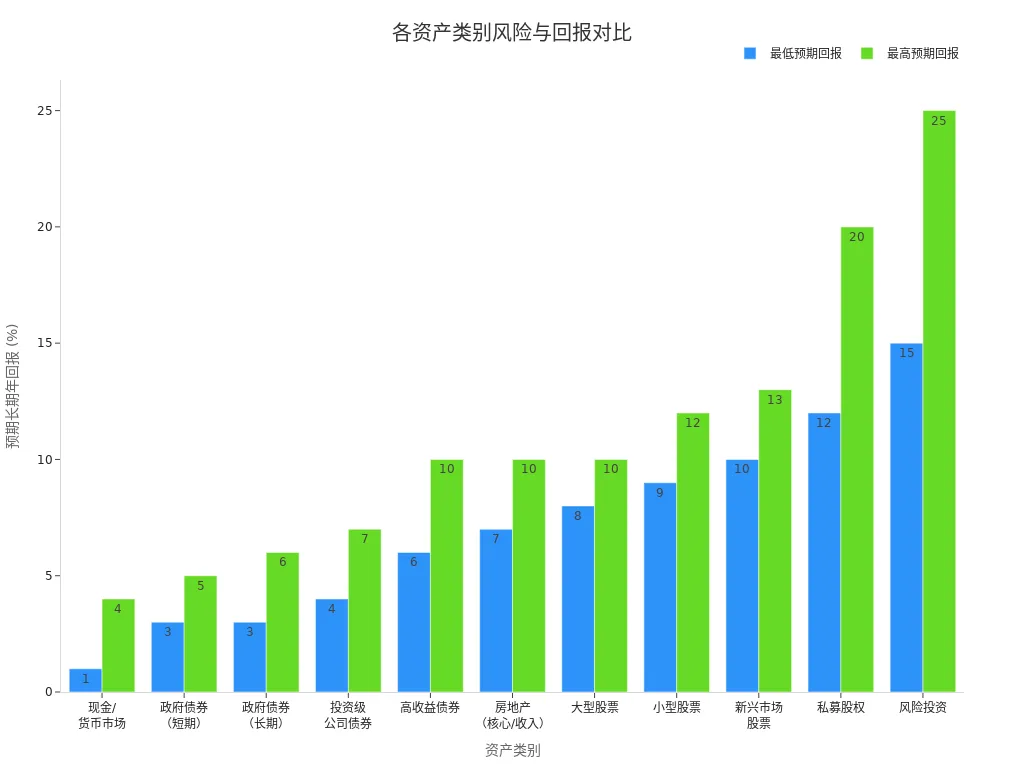
Different asset classes exhibit significant differences in risk/reward ratios. The following table shows the risk levels and expected long-term annual returns for major asset classes in the U.S. market:
| Asset Class | Risk Level | Expected Long-Term Annual Return |
|---|---|---|
| Cash/Money Market | Very Low | 1-4% |
| Government Bonds (Short-Term) | Low | 3-5% |
| Government Bonds (Long-Term) | Low-Medium | 3-6% |
| Investment-Grade Corporate Bonds | Medium | 4-7% |
| High-Yield Bonds | Medium-High | 6-10% |
| Real Estate (Core/Income) | Medium-High | 7-10% |
| Large-Cap Stocks | High | 8-10% |
| Small-Cap Stocks | Very High | 9-12% |
| Emerging Market Stocks | Very High | 10-13% |
| Private Equity | Extremely High | 12-20% |
| Venture Capital | Extremely High | 15-25% |
The risk/reward ratio not only helps investors screen trading opportunities but also guides capital management and stop-loss/take-profit settings. U.S. financial regulators, such as the SEC and FINRA, require investment advisors to thoroughly understand the risk-return relationship when recommending complex products, ensuring decisions align with clients’ best interests.
While the risk/reward ratio is an important reference, it should not be the sole basis for decisions. Market volatility, subjective judgments, and other factors also impact outcomes. Investors should combine multiple analytical methods to scientifically evaluate the risk-return relationship for each trade.
Role in Decision-Making
Evaluating Investment Opportunities
When faced with numerous investment choices, investors often need to assess the merits of each opportunity. The risk/reward ratio provides a straightforward metric for evaluation. By calculating the ratio of potential profits to potential losses, investors can better understand the attractiveness of each investment. For example, professional investors set entry points, stop-loss levels, and take-profit targets, then calculate the risk/reward ratio. A ratio of 1:3 means that for every $1 risked, there is a potential $3 return.
Numerous studies show that risk-reward analysis helps investors make more informed decisions. When evaluating opportunities, investors weigh potential risks against expected returns, combining market trends and personal goals to select the optimal strategy. The following table highlights related research topics:
| Research Topic | Description |
|---|---|
| Predicting Risk/Return Ratio in Financial Markets | This study introduces a new algorithm to predict profit and loss outcomes in trading activities, enhancing algorithmic trading decisions by incorporating market trend predictions. |
Investors also use financial models, such as the Sharpe Ratio, to determine whether expected returns are reasonable. The trade-off principle of risk and return plays a critical role here. Investors will only consider entering the market when expected returns justify the risks taken.
The risk/reward ratio helps investors understand the potential gains versus losses in a specific investment. The quality of an investor’s research determines the expected risk and return parameters. Once risk and return boundaries are set, investors can weigh potential outcomes to decide whether to invest.
Capital Management
Scientific capital management is the foundation of long-term profitability. The risk/reward ratio plays a central role in capital management. Many traders set a maximum loss amount they are willing to risk per trade before entering the market. A common practice is to limit the risk per trade to 1% to 2% of total account equity. For example, with a $10,000 account, a single trade risks no more than $100 to $200.
Best practices for capital management include:
- Setting profit and loss exit points before entering a trade. For example, risking $100 with a target profit of $300 results in a risk/reward ratio of 1:3.
- Many traders seek at least a 1:2 ratio, willing to risk $1 for a potential $2 profit.
- Consistently applying this ratio in trades to balance risk and reward over the long term.
- Setting a percentage of account equity you are willing to risk per trade, typically 1% to 2%.
- Determining the distance between the entry price and stop-loss level to calculate position size that keeps risk within desired limits.
- Adjusting position size based on account equity and market conditions to maintain consistent risk levels.
Different trading strategies have varying risk/reward ratio requirements. The following table summarizes risk/reward ratios for common trading strategies in the U.S. market:
| Trading Strategy | Risk/Reward Ratio Description |
|---|---|
| Swing Trading | Targets at least a 1:2 risk/reward ratio, with potential returns exceeding potential losses. |
| Day Trading | Typically requires a higher risk/reward ratio to address rapid fluctuations. |
| Long-Term Investing | May have a lower risk/reward ratio but achieves returns through the compounding effect over time. |
Many trading systems offered by licensed Hong Kong banks support setting risk/reward ratio parameters, helping investors automatically calculate position sizes and stop-loss amounts to improve capital management efficiency.
Stop-Loss and Take-Profit
Stop-loss and take-profit are essential risk control tools in trading. The risk/reward ratio directly influences the setting of stop-loss and take-profit points. When formulating a trading plan, investors first determine the maximum acceptable loss and desired profit target. By calculating potential profits versus losses, investors can set exit strategies based on their risk tolerance and trading goals.
- The risk/reward ratio is critical in determining appropriate stop-loss and take-profit levels.
- Setting at least a 1:2 risk/reward ratio helps ensure potential returns justify the risks taken.
- Stop-loss levels should be strategically set to limit downside risk, with traders typically risking 1% or 2% of total capital per trade.
- Technical tools like support and resistance levels, moving averages, or Fibonacci retracements can help determine realistic profit targets.
For example, an investor buys gold at USD 1800, sets a stop-loss at USD 1750, and a take-profit at USD 2000. The risk/reward ratio is 1:4, meaning a potential $4 profit for every $1 risked. Consistently applying reasonable stop-loss and take-profit settings helps investors maintain stable returns amid market volatility.
By scientifically setting stop-loss and take-profit points, investors can effectively control losses, lock in profits, and enhance overall trading performance.
Optimization Strategies
Image Source: pexels
Diversification
Diversification is an effective method to improve the risk/reward ratio. By allocating capital across different asset classes, investors can reduce the overall risk from single asset volatility. Modern Portfolio Theory (MPT) emphasizes that investors should focus on the risk of the entire portfolio rather than individual assets. Through diversified allocation, investors can reduce the likelihood of losses while maintaining expected returns. The following table summarizes the positive impacts of diversification from international studies:
| Researcher | Findings |
|---|---|
| Driessen and Laeven (2007) | International diversification benefits, especially for investors in developing countries, improve risk-adjusted returns. |
| Meric et al. (2008) | In bull markets, global diversification outperforms domestic diversification, even when investing in the same industry across different countries. |
| Christoffersen et al. (2014) | Adding emerging markets to developed market portfolios increases diversification benefits. |
| Guidi and Ugur (2014) | Southeast European stock markets offer diversification benefits for international investors, especially for investment horizons under three years. |
| De Santis and Gerard (1997) | From 1970 to 1994, international diversification yielded an expected annual return of 2.11%. |
Investors can optimize the overall risk/reward structure by allocating across stocks, bonds, real estate, and other assets.
Dynamic Adjustment
Market conditions constantly change, requiring investors to dynamically adjust their risk/reward ratios. Many successful traders consider risk management the core of their daily work. They flexibly adjust portfolio structures based on market volatility, economic data, and personal goals.
Successful traders and investors state that they are primarily risk managers, not traders. Managing risk is one of the most important tasks in a trader’s daily life.
The risk/reward ratio helps traders measure potential profits and losses, serving as a tool for evaluating trading opportunities and making strategic decisions.
Investors can use methods like mean-variance optimization or Monte Carlo simulations to periodically evaluate and adjust portfolios, ensuring the risk/reward ratio remains within a reasonable range.
Market Environment
The market environment directly impacts the risk/reward ratio. Investors need to monitor macroeconomic conditions, policy changes, and market sentiment. The Efficient Frontier theory shows that investors can find optimal asset combinations at different risk levels. The following table lists common optimization strategies and their benefits:
| Strategy | Description | Benefits |
|---|---|---|
| Diversification | Spreading investments across different assets | Reduces overall risk |
| Efficient Frontier | Identifies optimal portfolios at specific risk levels | Maximizes returns for a given risk level |
| Capital Asset Pricing Model (CAPM) | Determines expected asset returns based on market volatility and expected market returns | Evaluates the risk-return relationship of assets |
Investors should flexibly apply various optimization tools based on market changes to enhance the risk/reward performance of their portfolios. Professional systems offered by licensed Hong Kong banks also provide technical support for diversification and dynamic adjustments, helping investors navigate complex market environments.
Common Pitfalls
Focusing Only on Returns
Many investors focus solely on potential returns in trading decisions, ignoring risk factors. They are prone to optimistic bias, overestimating success probabilities and underestimating negative outcomes. Some focus only on easily quantifiable metrics, overlooking qualitative factors, leading to incomplete evaluations. Common mistakes include:
- Calculating only expected profits without analyzing potential losses.
- Ignoring trading costs, such as spreads, commissions, and slippage, resulting in actual returns far below theoretical values.
- Entering trades out of fear of missing opportunities without technical confirmation.
The following table illustrates the consequences of focusing only on returns:
| Evidence Type | Content |
|---|---|
| Research Paper | Impact of Risk-Taking Behavior on Profitability: Evidence from Futures Markets. The study shows that excessive trading can lead to greater losses for unprofitable traders. |
| Research Paper | Studies find that traders tend to reduce risk-taking when facing losses but not when profitable. This suggests that ignoring risk can lead to larger losses for unprofitable traders. |
| Blog Post | Risk management is critical in trading, and ignoring risk can lead to significant losses due to market volatility. Effective risk management strategies help traders maximize returns and minimize potential losses. |
Ignoring Risk
Ignoring risk assessment can lead to severe consequences. Experts note that a lack of risk management can hinder business growth and lead to financial losses. If investors fail to consider business risks, they may face legal disputes, theft, fraud, declining sales, and high employee turnover. In actual trading, arbitrarily adjusting stop-loss or profit targets or ignoring correlations between positions can invalidate the intended risk/reward ratio, turning trades into unplanned gambling.
- Ignoring trading costs erodes actual returns.
- Arbitrarily moving stop-loss or profit targets causes the system to fail.
- Failing to consider interactions between positions results in overall risk exceeding that of a single trade.
Experts recommend that investors make risk management the core of trading decisions, regularly assessing potential risks to avoid significant losses due to oversight.
Practical Recommendations
Investors can take several measures to avoid common risk/reward ratio pitfalls:
- Dynamically adjust the risk/reward ratio based on market conditions.
- Evaluate opportunity costs and compare potential returns of different investments to ensure efficient capital use.
- Be mindful of cognitive biases and adopt objective methods, such as backtesting and recording trading activities.
- Avoid arbitrarily changing stop-loss or profit targets to maintain trading strategy consistency.
- Account for trading costs to calculate realistic risk/reward ratios.
- Maintain consistent position sizes across trades to avoid emotional decision-making.
By scientifically managing risk and reward, investors can improve decision quality and achieve stable long-term returns. Professional systems offered by licensed Hong Kong banks also provide risk management tools to help investors better control trading risks.
The risk/reward ratio plays a central role in trading decisions. Professional traders combine win rates with risk/reward ratios to develop robust strategies. For example, a 60% win rate paired with a 1:2 risk/reward ratio typically achieves stable profits. Investors can optimize decisions by adopting the following methods:
- Calculate correlation coefficients for trading assets to adjust position sizes.
- Monitor changes in correlations during market events.
- Balance risk exposure across uncorrelated assets.
- Track comprehensive risk metrics.
Continuously optimizing risk management helps enhance investment performance.
FAQ
What is the Risk/Reward Ratio?
The risk/reward ratio represents the risk an investor must take to achieve expected returns. A higher ratio indicates greater potential returns, making risk management more critical.
How to Calculate the Risk/Reward Ratio?
Investors calculate the risk/reward ratio by dividing potential profits by potential losses. For example, with a stop-loss of USD 100 and a take-profit of USD 300, the risk/reward ratio is 3:1.
What Role Does the Risk/Reward Ratio Play in Trading Decisions?
The risk/reward ratio helps investors assess the attractiveness of each trade. Properly setting the ratio aids in controlling losses and achieving stable long-term returns.
How Do Investors Choose Risk Management Tools?
Many trading systems offered by licensed Hong Kong banks provide risk/reward ratio calculation tools. Investors can select suitable software based on their needs to aid decision-making.
What Are Common Risk/Reward Ratio Pitfalls?
Some investors focus only on returns, ignoring risk assessment. Scientifically managing risk and reward can effectively improve investment performance and reduce losses.
By mastering risk/reward ratio analysis, you’ve learned to optimize trading decisions by balancing potential gains against losses, but high cross-border fees, currency volatility, and complex account setups can limit swift responses to U.S. market opportunities, especially during volatile swings or key economic data releases. Imagine a platform with 0.5% remittance fees, same-day global transfers, and zero-fee limit orders, enabling seamless risk/reward strategies via one account?
BiyaPay is tailored for risk-conscious traders, offering instant fiat-to-digital conversions to act on market signals nimbly. With real-time exchange rate query, monitor USD trends and transfer at optimal moments to cut costs. Covering most regions with instant arrivals, it powers rapid allocations to S&P 500 ETFs (like SPY) or volatile assets like gold. Crucially, trade U.S. and Hong Kong markets through a single account, leveraging zero-fee limit orders for 1:2 or 1:3 risk/reward-based stop-loss and take-profit strategies.
Whether chasing stable returns or mitigating market risks, BiyaPay fuels your edge. Sign up now, visit stocks for U.S. prospects—quick setup unlocks cost-effective, data-driven trading. Join global investors and thrive in 2025’s markets!
*This article is provided for general information purposes and does not constitute legal, tax or other professional advice from BiyaPay or its subsidiaries and its affiliates, and it is not intended as a substitute for obtaining advice from a financial advisor or any other professional.
We make no representations, warranties or warranties, express or implied, as to the accuracy, completeness or timeliness of the contents of this publication.


Contact Us
Company and Team
BiyaPay Products
Customer Services


is a broker-dealer registered with the U.S. Securities and Exchange Commission (SEC) (No.: 802-127417), member of the Financial Industry Regulatory Authority (FINRA) (CRD: 325027), member of the Securities Investor Protection Corporation (SIPC), and regulated by FINRA and SEC.
registered with the US Financial Crimes Enforcement Network (FinCEN), as a Money Services Business (MSB), registration number: 31000218637349, and regulated by FinCEN.
registered as Financial Service Provider (FSP number: FSP1007221) in New Zealand, and is a member of the Financial Dispute Resolution Scheme, a New Zealand independent dispute resolution service provider.