- EasyCard
- Trade
- Help
- Announcement
- Academy
- SWIFT Code
- Iban Number
- Referral
- Customer Service
- Blog
- Creator
Crossing Bull and Bear Markets: In-depth Analysis of Trend Identification and Buying/Selling Points of the BOLL Indicator


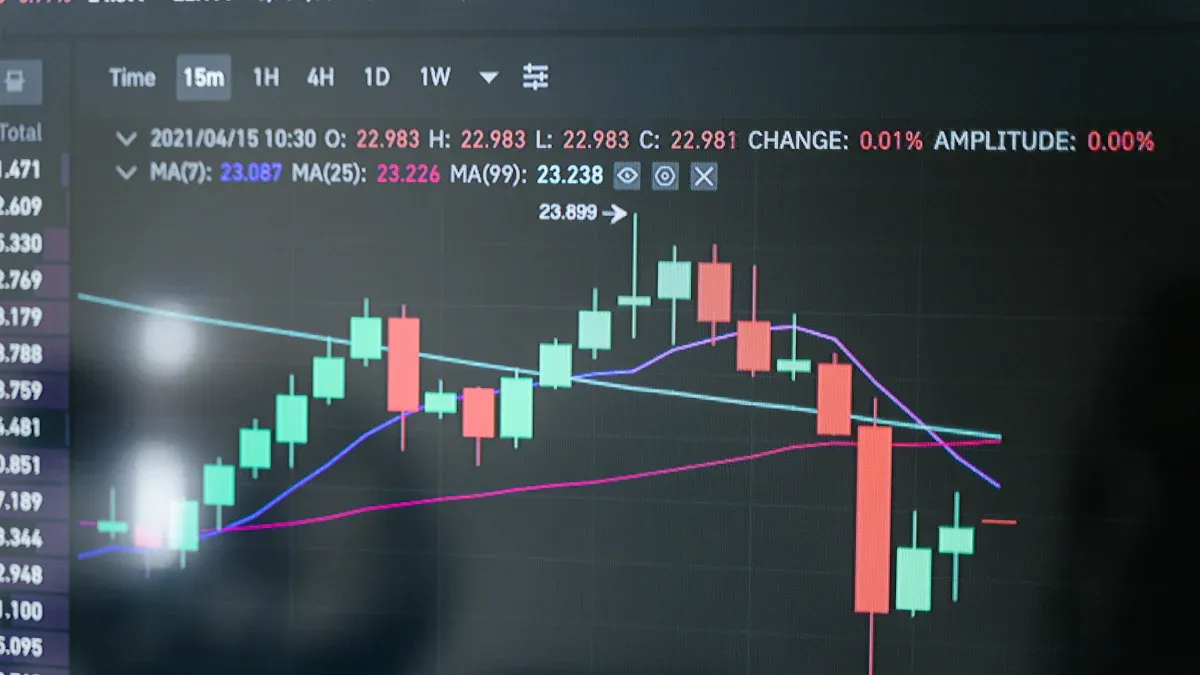
Image Source: pexels
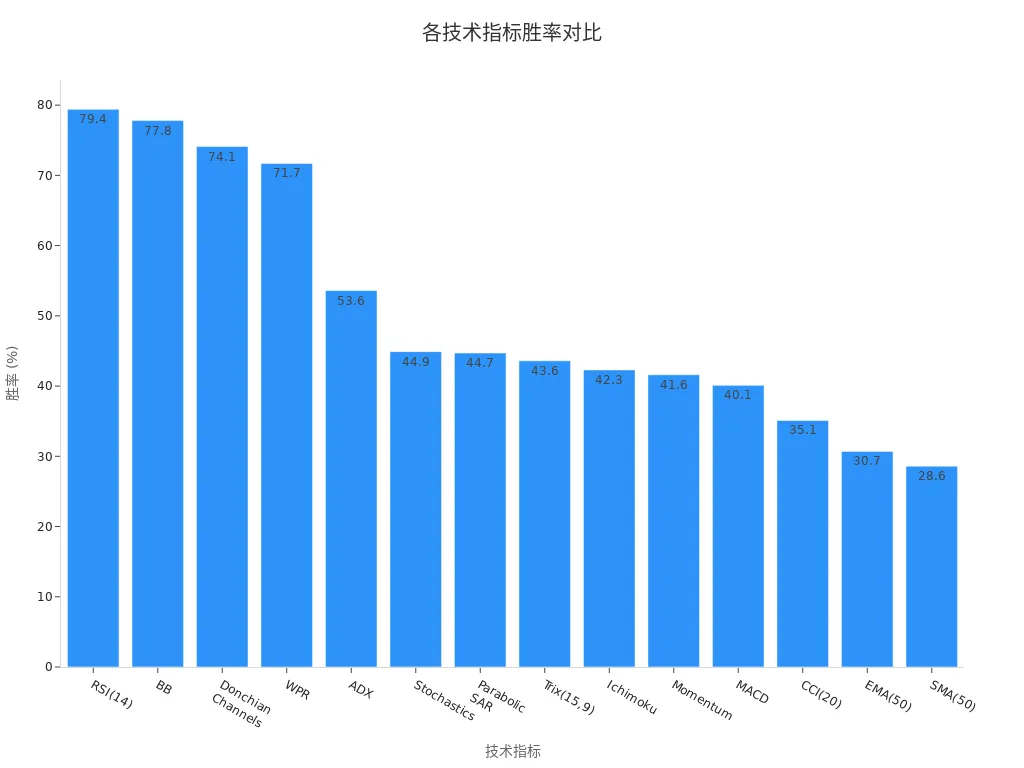
You can achieve higher accuracy and reliability than most technical indicators through trend identification with Bollinger Bands (BOLL). Based on statistical principles, the BOLL indicator uses a three-band structure to dynamically reflect market volatility, helping you seize trends and trading opportunities in a timely manner. In the table below, you will find that BOLL (BB) has a win rate of 77.8%, second only to RSI(14), far surpassing most common indicators.
| Technical Indicator | Win Rate |
|---|---|
| RSI(14) | 79.4% |
| BB | 77.8% |
| Donchian Channels | 74.1% |
| WPR | 71.7% |
| ADX | 53.6% |
| Stochastics | 44.9% |
| Parabolic SAR | 44.7% |
| Trix(15,9) | 43.6% |
| Ichimoku | 42.3% |
| Momentum | 41.6% |
| MACD | 40.1% |
| CCI(20) | 35.1% |
| EMA(50) | 30.7% |
| SMA(50) | 28.6% |
You will enhance your ability to judge market trends and trading opportunities by understanding the principles and structure of Bollinger Bands, avoiding common pitfalls.
Key Takeaways
- The BOLL indicator combines moving averages and volatility to help you identify market trends and trading signals.
- Observing the upper and lower bands can effectively capture overbought and oversold market conditions.
- Utilizing the mean-reversion characteristic of the BOLL middle band, you can find high-probability trading opportunities, improving success rates.
- Combining other technical indicators, such as RSI and MACD, enhances the accuracy of BOLL signals, reducing misjudgments.
- Flexibly adjusting BOLL parameters to suit different market environments improves the rationality of trading decisions.
Introduction to Bollinger Bands
Indicator Origin
You can trace the history of the BOLL indicator back to the early 1980s. John Bollinger developed this indicator to help traders better address market volatility. The BOLL indicator combines technical and fundamental analysis, becoming a key tool in modern trading strategies.
When studying the BOLL indicator, you can refer to John Bollinger’s book 《Bollinger on Bollinger Bands》, which details the theoretical foundation and practical applications of the indicator.
- In the early 1980s, John Bollinger developed the BOLL indicator.
- This indicator combines moving averages and volatility measurements to help you assess price fluctuations and identify potential buy or sell signals.
- The BOLL indicator consists of a moving average line and bands adjusted based on market volatility.
Statistical Foundation
The calculation of the BOLL indicator relies on moving averages and standard deviation from statistics. You can understand its components and calculation methods through the table below:
| Component | Calculation Method |
|---|---|
| Middle Band | 20-day Simple Moving Average (SMA) |
| Upper Band | 20-day SMA + (20-day Standard Deviation x 2) |
| Lower Band | 20-day SMA - (20-day Standard Deviation x 2) |
| Statistical Concept | Moving Average and Standard Deviation |
| Purpose | Assess market volatility, identify overbought or oversold conditions |
By understanding these statistical concepts, you can better grasp the trend identification principles of the BOLL indicator.
Three-Band Structure
The BOLL indicator adopts a three-band structure to dynamically reflect price fluctuations. You will see three lines: the middle band, upper band, and lower band.
- The middle band reflects the average price level.
- The upper and lower bands automatically adjust based on market volatility, enveloping most of the price fluctuation range.
The table below illustrates the mathematical significance of the three-band structure:
| Component | Description |
|---|---|
| Fixed-Width Candlestick Body | The candlestick body width remains constant, making it easy for you to compare price fluctuations across different time frames. |
| Dynamic Blue Block | The blue block’s height changes with market conditions, displaying the high-low price range, helping you identify extreme volatility. |
| Color-Coding System | Green and red candlestick bodies combined with blue volatility blocks help you intuitively sense market sentiment and price direction. |
By observing the three-band structure, you can quickly determine whether the market is in a stable, volatile, or extreme state. This provides a solid foundation for the trend identification of the BOLL indicator.
Trend Identification with Bollinger Bands
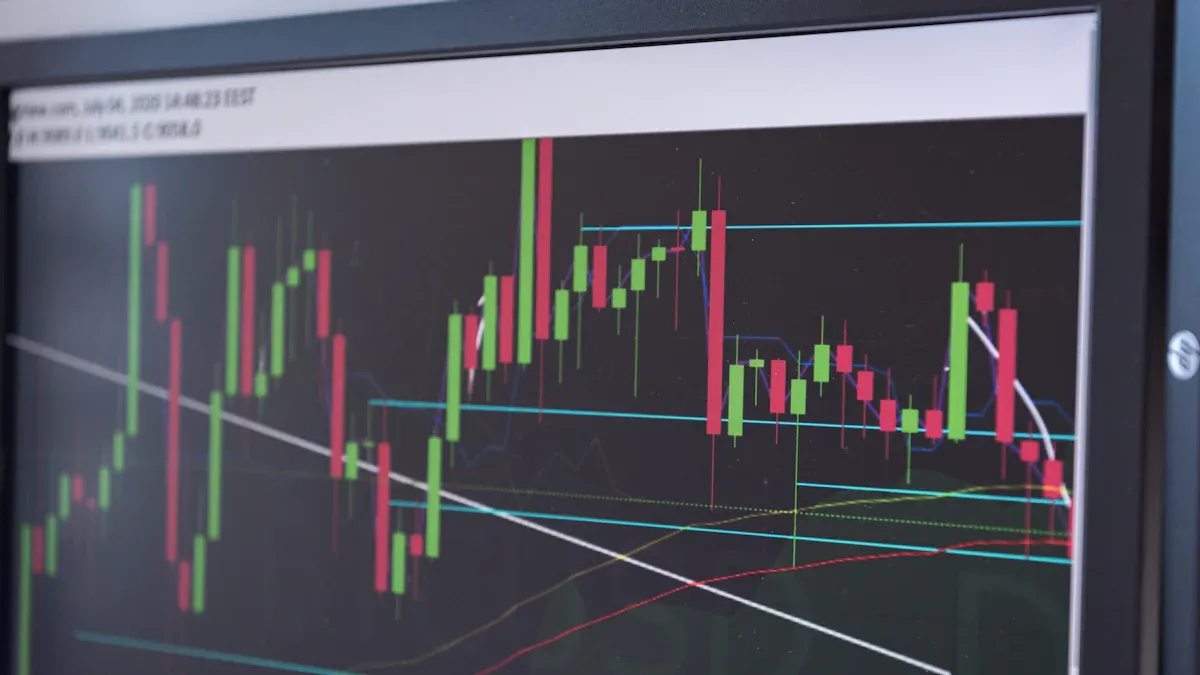
Image Source: pexels
Trend Signals
You can quickly judge the market’s main direction through trend identification with the BOLL indicator. The BOLL indicator uses its three-band structure and standard deviation to dynamically reflect price fluctuations. When you observe prices consistently running along the upper band, it typically indicates a strong upward trend. Conversely, if prices frequently touch the lower band, it suggests a pronounced downward trend.
The trend identification of the BOLL indicator relies on changes in standard deviation. You will find:
- The BOLL indicator uses standard deviation to measure volatility, which helps you assess the strength or weakness of price movements.
- When prices rise, the BOLL band width expands, indicating increased market volatility.
- If prices fall back and touch the middle or lower band, it often signals a potential trend reversal.
You can understand common BOLL trend signals, their historical success rates, and average returns through the table below:
| Signal Type | Success Rate | Average Return |
|---|---|---|
| W-Bottom | 78% | 2.4% |
| M-Top | 76% | 2.1% |
| Walking | 82% | 3.2% |
| Band Touch | 74% | 1.8% |
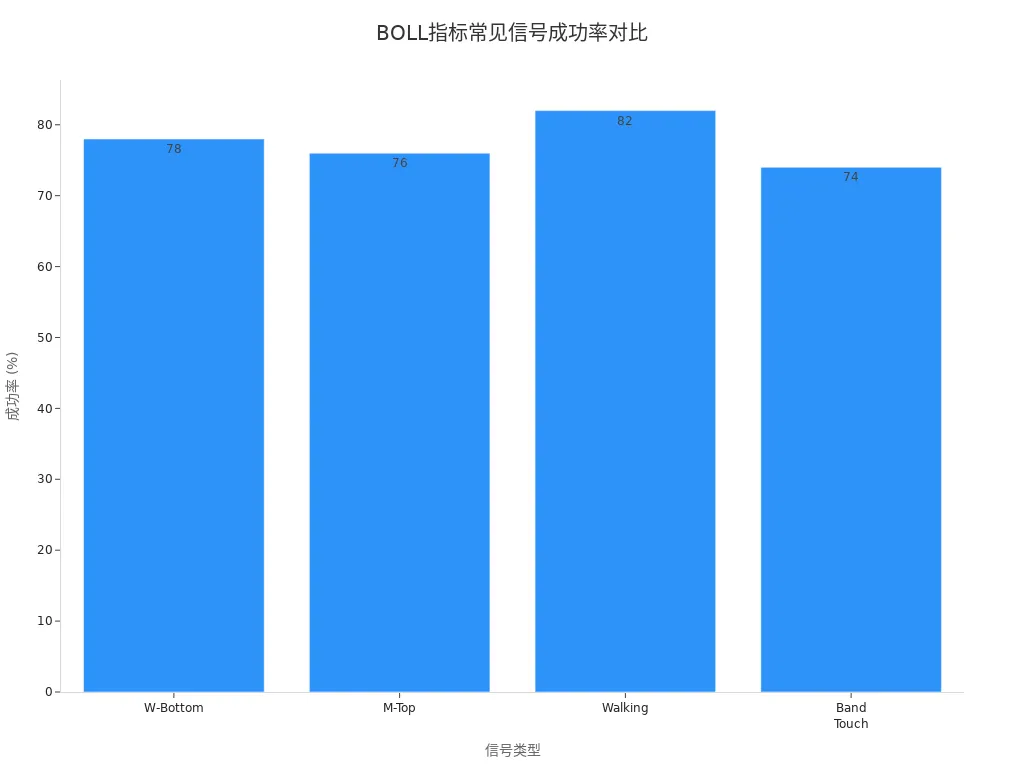
In practice, you can focus on the “Walking” signal. When prices consistently run along the upper or lower band, the trend is often the most evident, with a success rate as high as 82%. Additionally, “W-Bottom” and “M-Top” signals are commonly used to identify trend reversals, helping you seize trading opportunities.
The trend identification of the BOLL indicator is not only applicable to a single market. In different market environments, such as the 4-hour cycle of the EUR/GBP currency pair in U.S. stocks, the “Double Bollinger Bands Strategy” can achieve a 56% win rate. You can flexibly adjust parameters based on different assets and cycles to improve the accuracy of trend judgments.
Market Sentiment
You can gain insight into changes in market sentiment through trend identification with the BOLL indicator. The BOLL three-band structure not only reflects price movements but also reveals the psychological state of market participants. When the band width narrows, the market is in a low-volatility period, with cautious investor sentiment and limited price fluctuations. You will find that this state often foreshadows an upcoming significant movement.
The BOLL indicator can also help you identify extreme changes in market sentiment:
- Bollinger Bands can indicate periods of low and high volatility, which affects their predictive accuracy.
- In strong trends, volatility expands, bands widen, and signals become more reliable.
- Volatility typically reverts to the mean, with low-volatility periods often followed by high-volatility periods; narrow bands signal an impending market breakout.
You can further understand performance under different trend patterns through the table below:
| Pattern Type | Success Rate | Average Return per Trade |
|---|---|---|
| Bullish Walk | 72% | 2.8% |
| Bearish Walk | 65% | 2.3% |
The trend identification of the BOLL indicator offers a unique advantage in market sentiment analysis. You can use band width changes to determine whether the market is in a wait-and-see, panic, or greed phase. When you notice a sudden expansion in band width, it often indicates a sharp change in market sentiment, making trend signals more evident. You can combine other indicators to further improve judgment accuracy.
The trend identification of the BOLL indicator provides you with an intuitive, dynamic tool for assessing market trends and sentiment. By observing the three-band structure and band width changes, you can stay in tune with market dynamics, enhancing the rationality and success rate of trading decisions.
Trading Strategies
Upper and Lower Band Signals
You can capture key trading signals by observing the upper and lower bands of the BOLL indicator. The BOLL three-band structure provides an intuitive range of price fluctuations. When prices approach or break through the upper band, the market is typically in an overbought state, potentially facing a short-term pullback. Conversely, when prices touch or fall below the lower band, the market is often oversold, likely to see a rebound. You can use these signals to develop more rational buy and sell strategies.
In practice, you can focus on the following aspects:
- Volatility: The width between the upper and lower bands reflects the asset’s volatility. Narrow bands indicate low volatility, while wider bands signal increased volatility.
- Potential Reversal: When prices touch the upper band, it often signals overbought conditions, potentially leading to a downward correction; when prices touch the lower band, it indicates oversold conditions, potentially leading to a rebound.
- Trading Signals: Prices touching the lower band are often seen as buy signals; prices touching the upper band are often seen as sell signals.
- Trend Identification: Prices consistently above the middle band (SMA) indicate a clear upward trend; prices consistently below the middle band suggest a dominant downward trend.
You can combine trend identification with the BOLL indicator to assess signal reliability. For example, in the U.S. stock market, many traders combine volume changes with price breakouts above the upper band to determine whether it’s a false breakout. You can improve signal accuracy through historical backtesting.
Mean Reversion
The middle band of the BOLL indicator is a simple moving average (SMA), providing a reference for price mean reversion. You will find that after significant deviations from the middle band, prices tend to revert to it. This characteristic offers high-probability trading opportunities.
- The middle band provides a target level for price mean reversion.
- When prices deviate significantly from the middle band, the market faces reversion pressure, likely leading to a reversal.
- In suitable market conditions, using a mean-reversion strategy to identify potential price reversals can achieve up to 90% accuracy.
You can monitor the process of prices reverting to the middle band after significant breakouts above the upper band or below the lower band. For example, if a U.S. stock rapidly rises beyond the upper band and then falls back to near the middle band, you can consider taking profits at the high or waiting for the pullback to end before entering a position. This approach allows you to effectively seize trading opportunities from mean reversion.
Indicator Synergy
You can further enhance the effectiveness of trading strategies by combining the BOLL indicator with other technical indicators. Relying solely on BOLL signals may lead to false breakouts or lagging signals. You can incorporate indicators like RSI, MACD, or stochastic oscillators for multi-dimensional validation.
- Combining other technical indicators can enhance the effectiveness of BOLL signals.
- Commonly used supplementary indicators include Relative Strength Index (RSI), Moving Average Convergence Divergence (MACD), and stochastic oscillators.
- These indicators can help you confirm trading signals generated by BOLL, reducing false signals and improving overall success rates.
- For example, when prices touch the upper band and RSI simultaneously indicates overbought conditions, the sell signal is more reliable; when prices rebound from the lower band and MACD shows a bullish crossover, the buy signal is more convincing.
You can understand the practical application of combining indicators with BOLL through the table below:
| Scenario | BOLL Signal | Supplementary Indicator | Trading Decision |
|---|---|---|---|
| Price touches upper band | Sell signal | RSI overbought | Sell or wait |
| Price touches lower band | Buy signal | MACD bullish crossover | Buy or add position |
| Price reverts to middle band | Wait/profit-taking signal | Stochastic oscillator | Wait or partial profit-taking |
By combining multiple indicators, you can significantly improve the trend identification and trading precision of the BOLL indicator. In actual trading, you should flexibly adjust parameters and strategies based on different market environments, continuously optimizing your trading system.
Case Studies
Image Source: pexels
Bull Market Case
In a bull market, you often see prices consistently running along the BOLL upper band. Take a U.S. tech stock as an example: after breaking through the upper band, the band width significantly widens, indicating increased market volatility. You can capitalize on this “band-walking” phenomenon to hold positions with the trend. When prices repeatedly pull back to the middle band but do not break below it, it indicates strong bullish momentum. You can reduce overly sensitive signals by adjusting BOLL parameters, such as extending the period or increasing the standard deviation multiplier, avoiding frequent trading. This approach helps you better capture medium- to long-term trends, improving overall win rates and average returns.
Bear Market Case
In a bear market, prices often move downward along the BOLL lower band. You can observe that prices rebound to near the middle band before falling again, forming a persistent downward channel. At this point, the lower band of the BOLL indicator provides a key support reference. By shortening the BOLL period, you can make the indicator more sensitive to price changes, allowing you to capture rebound opportunities in a timely manner. For medium- to long-term investors, adjusting parameters appropriately helps filter out false reversal signals, avoiding frequent stop-losses in a weak market.
Range-Bound Market Case
In a range-bound market, you will find that the BOLL band width gradually narrows, with prices fluctuating between the upper and lower bands. The BOLL’s 20-period simple moving average serves as the centerline, with the upper and lower bands representing standard deviations, helping you identify the expected price range. At this point, the BOLL indicator can effectively identify overbought or oversold conditions, prompting you to consider selling when prices approach the upper band and buying when prices near the lower band. You can use band width changes to judge the likelihood of a market breakout. For strategy developers and mean-reversion traders, optimizing parameter settings can enhance strategy adaptability and backtesting performance across different market environments.
Pitfalls and Avoidance
Signal Misjudgment
When using the BOLL indicator, you may easily encounter signal misjudgments. Many traders focus only on the upper and lower bands, ignoring the middle band, which can lead to misunderstandings of market trends. If you overly rely on Bollinger Bands, your analysis may become cluttered. As a standalone indicator, Bollinger Bands can miss other critical market information. You need to combine tools like MACD and RSI for a more comprehensive market analysis.
In practice, common psychological biases include herd mentality and confirmation bias. You may mimic other investors’ behaviors or seek only information that supports your views. These behaviors can lead you to overlook counter-signals, affecting trading outcomes.
- Ignoring the middle band can lead to trend misjudgments.
- Over-reliance on Bollinger Bands can cause you to miss other market signals.
- Psychological biases, such as recency bias and cognitive illusions, can affect your decisions.
False Breakouts
In the U.S. stock market, you often encounter false breakouts. After prices break through the upper or lower band, they fail to sustain the movement and quickly revert to the range. This situation can lead you to misjudge trends, resulting in losses. You can control risks by using trailing stops, minimizing losses to the greatest extent.
When Bollinger Bands converge, combining MACD or RSI to confirm trend signals can improve the accuracy of buy signals. Extensive parameter backtesting helps optimize strategies, making your trading more robust.
- Trailing stops can help you address false breakouts.
- Combining multiple indicators can enhance signal accuracy.
- Backtesting parameters can reduce erroneous trades.
Parameter Adjustment
When using the BOLL indicator, parameter settings are critical. Different periods and band widths affect signal sensitivity and coverage. You can refer to the table below to choose parameter settings suitable for you:
| Parameter Setting | Recommended Ratio | Description |
|---|---|---|
| 10-Period | 1.9 | For a 10-period setting, reduce the band width from 2.0 to 1.9 to maintain 88-89% coverage. |
| 21-Period (Classic) | 2.0 | Classic setting, suitable for most markets. |
| 50-Period | 2.1 | For a 50-period setting, increase the band width to 2.1. |
You need to flexibly adjust parameters based on market volatility. Failing to adjust the standard deviation in time can lead to trend misjudgments. By backtesting different parameters, you can find the settings most suitable for the current market environment. This approach helps reduce signal misjudgments and improve trading success rates.
You can clearly identify market trends and key trading points through the BOLL indicator. BOLL can dynamically reflect price fluctuations, suitable for different assets and time frames. In practice, you should note the following points:
- BOLL is suitable for various market environments, helping you identify entry and exit opportunities.
- In high-volatility markets, BOLL may generate false signals, so you need to confirm with indicators like RSI.
- You can practice BOLL across different time frames and adjust parameters based on market conditions to enhance judgment.
By flexibly applying the BOLL indicator, combining multiple tools and practical experience, you can effectively improve your investment decision-making.
FAQ
Which markets are suitable for the BOLL indicator?
You can use the BOLL indicator in markets like U.S. stocks, forex, and commodities. BOLL helps you analyze price fluctuations across different assets. When selecting a market, you can adjust parameters based on the asset’s liquidity and volatility.
BOLL performs more stably in high-liquidity markets. You can prioritize U.S. stocks and major currency pairs.
How to choose BOLL parameters?
You can adjust parameters based on trading cycles and market volatility. The common setting is a 20-period with a 2.0 standard deviation multiplier. In high-volatility markets, you can appropriately increase the period or standard deviation. You can find the best parameter combination through historical backtesting.
| Period | Standard Deviation Multiplier | Applicable Scenario |
|---|---|---|
| 20 | 2.0 | U.S. stock daily charts |
| 10 | 1.9 | High-frequency trading |
| 50 | 2.1 | Long-term investing |
Can the BOLL indicator be used alone?
You can use the BOLL indicator alone, but it’s recommended to combine it with other technical indicators like RSI and MACD. This improves signal accuracy. In practice, you can use multi-indicator cross-validation to reduce misjudgment risks.
How to handle false breakouts?
You can set trailing stops to protect capital safety in a timely manner. When prices break through the upper or lower band, you can observe volume and other indicators. If you find the signal unreliable, you can choose to wait or reduce your position.
You can improve strategy stability through backtesting and multi-indicator synergy.
Is the BOLL indicator suitable for beginners?
You can easily get started with the BOLL indicator. Its calculation is simple, and signals are intuitive. During the learning process, you can start with default parameters and practice with historical data. As you gain experience, you can try optimizing parameters and strategies.
By mastering Bollinger Bands, you’ve learned to harness their three-track structure to identify market trends and pinpoint entry/exit points, but high cross-border fees, currency volatility, and complex account setups can limit swift responses to U.S. market signals, especially during band contractions or price breakouts. Imagine a platform with 0.5% remittance fees, same-day global transfers, and zero-fee limit orders, enabling seamless BOLL strategies via one account?
BiyaPay is tailored for technical traders, offering instant fiat-to-digital conversions to act on market signals nimbly. With real-time exchange rate query, monitor USD trends and transfer at optimal moments to cut costs. Covering most regions with instant arrivals, it powers rapid allocations to S&P 500 ETFs (like SPY) or high-volatility tech stocks. Crucially, trade U.S. and Hong Kong markets through a single account, leveraging zero-fee limit orders for BOLL and RSI/MACD-based trading strategies.
Whether capitalizing on trend breakouts or avoiding false signals, BiyaPay fuels your edge. Sign up now, visit stocks for U.S. prospects—quick setup unlocks cost-effective, data-driven trading. Join global investors and thrive in 2025’s markets!
*This article is provided for general information purposes and does not constitute legal, tax or other professional advice from BiyaPay or its subsidiaries and its affiliates, and it is not intended as a substitute for obtaining advice from a financial advisor or any other professional.
We make no representations, warranties or warranties, express or implied, as to the accuracy, completeness or timeliness of the contents of this publication.


Contact Us
Company and Team
BiyaPay Products
Customer Services


is a broker-dealer registered with the U.S. Securities and Exchange Commission (SEC) (No.: 802-127417), member of the Financial Industry Regulatory Authority (FINRA) (CRD: 325027), member of the Securities Investor Protection Corporation (SIPC), and regulated by FINRA and SEC.
registered with the US Financial Crimes Enforcement Network (FinCEN), as a Money Services Business (MSB), registration number: 31000218637349, and regulated by FinCEN.
registered as Financial Service Provider (FSP number: FSP1007221) in New Zealand, and is a member of the Financial Dispute Resolution Scheme, a New Zealand independent dispute resolution service provider.