- EasyCard
- Trade
- Help
- Announcement
- Academy
- SWIFT Code
- Iban Number
- Referral
- Customer Service
- Blog
- Creator
Avoiding Pitfalls in Stock Selection: Practical Interpretation and Investment Applications of the Current Ratio


Image Source: pexels
Are you often worried about picking companies with poor financial conditions? Interpreting the current ratio can help you assess a company’s short-term solvency. Data shows that the current ratio has a positive correlation with stock value, and improved liquidity contributes to enhancing a company’s stock value.
The table below illustrates the relationship between financial ratios and stock value:
Financial Ratio Stock Value Relationship Current Ratio Positively correlated and significant Increased Liquidity Helps enhance stock value
By scientifically analyzing the current ratio, you can more effectively avoid financial pitfalls.
Key Points
- The current ratio is a critical indicator for assessing a company’s short-term solvency. A ratio above 1 generally indicates that the company has sufficient current assets to cover short-term liabilities.
- Analyzing the trend of changes in the current ratio can help you identify the financial health of a company. A continuously declining ratio may signal potential liquidity issues.
- Comparing a company’s current ratio with the industry average can more accurately assess its relative health within the industry.
- A current ratio that is too low may indicate a risk of bankruptcy, while a ratio that is too high may suggest inefficient asset utilization, impacting profitability.
- Combining the current ratio with other financial metrics, such as the quick ratio and cash flow, provides a more comprehensive financial analysis, reducing investment risks.
Avoiding Pitfalls
Role in Stock Selection
When selecting stocks, you often encounter complex and difficult-to-understand financial data. The current ratio can help you quickly assess a company’s short-term solvency. The current ratio, also known as the current asset ratio, is a tool for measuring a company’s liquidity. You can enhance stock selection safety by using the current ratio in the following ways:
- The current ratio compares a company’s short-term assets to its liabilities, directly reflecting whether the company has sufficient current assets to repay short-term debts.
- You can analyze the current ratio over multiple years to observe the stability and trends in a company’s financial condition.
- Comparing a company’s current ratio with its industry peers can help you understand its relative health within the industry.
The current ratio is not just a number. It tells you whether a company has the ability to handle short-term risks. When screening stocks, prioritizing the current ratio can effectively reduce the likelihood of stepping on financial landmines.
The table below illustrates the practical applications of the current ratio in stock selection:
| Application Scenario | Role Description |
|---|---|
| Annual Ratio Analysis | Identify financial trends and assess stability |
| Industry Comparison | Identify a company’s liquidity advantages or disadvantages within the industry |
| Asset-Liability Structure Assessment | Evaluate a company’s short-term solvency |
Risk Identification
During the investment process, your biggest fear is falling into financial traps. An imbalanced current ratio is often a signal of potential risks. A ratio that is too low suggests that a company may be unable to repay short-term debts in a timely manner, risking a cash flow breakdown. A ratio that is too high may indicate inefficient asset utilization, with idle funds affecting profitability.
For example, a U.S.-listed company in 2022 consistently had a current ratio below 1. If you carefully analyze its financial statements, you would find that its short-term liabilities far exceeded its current assets. As a result, the company faced cash flow constraints during economic fluctuations, leading to a significant stock price drop and heavy losses for investors.
Tip: When you notice an abnormal current ratio during stock selection, be sure to investigate the reasons in depth. Don’t rely solely on a single metric; consider the company’s operating condition and industry characteristics as well.
Risks arising from an imbalanced current ratio include:
- The company is unable to repay short-term debts, facing bankruptcy risk.
- Low efficiency in asset utilization, affecting profitability and growth.
- Weak resilience to industry environmental changes, making the company vulnerable to impacts.
By screening with the current ratio, you can identify these risks in advance and avoid investment pitfalls. The current ratio is a vital tool for avoiding traps in stock selection, but you also need to combine it with other financial metrics to form a comprehensive analytical perspective.
Interpreting the Current Ratio

Image Source: unsplash
Definition
When analyzing a company’s financial condition, you often come across the term “interpreting the current ratio.” The current ratio is an important financial metric used to measure a company’s ability to repay short-term liabilities with short-term assets. You can think of it as a “health checkup” for a company’s short-term solvency.
- The current ratio, often referred to as the working capital ratio, compares a company’s current assets to its current liabilities.
- This metric helps you determine whether a company has the ability to handle short-term financial pressures.
- Interpreting the current ratio is critical in analyzing financial health and liquidity.
A higher current ratio indicates a stronger ability to repay short-term debts, but an excessively high ratio may suggest inefficient asset utilization.
Calculation Method
You can calculate the current ratio using a simple formula. Just divide the total current assets by the total current liabilities. The table below illustrates the components and calculation method of the current ratio:
| Component | Description |
|---|---|
| Current Assets | Investments that can be quickly converted to cash within a year, including cash, accounts receivable, marketable securities, etc. |
| Current Liabilities | Financial obligations typically due within a year, including accounts payable, taxes, wages, etc. |
| Current Ratio Formula | Current Ratio = Current Assets / Current Liabilities |
When analyzing a company’s financial statements, you can find these two data points and plug them into the formula to obtain the current ratio. Interpreting the current ratio involves more than just looking at a number; you also need to consider the company’s actual operating conditions.
Industry Differences
Different industries have varying requirements for a reasonable current ratio range. You cannot use the same standard to evaluate all companies. The table below shows the current ratio ranges and key insights for major industries:
| Industry | Current Ratio Range | Key Insights |
|---|---|---|
| Retail | Lower | Retail companies typically optimize supply chains, hold less inventory, and benefit from favorable supplier credit terms, so a lower current ratio is normal. |
| Manufacturing | Varies significantly | High-value-added manufacturing has higher current ratios, while commodity-based manufacturing has lower ratios; analysis should consider production cycles. |
| Technology | 1 to 1.5 | Tech companies have fewer assets and inventory, so a lower current ratio does not necessarily indicate risk; analysis should consider cash flow and business models. |
When conducting practical analysis, you can refer to the following ranges:
- A current ratio between 1.2 and 2.0 is generally considered financially healthy.
- Below 1.0, a company may face cash flow pressure.
- Above 3.0, there may be idle assets, indicating inefficiency.
Interpreting the current ratio requires considering industry characteristics and the company’s specific situation, not just the surface numbers. By comparing with industry peers, you can more accurately assess a company’s financial health.
Financial Health Analysis

Image Source: pexels
Solvency
When analyzing a company’s financial health, you should first focus on its short-term solvency. Interpreting the current ratio can help you determine whether a company has the ability to repay current liabilities with current assets.
- The current ratio is a key indicator of a company’s ability to repay short-term debts, reflecting its capacity to meet current liabilities with current assets.
- A ratio greater than 1 generally indicates that the company has sufficient assets to cover short-term obligations, while a ratio below 1 may suggest liquidity issues.
- Short-term creditors pay particular attention to the current ratio, as the conversion of inventory and accounts receivable is a primary source of cash for repaying short-term debts.
By observing changes in the current ratio, you can assess whether a company is under financial pressure. For example, a U.S. tech company’s financial reports show a current ratio consistently above 1.5, indicating strong short-term solvency and the ability to handle sudden financial demands. When screening companies, prioritizing those with reasonable current ratios can effectively reduce default risks.
Risk Signals
When analyzing a company’s financial condition, you cannot rely solely on surface numbers. A lower current ratio may indicate potential financial instability, requiring closer scrutiny. This may suggest difficulties in meeting financial obligations and potential default risks.
- A current ratio falling below 1 indicates potential liquidity issues, meaning the company may struggle to meet short-term obligations.
- Monitor trends in the current ratio to detect declining liquidity.
- Compare with industry peers to assess relative liquidity.
By examining annual and quarterly data, you can identify abnormal changes in the current ratio. If you find a company’s current ratio consistently declining or significantly below the industry average, this is a clear risk signal. In the U.S. market, some companies experienced a sharp drop in their current ratio, leading to cash flow breakdowns and plummeting stock prices. When analyzing, be sure to consider the company’s operating condition and industry environment to avoid relying solely on a single metric.
Combining Metrics
When analyzing a company’s financial health, you cannot rely solely on interpreting the current ratio. Combining it with other financial metrics provides a more comprehensive perspective.
- Combining the current ratio with other financial metrics provides a more comprehensive view of a company’s liquidity and operational efficiency.
- Relying solely on the current ratio may not be conservative enough; the quick ratio offers a more cautious perspective by excluding inventory.
- Factors like cash flow and accounts receivable turnover provide additional insights to assess liquidity.
- Comparative analysis with industry standards provides broader context, ensuring accurate financial assessments.
You can combine the current ratio with metrics like the quick ratio, cash flow, and accounts receivable turnover for analysis. For example, a U.S. manufacturing company may have a high current ratio but a low quick ratio, indicating a high proportion of inventory and potentially insufficient actual liquidity. By comparing multiple metrics, you can more accurately assess a company’s financial health and enhance stock selection safety.
Trends and Monitoring
Change Trends
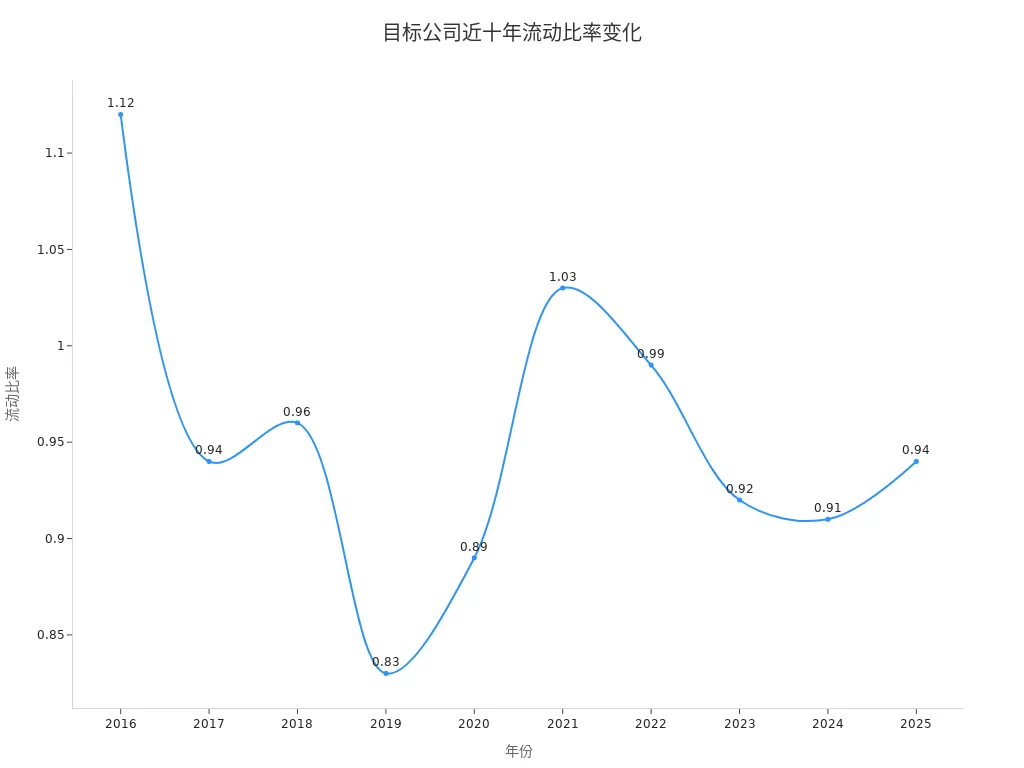
When analyzing a company’s finances, you cannot focus only on the current ratio for a single year. You need to track the trend of changes in the current ratio. By monitoring it over several years, you can determine whether a company’s liquidity is stable. For example, a U.S.-listed company’s current ratio has been declining over the past five years, which may indicate weakening short-term solvency. You can use the table below to review the changes in the target company’s current ratio in recent years:
| Year | Current Ratio |
|---|---|
| 2025 | 0.94 |
| 2024 | 0.91 |
| 2023 | 0.92 |
| 2022 | 0.99 |
| 2021 | 1.03 |
| 2020 | 0.89 |
| 2019 | 0.83 |
| 2018 | 0.96 |
| 2017 | 0.94 |
| 2016 | 1.12 |
Dynamic Analysis
By dynamically analyzing the current ratio, you can identify signs of financial instability earlier. Dynamic analysis focuses not only on a single data point but also on how the ratio changes over time. This allows you to:
- Understand the temporal changes in a company’s liquidity condition.
- Track trends in the current ratio to identify potential liquidity issues in a timely manner.
- Recognize that when the current ratio is above 1.0, the company can cover short-term debts; if it continues to decline, be cautious of deteriorating financial health.
- Enhance the accuracy of current ratio interpretation by considering seasonal fluctuations or industry benchmarks.
You can refer to the line chart below to visually understand the dynamic changes in the target company’s current ratio from 2016 to 2025:
Industry Comparison
When analyzing a company, you should also compare its current ratio with the industry average. This helps you assess the company’s liquidity performance within its industry. If the target company’s current ratio is consistently below the industry average, it indicates weaker short-term solvency and higher risks. By combining industry data with the company’s own trends, you can more comprehensively interpret the current ratio and enhance stock selection safety.
Practical Application and Pitfall Avoidance
Data Acquisition
When analyzing the current ratio of listed companies, you need to find authoritative and accurate data sources. You can obtain the necessary information through the following channels:
- Company financial statements, including annual and quarterly reports
- U.S. Securities and Exchange Commission (SEC) reports
- Major financial databases
- Investor relations websites
- Public platforms like Bloomberg, Yahoo Finance, and Google Finance
- International financial information services like Reuters, which provide comprehensive and up-to-date data
You can cross-verify data accuracy by combining multiple databases, reducing the risk of errors from a single source.
Common Misconceptions
When interpreting the current ratio, you may fall into some common misconceptions. The table below summarizes the main misunderstandings and their correct interpretations:
| Common Misconception | Correct Interpretation |
|---|---|
| A higher current ratio is always better. | A higher current ratio may indicate inefficient asset utilization. |
| A lower current ratio is always worse. | A lower current ratio may sometimes relate to prepaid expenses or deferred revenue, not necessarily indicating risk. |
| The current ratio is the only measure of liquidity. | You should also analyze other metrics like the quick ratio. |
| The current ratio can be used to compare companies across different industries. | Different industries have varying current ratio standards, and direct comparisons may be misleading. |
| A strong current ratio guarantees timely debt repayment. | A strong ratio only indicates sufficient short-term assets, not the actual willingness to repay. |
Application Suggestions
In practice, you can follow these steps to improve analysis effectiveness:
- Collect the latest financial data for the target company and calculate the current ratio.
- Compare the company’s historical data to observe trends in the current ratio.
- Compare the target company with the industry average to assess its relative health.
- Combine the current ratio with other metrics like the quick ratio and cash flow for a multidimensional assessment.
- Note that the current ratio only reflects a snapshot in time, and ignoring cash flow dynamics may lead to misjudgments.
- If you notice an abnormal current ratio, investigate the reasons in depth and avoid relying solely on surface numbers.
By applying these practical methods, you can use the current ratio more scientifically, enhance stock selection safety, and reduce the risk of pitfalls.
Case Studies
Risk Case
When selecting stocks, you often encounter companies with abnormal current ratios. A U.S. retail company’s 2021 financial reports showed a current ratio below 1 for three consecutive years. If you analyze carefully, you will find that its short-term liabilities far exceeded its current assets. The company was unable to repay debts in a timely manner during economic changes, leading to a cash flow breakdown. Its stock price plummeted in a short period, resulting in significant losses for investors.
By observing changes in the current ratio, you can identify potential risks in advance. A current ratio consistently below the industry average typically indicates insufficient short-term solvency. During analysis, don’t overlook the warning role of the current ratio.
The table below summarizes the risks that an imbalanced current ratio may bring:
| Risk Type | Impact Description |
|---|---|
| Cash Flow Breakdown | The company is unable to repay short-term debts |
| Credit Rating Downgrade | Increased financing costs |
| Sharp Stock Price Volatility | Significant losses for investors |
Outstanding Companies
When analyzing outstanding companies, you can find that their current ratios remain high and stable over time. A U.S. tech company has maintained a current ratio above 1.5 for the past five years. By examining its financial data, you can identify the following characteristics:
- Liquidity: The company can repay short-term debts on time.
- Safety: The company has lower risks in terms of debt.
- Profitability: The company’s return on resources shows a positive trend, indicating strong profitability.
- Efficiency: The company’s ability to effectively utilize assets.
When screening companies, prioritizing those with stable and reasonable current ratios can enhance investment safety. The current ratio not only reflects a company’s financial health but also demonstrates management’s effective control over assets and liabilities. By comparing the current ratio performance of different companies, you can more scientifically assess their long-term development potential.
When selecting stocks, the current ratio can help you quickly assess a company’s short-term solvency. By calculating the ratio of current assets to current liabilities, you can identify whether a company has financial vulnerabilities. If you rely solely on the current ratio, you may overlook the impact of long-term liabilities and non-cash assets. Combining it with other metrics like the P/E ratio and PEG ratio provides a more comprehensive financial health analysis. You can also compare company data with industry averages to improve judgment accuracy. Regularly tracking changes in the current ratio allows you to identify cash flow risks in a timely manner. In practice, it’s recommended to conduct multidimensional analysis to avoid being misled by a single metric and to establish a scientific stock selection process.
FAQ
What is a healthy current ratio?
You can refer to a current ratio between 1.2 and 2.0. This range typically indicates strong short-term solvency. You should also consider the industry average for judgment.
What is the difference between the current ratio and the quick ratio?
You use the current ratio to measure the ability of all current assets to cover debts. You use the quick ratio to exclude inventory, focusing on highly liquid assets. The quick ratio is more conservative.
What does an excessively high current ratio indicate?
If you see an excessively high current ratio, it may suggest low asset utilization efficiency. Funds are not fully utilized, affecting profitability. You should combine it with other metrics for analysis.
Can I select stocks based solely on the current ratio?
You cannot rely solely on the current ratio. You should also consider other financial metrics like cash flow and profitability. This approach is more comprehensive and reduces risks.
Is the current ratio suitable for comparing all industries?
You cannot use the same standard to compare all industries. Each industry has different reasonable ranges for the current ratio. You need to analyze it in the context of industry characteristics.
By mastering current ratio analysis, you’ve learned to assess short-term solvency and avoid financial pitfalls, but high cross-border fees, currency volatility, and complex account setups can limit swift investments in stable U.S. firms, especially during earnings season or economic fluctuations. Imagine a platform with 0.5% remittance fees, same-day global transfers, and zero-fee limit orders, enabling seamless investment in high-liquidity companies via one account?
BiyaPay is tailored for cautious investors, offering instant fiat-to-digital conversions to act on market signals nimbly. With real-time exchange rate query, monitor USD trends and transfer at optimal moments to cut costs. Covering most regions with instant arrivals, it powers rapid allocations to S&P 500 stocks (like high-current-ratio tech firms) or stable retail stocks. Crucially, trade U.S. and Hong Kong markets through a single account, leveraging zero-fee limit orders for current ratio and cash flow-based strategies.
Whether targeting financially sound firms or avoiding liquidity risks, BiyaPay fuels your edge. Sign up now, visit stocks for U.S. prospects—quick setup unlocks cost-effective, data-driven investing. Join global investors and thrive in 2025’s markets!
*This article is provided for general information purposes and does not constitute legal, tax or other professional advice from BiyaPay or its subsidiaries and its affiliates, and it is not intended as a substitute for obtaining advice from a financial advisor or any other professional.
We make no representations, warranties or warranties, express or implied, as to the accuracy, completeness or timeliness of the contents of this publication.


Contact Us
Company and Team
BiyaPay Products
Customer Services


is a broker-dealer registered with the U.S. Securities and Exchange Commission (SEC) (No.: 802-127417), member of the Financial Industry Regulatory Authority (FINRA) (CRD: 325027), member of the Securities Investor Protection Corporation (SIPC), and regulated by FINRA and SEC.
registered with the US Financial Crimes Enforcement Network (FinCEN), as a Money Services Business (MSB), registration number: 31000218637349, and regulated by FinCEN.
registered as Financial Service Provider (FSP number: FSP1007221) in New Zealand, and is a member of the Financial Dispute Resolution Scheme, a New Zealand independent dispute resolution service provider.