- EasyCard
- Trade
- Help
- Announcement
- Academy
- SWIFT Code
- Iban Number
- Referral
- Customer Service
- Blog
- Creator
Stop Misusing the WR Indicator: How Technical Analysts Actually Time Trades


Image Source: pexels
The WR indicator, known for its sensitivity, has gained widespread attention in short-term trading. Many investors hope to use it to quickly identify market buy and sell points. However, relying solely on this indicator often leads to misjudgments. Professional technical analysts typically combine multiple signals to enhance the scientific basis of their decisions. Investors should understand its applicable scope and limitations to avoid risks caused by misuse.
Key Points
- The WR indicator is sensitive in short-term trading but should not be relied upon alone. Combining multiple technical tools can improve trading success rates.
- Avoid misusing the WR indicator. Overbought or oversold signals do not always indicate a market reversal; attention must be paid to market trends.
- Use moving averages, trading volume, and candlestick patterns to form multi-signal resonance, improving judgment accuracy.
- Regularly review historical signals to optimize trading strategies, ensuring discipline across different market conditions.
- Scientifically set WR indicator parameters to suit individual trading styles, enhancing signal stability and effectiveness.
WR Indicator Misconceptions
Misjudging Overbought and Oversold Zones
Many investors fall into the trap of “sell when overbought, buy when oversold” when using the WR indicator. They believe that when the WR indicator enters extreme zones, it signals an imminent market reversal. In reality, during strong market trends, the WR indicator may remain in overbought or oversold zones for extended periods without significant price pullbacks. Technical analysis literature also notes that technical analysis is not only suitable for intraday trading but can also assist long-term investing. Focusing only on extreme zones can cause investors to miss trend-based opportunities.
Ignoring Trend Influence
The WR indicator is essentially an oscillator-type indicator with limited adaptability to trending markets. In one-sided uptrends or downtrends, WR indicator signals may frequently fail. Many investors overlook the existence of trends, relying solely on the WR indicator to judge buy and sell timing, leading to frequent stop-losses or missing major price surges. Technical analysis is not only applicable to short-term trend analysis but can also serve long-term investment strategies by adjusting timeframes. Investors should incorporate trend analysis to enhance signal effectiveness.
Risks of Relying on a Single Indicator
Trading solely based on the WR indicator carries high risks. The market environment is complex, and a single indicator cannot fully reflect market sentiment or capital flow. Professional technical analysts typically combine moving averages, volume, and candlestick patterns to form multi-signal resonance, improving judgment accuracy. Technical analysis is not only applicable to short-term trading but can also complement fundamental analysis. Investors should avoid “indicator-only” approaches and build a diversified analysis system.
Practical Methods for Technical Traders
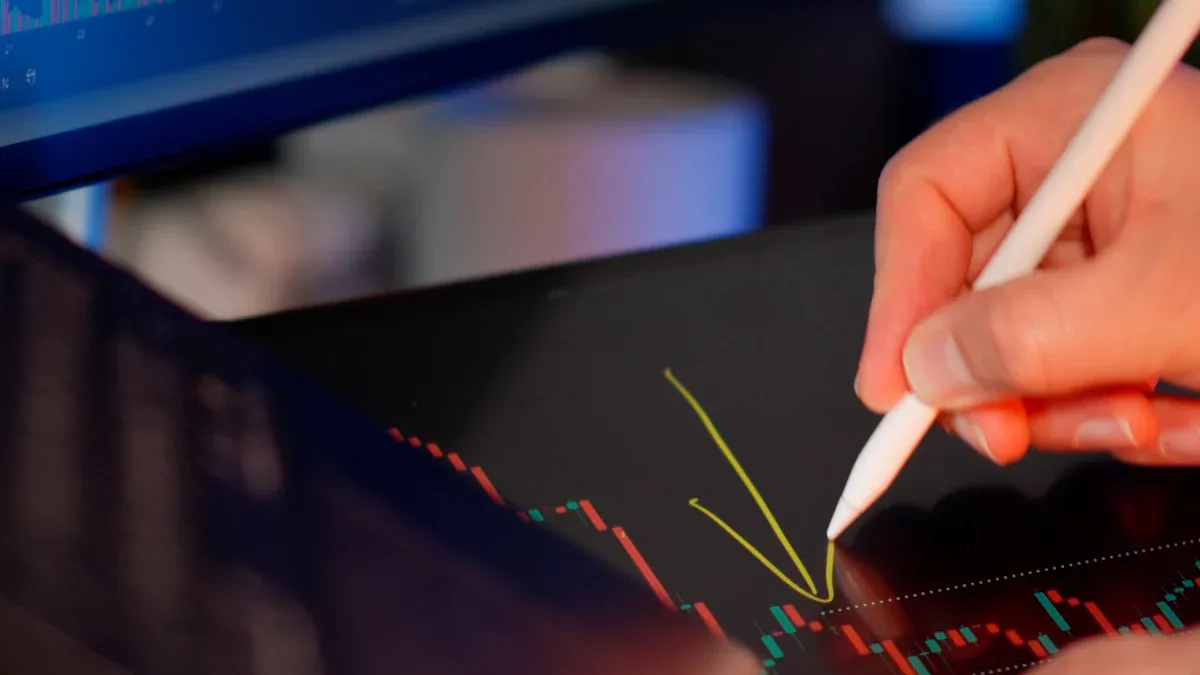
Image Source: unsplash
Combining with Moving Averages
Many technical analysts prefer to use the WR indicator alongside a moving average system. Moving averages reflect the market’s medium- and long-term trends, while the WR indicator excels at capturing short-term fluctuations. In practice, investors often first observe the alignment of moving averages. If moving averages show a bullish alignment, indicating an uptrend, a WR indicator entering the oversold zone often signals the end of a short-term pullback, with the main uptrend likely to continue. Conversely, in a bearish moving average alignment, a WR indicator entering the overbought zone may signal the end of a short-term rebound, with increased downside risk. By combining moving averages with the WR indicator, investors can better balance trends and fluctuations, reducing the likelihood of trading against the trend.
Incorporating Volume
Trading volume is a critical signal of market sentiment and capital flow. Technical traders typically monitor volume changes when analyzing WR indicator signals. When the WR indicator issues a buy or sell signal accompanied by a significant increase in volume, it indicates active market participation, enhancing the signal’s validity. Conversely, if volume is low, even extreme WR values may represent only temporary fluctuations with limited sustainability. By combining volume with the WR indicator, investors can filter out false signals and improve trading success rates.
Using Candlestick Patterns
Candlestick patterns provide rich price action information for technical analysis. Many traders combine the WR indicator with candlestick patterns to identify higher-probability buy and sell opportunities. In practice, investors can:
- Combine with other momentum indicators (e.g., MACD, RSI) for signal confirmation to avoid being misled by a single signal.
- Check volume changes accompanying candlestick patterns; patterns with low volume are often less reliable.
- Focus on whether candlestick patterns appear at key support or resistance zones, as such signals carry greater reference value.
- Strictly adhere to trading rules, avoiding frequent trading based on weak or unclear patterns.
Through these methods, investors can more comprehensively assess market conditions and enhance the practicality of WR indicator signals.
Multi-Indicator Resonance
Multi-indicator resonance is an effective way to improve the accuracy of technical analysis. Technical traders typically do not rely solely on the WR indicator but require multiple technical indicators to issue consistent signals. For example, investors may set a rule: only consider buying when the WR indicator, moving averages, and MACD simultaneously show bullish signals; or selling when all three indicate bearish signals. This approach effectively filters out false signals from a single indicator. A multidimensional analysis perspective helps traders gain a more comprehensive market judgment and make more objective decisions.
Technical traders emphasize that multi-signal resonance not only improves the reliability of buy and sell points but also helps investors build a more scientific trading system, reducing emotional trading.
Practical WR Indicator Tips
Operational Workflow
Professional traders typically follow a scientific workflow when using the WR indicator. First, they select suitable trading instruments and set observation periods. Next, analysts combine moving averages, volume, and candlestick patterns to assess market trends and fluctuations. Then, traders wait for the WR indicator to enter extreme zones and confirm with other technical signals. Finally, they establish clear stop-loss and take-profit strategies to ensure controlled risks.
Technical analysts recommend that traders review historical signals before each trade to evaluate the WR indicator’s performance across different market conditions. This enhances signal reliability and reduces the risk of blindly following signals.
Parameter Settings
The WR indicator’s parameter settings directly affect signal sensitivity and applicability. Market analysts generally recommend the following parameter ranges:
| Source | Parameter Setting | Description |
|---|---|---|
| Admiral Markets | 14-period | Default value; Williams himself suggested 10-period. |
| Titan FX | 14-period | Standard setting; traders can adjust based on style. |
| Alchemy Markets | Adjustable | Adjust lookback period based on market conditions and trading strategy. |
In practice, traders can flexibly adjust parameters based on their trading timeframe and market volatility. For example, short-term traders may choose shorter periods for increased sensitivity, while trend traders may opt for longer periods to filter noise. Parameter adjustments should be backtested with historical data to ensure stable and effective signals.
Case Study
In the U.S. market, a tech stock recently experienced a significant pullback. Analysts first observed the moving average system, noting that medium- and long-term moving averages were in a bullish alignment, indicating an overall uptrend. Subsequently, the WR indicator entered the oversold zone, with trading volume increasing simultaneously. At this point, a hammer candlestick pattern appeared, signaling strengthening buying pressure. Based on the multi-signal resonance principle, traders chose to buy in the WR indicator’s oversold zone, setting a stop-loss at the recent low. Ultimately, the stock price rebounded, and the trader realized a profit.
This case demonstrates that the WR indicator is highly practical in short-term trading but must be combined with trend, volume, and candlestick signals to improve success rates.
Avoiding Traps
Market experts have summarized common traps when using the WR indicator:
- Technical indicators often lag behind current market conditions, potentially generating false signals in volatile markets, leading traders to enter or exit trades at the wrong time.
- Relying solely on major technical indicators may cause traders to overlook the broader market context; it’s important to consider factors like market sentiment, news, and volatility.
- Traders may fall into confirmation bias, using common technical indicators that only reinforce their views, ultimately leading to failed trading plans.
- Ignoring time sensitivity can cause delayed reactions, rendering signals ineffective.
- Reluctance to accept losses may lead to larger financial losses.
- Overallocating funds to a single signal can cause significant financial stress.
- Subscribing to multiple signal providers may lead to confusion and decision-making errors.
- Choosing the wrong trading platform can hinder effective signal execution.
Traders should remain rational, regularly review trading results, and avoid over-reliance on a single indicator. Scientifically using the WR indicator, combined with multidimensional analysis and risk management, enables steady profits in complex market environments.
Enhancing Buy and Sell Timing

Image Source: unsplash
Trading System
Building a scientific trading system enhances the practical value of the WR indicator. Professional traders typically incorporate the following key elements into their system design:
- High Price: Reflects the peak of bullish momentum in the selected period.
- Low Price: Marks the trough of bearish momentum in the selected period.
- Closing Price: Core data for calculating the WR indicator, directly impacting signal judgment.
The trading system should also include clear entry and exit rules, stop-loss and take-profit mechanisms, and risk management plans. This helps traders maintain discipline across different market conditions and reduces emotional interference.
Strategy Optimization
Optimizing trading strategies can significantly enhance the effectiveness of the WR indicator. Traders have summarized the following methods in practice:
- Select appropriate indicators for different market conditions, adapting to trend and volatility changes.
- Recognize that no single indicator guarantees accurate predictions and always prioritize risk management.
- Prioritize using the WR indicator in trending markets, avoiding sole reliance in ranging or consolidating markets.
- Avoid overlaying too many indicators on a single chart to prevent signal confusion.
- Develop clear trading plans to minimize emotional influences on decisions.
Professionals recommend that traders regularly review and optimize strategies, continuously adjusting parameters based on historical data to adapt to market changes.
Combining Technical and Fundamental Analysis
Combining technical analysis with fundamental analysis can improve the accuracy of buy and sell decisions. Traders typically adopt the following methods:
- Technical analysis helps capture market trends, while fundamental analysis reveals the intrinsic value of stocks.
- Use fundamental analysis to screen promising assets, then apply technical indicators (e.g., WR) to determine entry and exit timing.
- Analyze key support and resistance zones through charts to identify buy and sell prices.
| Method | Sharpe Ratio | Total Return | Maximum Drawdown |
|---|---|---|---|
| DQN+coif4 | 0.96 | 112.5% | 0.28 |
| A2C+db1 | 0.803 | N/A | 0.34 |
| PPO+db4 | 0.801 | N/A | 0.34 |
| XGBoost | N/A | N/A | 0.39 |
| Random Forest | N/A | N/A | 0.40 |
| Logistic Regression | N/A | N/A | 0.42 |
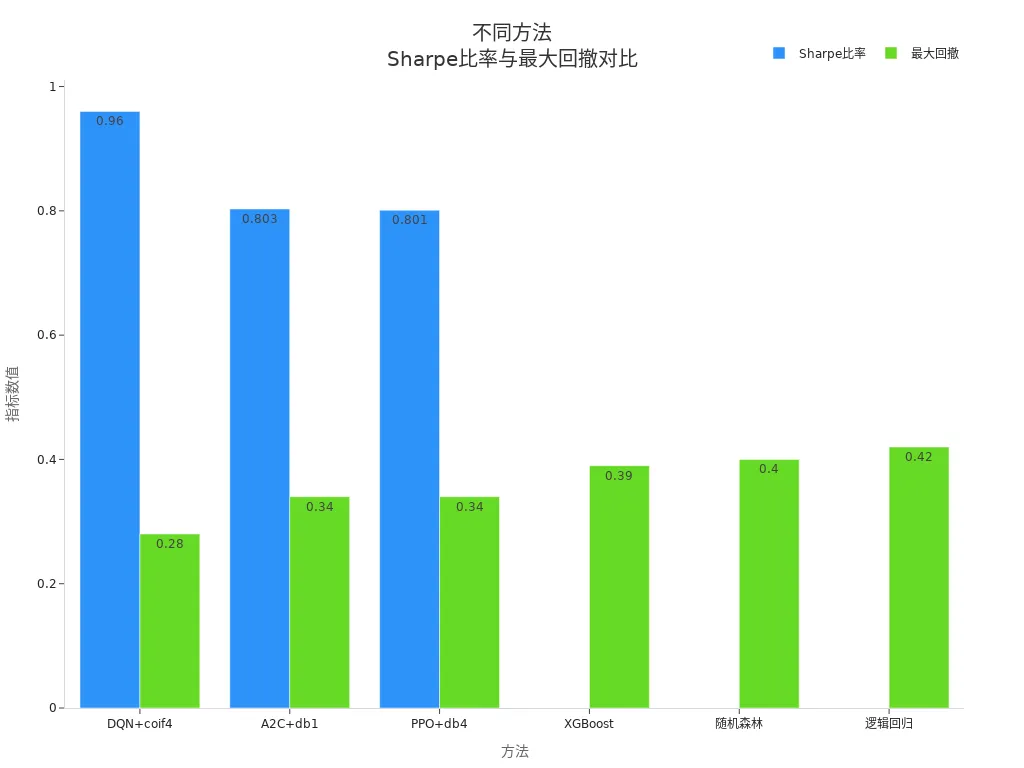
Research shows that combining multiple technical and fundamental indicators helps improve risk-adjusted returns and the stability of trading systems.
The WR indicator has some reference value in actual trading but should not be used alone as a basis for buy and sell decisions. Combining multiple technical tools can effectively improve trading success rates. Data shows that resonance of multiple technical indicators helps filter false signals and improve signal accuracy.
| Evidence Source | Key Points |
|---|---|
| https://www.cryptohopper.com/blog/trading-101-combining-technical-indicators-173 | Combining multiple indicators can boost traders’ confidence. When multiple indicators simultaneously issue the same buy or sell signal, it increases the probability of trading success and filters out false signals. |
| https://topforextrade.medium.com/how-to-combine-trading-indicators-a-guide-to-boost-your-technical-analysis-with-top-fx-and-cfd-3fa0433384cb | One key reason for combining trading indicators is to reduce the likelihood of false signals. Multiple indicators can cross-validate signals, improving signal accuracy. |
Continuous learning and review are equally important. Common effective methods include 1-on-1 personalized coaching, focus on risk-reward trading, structured webinars, and feedback loops.
| Learning Method | Advantages | Disadvantages |
|---|---|---|
| 1-on-1 Personalized Coaching | Offers a tailored learning experience | May be affected by time zone differences |
| Risk-Reward Trading Focus | Emphasizes high risk-reward trading strategies | N/A |
| Structured Webinars and Feedback Loops | Regular feedback promotes learning progress | N/A |
Investors should continuously optimize their trading systems, avoid common pitfalls, and enhance practical capabilities.
FAQ
Which market conditions are suitable for the WR indicator?
Technical analysts believe the WR indicator is more suitable for oscillating or range-bound markets. In trending markets, WR signals may fail. Investors should combine trend analysis to improve signal effectiveness.
How to choose the best parameters for the WR indicator?
Analysts recommend adjusting parameters based on trading timeframes. Short-term trading can use 10-14 periods, with shorter periods for higher volatility. Investors should backtest historical data to find parameters best suited to their strategies.
Can the WR indicator be used alone as a basis for buying and selling?
Professionals do not recommend relying solely on the WR indicator. The market environment is complex, and a single indicator cannot fully reflect market dynamics. Combining moving averages, volume, and candlestick patterns is advised to improve judgment accuracy.
How to combine the WR indicator with MACD, RSI, and other indicators?
Investors can combine the WR indicator with momentum indicators like MACD and RSI. When multiple indicators issue consistent signals, buy and sell timing is more reliable. Multi-indicator resonance helps filter false signals.
How to control risks when using the WR indicator?
Traders should set clear stop-loss and take-profit points. Review historical signals before each trade and use risk management tools. Allocate funds scientifically to avoid significant losses from a single signal.
By mastering the proper use of the WR indicator, you’ve learned to enhance trade timing with moving averages, volume, and candlestick patterns, but high cross-border fees, currency volatility, and complex account setups can limit swift responses to U.S. market short-term opportunities, especially during WR overbought/oversold signals or multi-indicator convergence. Imagine a platform with 0.5% remittance fees, same-day global transfers, and zero-fee limit orders, enabling seamless technical trading via one account?
BiyaPay is tailored for technical traders, offering instant fiat-to-digital conversions to act on market signals nimbly. With real-time exchange rate query, monitor USD trends and transfer at optimal moments to cut costs. Covering most regions with instant arrivals, it powers rapid allocations to S&P 500 ETFs (like SPY) or tech stock scalps. Crucially, trade U.S. and Hong Kong markets through a single account, leveraging zero-fee limit orders for WR and MACD convergence-based strategies.
Whether catching short-term swings or avoiding trendless pitfalls, BiyaPay fuels your edge. Sign up now, visit stocks for technical trading prospects—quick setup unlocks cost-effective, data-driven investing. Join global investors and thrive in 2025’s markets!
*This article is provided for general information purposes and does not constitute legal, tax or other professional advice from BiyaPay or its subsidiaries and its affiliates, and it is not intended as a substitute for obtaining advice from a financial advisor or any other professional.
We make no representations, warranties or warranties, express or implied, as to the accuracy, completeness or timeliness of the contents of this publication.


Contact Us
Company and Team
BiyaPay Products
Customer Services


is a broker-dealer registered with the U.S. Securities and Exchange Commission (SEC) (No.: 802-127417), member of the Financial Industry Regulatory Authority (FINRA) (CRD: 325027), member of the Securities Investor Protection Corporation (SIPC), and regulated by FINRA and SEC.
registered with the US Financial Crimes Enforcement Network (FinCEN), as a Money Services Business (MSB), registration number: 31000218637349, and regulated by FinCEN.
registered as Financial Service Provider (FSP number: FSP1007221) in New Zealand, and is a member of the Financial Dispute Resolution Scheme, a New Zealand independent dispute resolution service provider.