- EasyCard
- Trade
- Help
- Announcement
- Academy
- SWIFT Code
- Iban Number
- Referral
- Customer Service
- Blog
- Creator
Dividend Yield: The Core Metric for Building Stable Cash Flow


Image Source: pexels
Dividend yield plays a central role in cash flow investing. In the long term, dividends significantly contribute to investment returns in major U.S. stock markets. For example:
| Period | Dividend Contribution (%) |
|---|---|
| 1940-2024 | 34 |
| 1957-2025 | 24 |
Investors selecting companies with high dividend yields can often achieve more stable cash flows. These companies typically have the following characteristics:
- Strong cash flow supports consistent dividend payments during economic downturns without relying on borrowing.
- Reasonable payout ratios reduce the risk of leveraging due to declining profits.
Thus, dividend yield not only enhances long-term returns but also strengthens the risk resilience of investment portfolios. How to screen high-quality investments using dividend yield has become a key focus for investors.
Key Takeaways
- Dividend yield is an important metric for assessing a company’s dividend-paying capacity, helping investors gauge annual returns from dividends.
- Selecting companies with high dividend yields can provide more stable cash flows, especially during economic downturns.
- Combining metrics such as payout ratio, ROE, and debt-to-asset ratio allows for a more comprehensive evaluation of a company’s financial health and dividend sustainability.
- Multi-dimensional screening of high-quality dividend stocks, rather than relying solely on dividend yield, effectively mitigates investment risks.
- Dynamically adjusting portfolios and periodically rebalancing asset allocations help enhance long-term returns and risk resilience.
Dividend Yield Overview

Image Source: unsplash
Definition and Calculation
Dividend yield is a key metric for measuring the relationship between a company’s dividend payments and its stock price. Investors typically use it to assess the annual return generated by dividends. The formula is as follows:
| Formula | Description |
|---|---|
| Dividend Yield = Dividend per Share / Market Price per Share | Dividend per share is the company’s total annual dividend divided by the number of outstanding shares |
| Market price per share is the company’s current stock price |
For example, if a company pays an annual dividend of $2 per share and its current stock price is $40, the dividend yield is 5% (2 ÷ 40 = 0.05). Investors can calculate it quickly as follows:
- Dividend Yield = Annual Dividend / Current Stock Price
- Dividend Yield (%) = Dividend per Share ÷ Current Stock Price
This metric provides investors with an intuitive expectation of returns, aiding in comparing the dividend attractiveness of different companies.
Role and Significance
Dividend yield not only reflects a company’s profitability but also its dividend policy and market valuation. Higher dividend yields typically attract investors seeking stable income, but their sustainability requires scrutiny. If a high yield results from a significant stock price decline, it may indicate underlying issues with the company’s fundamentals. The average dividend yield of S&P 500 companies as of October 2024 is 1.25%, lower than the yield of U.S. Treasury bonds during the same period, reflecting high valuations of large-cap companies.
Dividend yield significantly impacts the stability of investment cash flows. High-dividend-yield companies are often seen as safe and stable options, but investors must also consider payout ratios, earnings quality, and balance sheet strength. Relying solely on dividend yield may lead to investing in companies with weak fundamentals, affecting long-term cash flow stability. Therefore, a scientific analysis of dividend yield and the underlying financial conditions helps build a robust investment portfolio.
Linking Key Financial Metrics
Payout Ratio
When evaluating dividend yield, investors often analyze it alongside the payout ratio. The payout ratio shows how much of a company’s profits are distributed as dividends. A reasonable payout ratio helps assess the sustainability of a company’s dividends.
- Dividend yield reflects the return investors receive from dividends, while the payout ratio reveals the intensity of the company’s dividend policy.
- High dividend yields may attract investors, but if the payout ratio is too high (e.g., exceeding 100%), the company may be borrowing future earnings to pay current dividends, which is unsustainable in the long term.
- A company with a payout ratio of 30% has room to maintain dividends even if profits temporarily decline, demonstrating stronger risk resilience.
- The payout ratio is often seen as an early warning system for dividend sustainability. Investors should be cautious of potential dividend risks hidden behind high yields.
ROE and Debt-to-Asset Ratio
ROE (Return on Equity) and the debt-to-asset ratio are also critical metrics for selecting stable dividend-paying companies.
ROE measures a company’s profitability, with higher ROE indicating effective use of capital to generate profits, enhancing the reliability of dividend yields. The debt-to-asset ratio reflects a company’s leverage level. Excessive debt may increase interest expenses and default risks, affecting the company’s ability to maintain dividends.
When screening investments, investors should comprehensively consider dividend yield, payout ratio, ROE, and debt-to-asset ratio. Only through multi-dimensional analysis can investors identify financially healthy companies with sustainable dividends. For example, some U.S. companies with long-term stable dividends often have moderate dividend yields, reasonable payout ratios, and robust balance sheets.
Dividend Yield Screening Methods
Multi-Dimensional Screening
When screening high-quality dividend stocks, investors typically use a multi-factor model. Relying solely on dividend yield may overlook a company’s financial health and growth potential. Multi-dimensional screening combines metrics related to dividends, growth, valuation, and financial stability. Common screening criteria include:
- Payout Ratio: Set a maximum threshold (e.g., 60-75% for non-REIT companies), avoiding excessive dividends that may hinder future growth.
- Debt-to-Equity Ratio: Keep it below 1.0 or compare it to the industry average to ensure manageable debt levels.
- Dividend Growth: Prioritize companies with consistent dividend increases over the past 5-10 years, indicating stable and growing dividend policies.
- Free Cash Flow: Require positive and growing free cash flow to ensure the company’s ability to sustain dividend payments.
- Valuation Ratios: Use P/E, P/B, and P/S ratios to assess whether the stock price is reasonable.
- ROE (Return on Equity): Measures capital efficiency, with higher values indicating stronger profitability.
- Current Ratio: Assesses short-term solvency, with higher values indicating lower risk.
Research suggests investors should focus on value, quality, and defensive characteristics, rather than relying solely on dividend yield. High-dividend stocks sometimes underperform portfolios based on multi-factor strategies. Active investors can avoid dividend traps and enhance portfolio stability through multi-dimensional screening.
The following table summarizes commonly used quantitative screening criteria:
| Metric Type | Metric Name | Description |
|---|---|---|
| Valuation Ratios | Price-to-Earnings (P/E) | Ratio of stock price to earnings per share |
| Price-to-Book (P/B) | Comparison of market value to book value | |
| Price-to-Sales (P/S) | Ratio of stock price to revenue per share | |
| Growth Metrics | Revenue Growth Rate | Annual sales growth |
| Earnings Growth Rate | Profit expansion over time | |
| Dividend Growth Rate | Growth rate of dividend payments | |
| Financial Health Metrics | Debt-to-Equity Ratio | Measure of financial leverage |
| Current Ratio | Assesses short-term solvency | |
| Return on Equity (ROE) | Indicates profit-generating efficiency |
In practice, investors can set thresholds for multiple metrics. For example, screening for stocks with dividend yields in the top 75th percentile over the next 12 months while excluding the bottom 10% in industry quality scores helps identify companies with sustainable dividends and financial stability.
Case studies show that the S&P 500 Dividend Aristocrats Index includes companies that have increased dividends for 25 consecutive years. Such portfolios historically outperform the market average, offering both stable income and capital appreciation potential. Another high-yield portfolio focuses on stocks with yields exceeding 5%. If these companies also exhibit growth potential, investors can achieve substantial cash flows.
Industry and Historical Data
Dividend yield interpretations vary significantly across industries. Some industries, such as banking, beverages, and apparel, have strong dividend traditions and higher yields. Others, like air transportation and automotive, have lower dividend ratios and yields. Investors must consider industry characteristics when screening to avoid misjudging a company’s dividend capacity.
Different industries have varying expectations and norms for dividend payments. In some industries, high dividend yields may indicate financial health; in others, they may reflect a lack of growth opportunities. Investors must analyze dividend yield data in the context of industry backgrounds.
The following table shows dividend yields, payout ratios, and related financial metrics for major U.S. industries:
| Industry Name | Company Count | Total Dividends ($M) | Payout Ratio | Dividend Yield | Market Cap ($M) | ROE | Institutional Ownership |
|---|---|---|---|---|---|---|---|
| Banks (Major) | 15 | 37,379.23 | 31.25% | 2.32% | 1,614,050.90 | 11.52% | 60.10% |
| Banks (Regional) | 591 | 18,022.12 | 55.48% | 2.86% | 629,531.12 | 6.80% | 37.72% |
| Beverages (Soft Drinks) | 29 | 16,992.10 | 68.69% | 2.79% | 609,267.15 | 30.61% | 41.92% |
| Apparel | 37 | 1,270.11 | 62.84% | 1.72% | 73,730.67 | 8.47% | 51.48% |
| Advertising | 54 | 1,068.80 | 83.36% | 1.07% | 99,852.01 | 11.85% | 35.24% |
| Air Transportation | 24 | 755.37 | 14.50% | 0.58% | 129,748.02 | 13.27% | 41.81% |
| Automotive & Trucks | 34 | 1,270.51 | 6.93% | 0.09% | 1,428,661.32 | 9.27% | 23.01% |
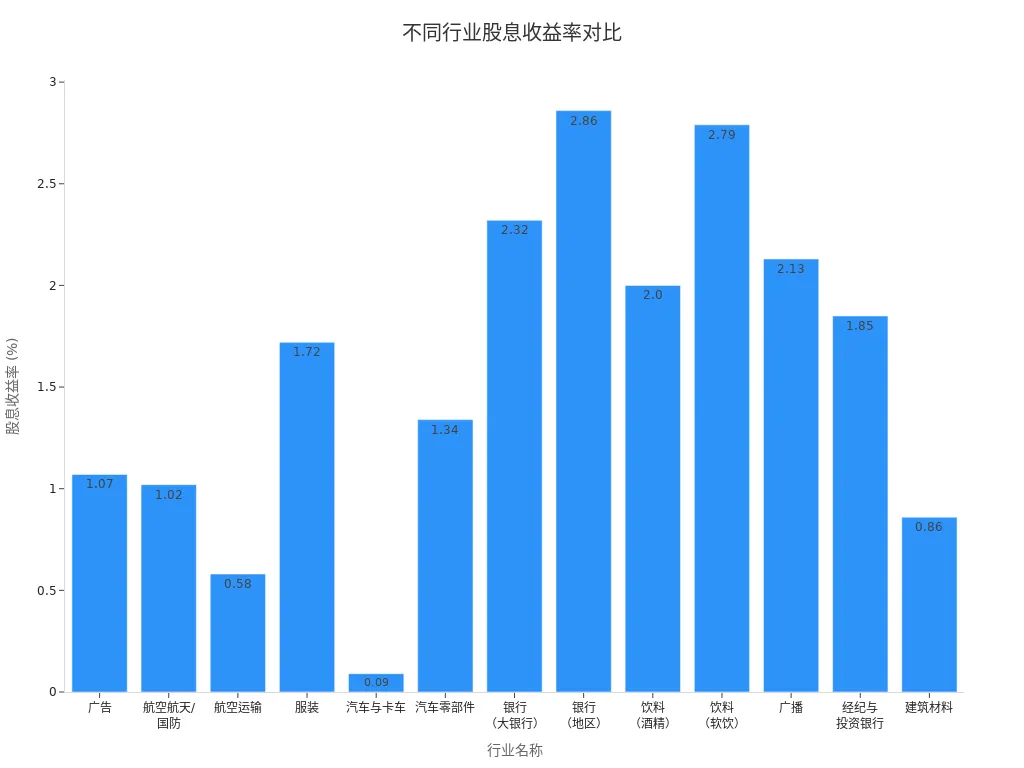
When screening, investors can refer to industry averages. For example, the banking sector typically has higher dividend yields than air transportation. If a bank’s dividend yield significantly exceeds the industry average with a reasonable payout ratio and stable ROE, it indicates strong dividend capacity. For instance, some Hong Kong-licensed banks have consistently increased dividends over the past decade, maintaining payout ratios between 30%-50%, demonstrating robust dividend policies.
Historical data analysis is also crucial. Investors can use regression analysis to identify companies with consistent dividend growth over the past 10 years. Such companies often have long-term dividend-paying capacity, providing stable cash flows. By combining industry characteristics and historical data, investors can effectively select financially healthy, sustainable dividend-paying companies.
Advantages and Risks
Long-Term Returns
Many investors focus on dividend yield because it provides stable long-term cash flows. In the long term, dividends play a significant role in investment returns. Reinvesting dividends generates a compounding effect, often referred to as the “eighth wonder of the world.”
- Dividends provide tangible returns, serving as an important measure of a stock’s attractiveness.
- Long-term holding of high-dividend stocks allows investors to benefit from both consistent cash income and dividend growth.
- In the U.S. market, many companies that consistently pay and increase dividends help investors maintain portfolio resilience during economic downturns.
- Compounding and dividend reinvestment enable investors to achieve returns far exceeding their initial investment over time.
Dividend Traps
High dividend yields, while attractive, also carry risks. Some companies experience deteriorating fundamentals or declining profitability, leading to stock price drops, resulting in artificially high dividend yields, known as “dividend traps.”
- Some companies borrow or deplete capital to maintain high dividends, a practice that is unsustainable.
- Industry cyclicality also affects dividend reliability. Different sectors perform variably across economic cycles, and no investment performs consistently in all cycles.
- Investors focusing only on high yields may overlook a company’s financial health and industry outlook, increasing investment risks.
Investors can mitigate risks through various methods:
- Evaluate a company’s financial stability, selecting firms with strong balance sheets and clear business models.
- Use tools like the Altman Z-Score to assess bankruptcy risk, avoiding companies with low scores.
- Monitor stock price trends, avoiding stocks in sustained decline.
- Choose larger-cap, lower-volatility companies to reduce the risk of dividend cuts.
Only through multi-dimensional analysis can investors truly leverage dividend yield to build a stable cash flow portfolio.
Portfolio Construction

Image Source: pexels
Asset Allocation
When building a dividend-yield-focused portfolio, investors typically allocate assets based on their risk tolerance and cash flow needs. In the U.S. market, investors can choose aggressive, moderate, or conservative dividend portfolios. Each type varies in industry distribution and expected yield. The table below illustrates asset allocation for three typical portfolios:
| Portfolio Type | Asset Allocation | Expected Yield | Focus |
|---|---|---|---|
| Aggressive Dividend Portfolio | 30% Tech, 25% Healthcare, 20% Financials, 15% Consumer Goods, 10% Energy | 2.5% – 3.5% | Dividend growth and capital appreciation |
| Moderate Dividend Portfolio | 30% Consumer Goods, 25% Healthcare, 20% Utilities, 15% Financials, 10% Tech | 3% – 4% | Balance of income and growth |
| Conservative Dividend Portfolio | 35% Utilities, 30% Consumer Goods, 20% Healthcare, 15% Financials | 3.5% – 4.5% | Stable income and capital preservation |
By diversifying across industries, investors can reduce the impact of single-industry volatility on cash flows. Conservative portfolios prioritize stable income, while moderate and aggressive portfolios balance growth potential. Proper asset allocation helps achieve long-term stable cash flow goals.
Dynamic Adjustment
Portfolios require dynamic adjustments based on market changes and company fundamentals. Best practices in the U.S. market suggest investors focus on the following:
- Monitor payout ratios and dividend coverage ratios to assess a company’s ability to pay dividends.
- Diversify across industries to reduce investment risk.
- Maintain financial discipline, ensuring payout ratios remain below 70% to sustain healthy cash flows.
- Target companies with growing free cash flow and stable earnings.
Investors should also periodically rebalance their portfolios. According to Vanguard’s research, annual rebalancing is the optimal frequency for most investors. The table below summarizes findings on rebalancing frequency:
| Research Source | Conclusion |
|---|---|
| Vanguard | Annual rebalancing is the optimal frequency for most investors, outperforming more frequent (monthly, quarterly) or less frequent (every 2.5 years) methods. |
Dynamic management and periodic rebalancing help investors optimize dividend yield performance and enhance portfolio risk resilience.
Dividend yield holds a central position in cash flow investing. Scientific screening and dynamic management can enhance long-term returns. Research shows that dynamic dividend strategies contribute to positive returns. Investors should focus on the quality of dividend stocks, reinvest dividends periodically, and maintain a long-term perspective. High-dividend stocks typically have lower volatility, aiding risk management. Avoiding a sole focus on high yields and combining fundamental analysis with ongoing portfolio optimization is essential.
| Research Topic | Key Findings |
|---|---|
| Dividend Yield Dynamics and Return Predictions | Studies show that the nonlinear process and mean changes in dividend yields significantly impact long-term investment returns. Through time-varying nonlinear models, investors can achieve positive returns without transaction costs exceeding gains. |
FAQ
What is a reasonable range for dividend yield?
In the U.S. market, the average dividend yield of the S&P 500 is approximately 1.25%. Many investors consider 2% to 4% a reasonable range. Yields above 5% require scrutiny of the company’s fundamentals and dividend sustainability.
Is a higher dividend yield always better?
A high dividend yield is not always better. When a company’s stock price drops significantly, the yield may appear abnormally high. Investors should evaluate the company’s profitability, debt levels, and dividend history.
How can I determine if a company’s dividend is sustainable?
Investors can assess the payout ratio, free cash flow, and profitability. A payout ratio below 70%, positive free cash flow, and consistent earnings suggest a sustainable dividend.
What are the advantages of dividend reinvestment?
Dividend reinvestment generates a compounding effect. By using dividends to purchase additional shares, investors can significantly enhance total returns over time. Many U.S. long-term investors adopt this strategy.
Why do dividend yields vary across industries?
Different industries have distinct profit models and dividend traditions. For example, banks and utilities typically pay higher dividends, while tech companies prioritize reinvestment. Investors should analyze dividend yields in the context of industry characteristics.
By mastering dividend yield analysis, you’ve learned to select quality dividend stocks for robust cash flows, but high cross-border fees, currency volatility, and complex account setups can limit swift responses to U.S. high-dividend opportunities, especially during S&P 500 Dividend Aristocrats or sector leader payout seasons. Imagine a platform with 0.5% remittance fees, same-day global transfers, and zero-fee limit orders, enabling seamless dividend strategies via one account?
BiyaPay is tailored for dividend investors, offering instant fiat-to-digital conversions to act on market signals nimbly. With real-time exchange rate query, monitor USD trends and transfer at optimal moments to cut costs. Covering most regions with instant arrivals, it powers rapid allocations to S&P 500 Dividend Aristocrats ETFs (like SPYD) or high-yield bank stocks. Crucially, trade U.S. and Hong Kong markets through a single account, leveraging zero-fee limit orders for dividend yield and payout ratio-based strategies.
Whether chasing steady income or avoiding dividend traps, BiyaPay fuels your edge. Sign up now, visit stocks for high-dividend prospects—quick setup unlocks cost-effective, data-driven investing. Join global investors and thrive in 2025’s markets!
*This article is provided for general information purposes and does not constitute legal, tax or other professional advice from BiyaPay or its subsidiaries and its affiliates, and it is not intended as a substitute for obtaining advice from a financial advisor or any other professional.
We make no representations, warranties or warranties, express or implied, as to the accuracy, completeness or timeliness of the contents of this publication.


Contact Us
Company and Team
BiyaPay Products
Customer Services


is a broker-dealer registered with the U.S. Securities and Exchange Commission (SEC) (No.: 802-127417), member of the Financial Industry Regulatory Authority (FINRA) (CRD: 325027), member of the Securities Investor Protection Corporation (SIPC), and regulated by FINRA and SEC.
registered with the US Financial Crimes Enforcement Network (FinCEN), as a Money Services Business (MSB), registration number: 31000218637349, and regulated by FinCEN.
registered as Financial Service Provider (FSP number: FSP1007221) in New Zealand, and is a member of the Financial Dispute Resolution Scheme, a New Zealand independent dispute resolution service provider.