- EasyCard
- Trade
- Help
- Announcement
- Academy
- SWIFT Code
- Iban Number
- Referral
- Customer Service
- Blog
- Creator
Unveiling Capitulation Selling: How to Identify Market Bottom Signals?


Image Source: pexels
Investors often focus on whether the market has reached its bottom. Capitulation selling is typically accompanied by surging trading volumes, soaring panic indices, concentrated miner sell-offs, and high volume with limited price declines. Ordinary investors can quickly identify market bottoms through the following indicators:
| Signal | Description |
|---|---|
| VIX | The panic index is elevated, indicating extreme market fear. |
| Realized Volatility | Significantly rises, reflecting market panic and forced liquidations. |
| PCR (OI) | A high proportion of put options in open interest, representing extreme bearish sentiment. |
| PCR (Volume) | A surge in put option trading volume, indicating intensified panic selling. |
| RN Skewness | A sharp increase in demand for out-of-the-money put options, a clear sign of a market bottom. |
| Volatility Risk Premium | Enters negative territory, common in bottom zones as the market is gripped by widespread panic. |
These signals provide investors with intuitive, actionable references to identify potential market reversal points.
Key Takeaways
- Monitor changes in the VIX panic index. High VIX values typically indicate the release of market fear, potentially signaling a market bottom.
- Track the trading volume and open interest ratio of put options. An extremely high put option ratio reflects investors’ extreme pessimism, which may foreshadow a market bottom.
- Use technical indicators such as the 200-day moving average and capitulation selling indicators to identify market bottoms and improve judgment accuracy.
- Maintain a rational mindset and avoid impulsive decisions due to short-term fluctuations. Develop an investment plan and evaluate it regularly to ensure its effectiveness.
- Build positions gradually to reduce risks from market volatility. By spreading out investment timing, investors can respond more flexibly to market changes.
Definition of Capitulation Selling

Image Source: pexels
Basic Concept
Capitulation selling in financial markets refers to the phenomenon where investors, having lost confidence in market recovery, rapidly sell off their assets. This behavior is typically driven by fear, leading to sharp asset price declines in a short period. Compared to ordinary market downturns, capitulation selling carries stronger emotional undertones, with investors no longer analyzing the market rationally but selling collectively due to panic. The table below compares the main differences between capitulation selling and ordinary downturns:
| Source | Definition |
|---|---|
| POEMS | In finance, capitulation refers to giving up and rapidly selling held assets due to a loss of confidence in market recovery. It is characterized by widespread panic or selling driven by fear, leading to a rapid decline in asset value. Extreme market downturns are typically associated with capitulation, viewed as an emotionally driven phenomenon rather than a rational response to facts. |
| Corporate Finance Institute | Capitulation refers to the situation where investors/traders liquidate their existing long stock positions during a prolonged price decline. It can be seen as the moment when investors/traders lose hope in their long positions and accept losses. |
| The Motley Fool | In finance, capitulation refers to a large number of investors unable to tolerate losses after a sharp drop in asset value, thus selling at a loss. This can occur after a stock market crash or during a prolonged bear market. Mass selling leads to further declines in asset prices. |
Capitulation selling often occurs during phases of extreme market pessimism, where investors generally choose to exit at a loss, and market sentiment shifts from hope to despair.
Trigger Conditions
Capitulation selling is typically closely related to the following market conditions:
- Investors engage in panic selling during sustained market declines.
- Asset prices rapidly depreciate, with frequent negative news.
- Technical indicators trigger stop-loss orders or forced liquidations, exacerbating selling.
- Large holders (whales) or institutional investors engage in concentrated selling, triggering a chain reaction.
- Regulatory policy changes or industry developments bring uncertainty.
- The market holds extremely pessimistic expectations for the future performance of assets.
These conditions work together, making market sentiment extremely negative, prompting investors to clear their positions to avoid further losses.
Behavioral Characteristics
Capitulation selling exhibits the following prominent behavioral characteristics:
- Asset prices experience rapid and significant declines, almost in a free-fall state.
- Trading volume surges significantly, indicating a large number of investors exiting the market simultaneously.
- Investor sentiment shifts from hope to despair, with a pervasive atmosphere of fear in the market.
- The panic index (such as the CBOE Volatility Index VIX) spikes dramatically, often marking the bottom zone of the market.
- The trading volume and open interest ratio of put options rise significantly, reflecting extreme pessimism among market participants.
- Market news and sentiment remain persistently negative, with investors generally abandoning previous gains and rushing to cut losses.
Capitulation selling is not only a drastic change in price and trading volume but also an extreme release of market sentiment. At this stage, investors often no longer focus on fundamentals or technicals but are driven by fear to make decisions.
Impact of Capitulation Selling
Price and Trading Volume
During capitulation selling, market prices often experience sharp declines. Trading volume significantly increases at this stage, with many investors choosing to sell assets amid extreme panic. Historical U.S. market data shows that high volume with limited price declines is a key signal of a market bottom. Although prices continue to probe lower, the magnitude of declines gradually narrows, while trading volume remains elevated. This phenomenon indicates that selling pressure in the market is nearing its limit, and seller strength is gradually depleting. Subsequently, prices often consolidate at low levels, awaiting new buying interest. High volume with limited price increases is more common in the early stages of a rebound, indicating gradual sentiment recovery.
Investor Psychology
During the capitulation selling phase, investor psychology undergoes dramatic changes. Behavioral finance studies show that investors often sell hastily due to fear, pushing prices further down. Group psychology effects are evident, with individual rationality overwhelmed by collective irrationality, leading to more people following the selling trend. Common cognitive biases include loss aversion, recency bias, and herd mentality, which drive irrational decisions during market downturns. Market sentiment goes through a cycle from optimism to fear and then to despair. Many investors re-enter the market only after recovery, missing opportunities to position at the bottom.
- Panic selling exacerbates market volatility
- Group psychology leads to irrational decisions
- Loss aversion and herd mentality influence behavior
- Sentiment cycles affect entry and exit timing
Capital Flows
During capitulation selling, capital flows undergo significant changes. Investors sell stocks en masse in extreme distress, with funds rapidly flowing to “safe haven” assets like bonds, gold, and cash. On-chain data analysis shows that asset supply distribution and selling metrics frequently spike near major price lows, reflecting large holders exiting under panic or liquidation pressure. The table below summarizes common capital flow characteristics at market bottoms:
| Phase | Capital Flow Characteristics |
|---|---|
| Selling Peak | Significant outflows from stocks, with notable inflows to safe assets |
| Bottom Formation | Forced selling peaks, with temporary market liquidity constraints |
| Early Rebound | Some capital flows back to risk assets, with market sentiment gradually recovering |
Capitulation selling not only alters market prices and trading volumes but also profoundly impacts investor psychology and capital flows. These characteristics are particularly evident at the end of bear markets, providing key references for identifying market bottoms.
Historical Cases
Classic Cases
Historically, multiple extreme market downturns have been accompanied by capitulation selling. During the U.S. market’s dot-com bubble, the 2008 financial crisis, and the 2020 COVID-19 pandemic, investors exhibited widespread panic selling, with market prices plummeting sharply in a short time. The table below summarizes these typical events and their key characteristics:
| Event | Key Characteristics |
|---|---|
| Dotcom Bubble in 2000 | Internet-related stocks soared due to speculative frenzy, followed by mass selling after the bubble burst. |
| Financial Crisis of 2008 | The subprime crisis triggered global banking system turmoil, with panic selling causing sharp stock price declines. |
| COVID-19 Pandemic in 2020 | Global health crises led to severe market volatility, with investors selling assets en masse due to uncertainty. |
These cases show that capitulation selling often occurs during periods of extreme market panic and heightened uncertainty.
Bottom Signals
At market bottoms, common signals include surging miner sell-offs, significant declines in network hashrate, and extreme changes in technical indicators. For example, in December 2018, the network hashrate dropped 42%, followed by a 310% price increase over the next six months. In March 2020, miners sold 18,000 BTC in a single day, and three months later, the market entered a bull run. In June 2022, hashrate plummeted 19% in a single week, with prices recovering all losses within five weeks. In January 2023, miner balances fell to 1.8 million BTC, while institutional accumulation hit record highs. The table below illustrates the relationship between these signals and market reversals:
| Date | Event Description | Outcome |
|---|---|---|
| December 2018 | Network hashrate dropped 42% | Price rose 310% in 6 months |
| March 2020 | Miners sold 18,000 BTC in a single day | Bull market began 3 months later |
| June 2022 | Hashrate fell 19% in a single week | Prices recovered all losses in 5 weeks |
| January 2023 | Miner balances fell to 1.8 million BTC | Institutional accumulation hit record highs |
These signals typically appear during extreme market panic, indicating that capitulation selling is nearing its end.
Reversal Characteristics
Market reversals often occur shortly after capitulation selling. Prices enter a consolidation phase after extreme declines, with trading volume gradually decreasing and panic sentiment slowly dissipating. Technical indicators such as RSI and MACD show divergences, and some capital begins to flow back into risk assets. Historical data shows that markets typically complete reversals within weeks to months after bottom signals appear. Investors can observe trading volume, hashrate changes, and institutional capital flows to assist in determining whether the market has bottomed.
Identification Methods

Image Source: pexels
Technical Indicators
Investors often rely on multiple technical indicators to identify market bottoms. Different indicators perform variably at historical bear market bottoms. The table below summarizes the effectiveness of several mainstream technical indicators in identifying market bottoms:
| Indicator | Effectiveness in Identifying Market Bottoms |
|---|---|
| Arms Index | Identified six bear market bottoms, missed four, and generated six false signals. |
| 200-Day Moving Average | Identified six bear market bottoms with no false signals. |
| Capitulation Indicator | Identified ten out of the past fourteen bear market bottoms with no false signals. |
| VIX | Identified multiple market bottoms, with specific performance not detailed. |
| Put/Call Ratio | Identified multiple market bottoms, with specific performance not detailed. |
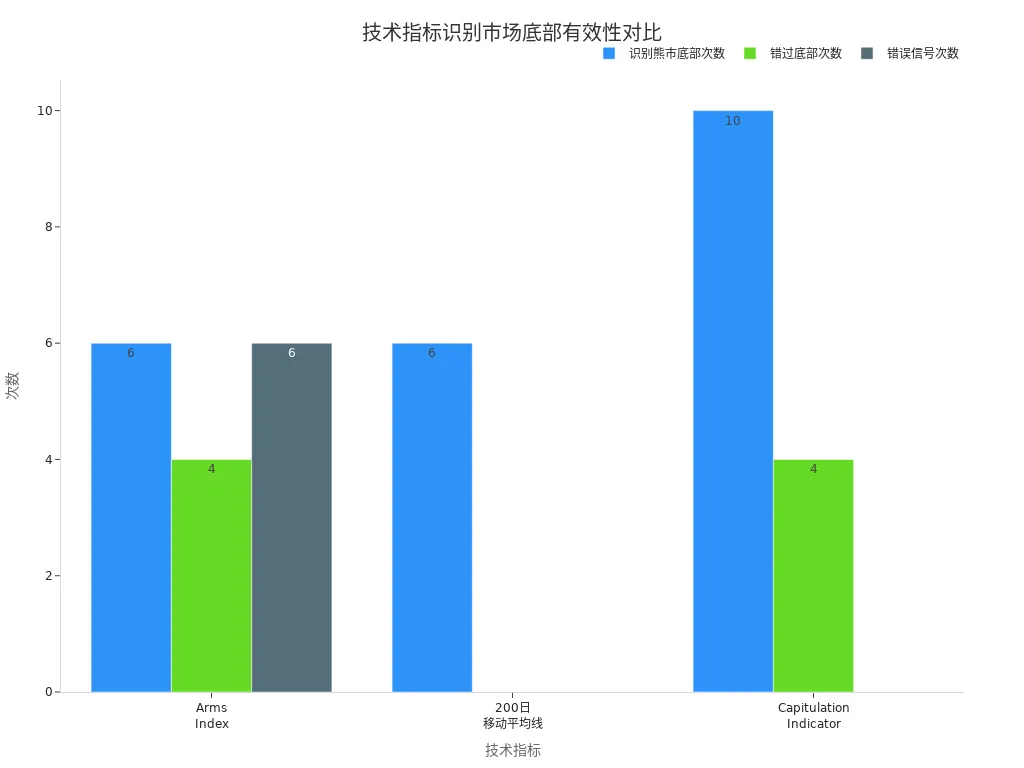
The Capitulation Indicator has shown outstanding performance in historical data, accurately capturing most bear market bottoms. The 200-day moving average also holds significant reference value. VIX and Put/Call Ratio reflect extreme changes in market sentiment, often peaking in bottom zones. Investors can combine multiple indicators to improve identification accuracy.
Sentiment Analysis
Extreme market sentiment is often accompanied by capitulation selling. Sentiment analysis tools help investors quantify market fear or greed. The table below lists several commonly used sentiment analysis tools and their features:
| Tool Name | Description |
|---|---|
| CNN Fear & Greed Index | Measures market sentiment through the average of seven indicators, with 0-25 indicating extreme fear and 75-100 indicating extreme greed. |
| NAAIM Exposure Index | Reflects the risk appetite of professional investment managers, with values below 30% indicating heightened market fear. |
| AAII Investor Sentiment Survey | Measures retail investor psychology, aiding in analyzing market sentiment changes. |
These tools reveal the psychological state of market participants through quantified data. When the CNN Fear & Greed Index is in the extreme fear range and the NAAIM Exposure Index drops significantly, the market is often near a bottom. Investors can combine sentiment indicators with technical signals to assist in determining whether the market is entering a reversal window.
Tool Recommendations
Ordinary investors can use various platforms and tools to track market bottom signals in real time. For technical analysis platforms, the following are widely used in the U.S. market:
| Platform Name | Features |
|---|---|
| Trading Central | Offers excellent technical analysis tools, integrated into many brokerage platforms. |
| Ally Invest | Includes a stock screener powered by Trading Central. |
| Charles Schwab | Its StreetSmart Edge platform provides real-time data screening, including Trading Central’s technical signals. |
| TrendSpider | Offers a range of technical analysis tools to help users find, plan, and time trades more efficiently. |
For the cryptocurrency market, miner selling behavior is a key signal for identifying capitulation selling. Investors can use the following tools to track miner-related data:
- CryptoQuant: Provides visualized dashboards for miner balances and outflows to exchanges.
- Glassnode: Monitors blockchain behavior, providing macro-level insights.
- Arkham Intelligence: Supports HODL wave charts, miner flow analysis, and wallet activity trends.
These tools help investors grasp on-chain capital flows and miner behavior changes in real time, aiding in determining whether the market is in an extreme panic phase. By combining technical indicators, sentiment analysis, and on-chain data, investors can more scientifically identify market bottoms, enhancing the objectivity and foresight of their decisions.
Investment Strategies
Risk Control
During periods of extreme market volatility, investors should prioritize risk management. Effective risk control strategies include setting predefined stop-loss orders, diversifying investments across different asset classes, and periodically reallocating assets to reduce risk exposure. Many professionals recommend maintaining an emergency fund in portfolios, which not only alleviates psychological pressure but also provides liquidity support during market turmoil. Common U.S. market asset allocation models include diversified portfolios, balanced portfolios, and income portfolios. Investors can dynamically adjust the proportion of stocks and bonds based on their time horizon and goals. For example, nearing retirement, increasing the bond allocation, with USD-denominated bonds, can effectively buffer short-term market fluctuations.
Maintaining patience and controlling asset allocation help investors stay calm during high-volatility periods, avoiding impulsive decisions driven by panic.
Dollar-Cost Averaging
Dollar-cost averaging is an effective method for addressing uncertainty at market bottoms. By spreading out investment timing, investors reduce the risk of unfavorable entries due to market volatility. Gradually building positions not only enhances risk control but also allows flexible strategy adjustments based on market dynamics. Staggered trading helps reduce emotional pressure, making it easier for investors to maintain discipline and composure. U.S. market data shows that dollar-cost averaging can achieve diversified performance under different market conditions, avoiding reliance on a single market scenario.
- Reduces timing risk
- Enhances strategy flexibility
- Alleviates emotional pressure
- Optimizes position sizing
- Diversifies performance
Mindset Adjustment
A rational investment mindset is key to long-term success. Investors should develop a comprehensive investment plan, regularly review portfolios, and avoid over-focusing on short-term fluctuations. Diversified portfolios can reduce the impact of emotional decisions. Psychological studies show that fear and greed often interfere with rational thinking. Investors can use techniques like “box breathing” to stay calm, understand the brain’s response mechanisms under stress, and focus on long-term goals. Historical data shows that bull markets typically last longer and yield higher returns than bear markets, and long-term holding strategies help recover losses faster. Investors should focus on long-term goals and avoid impulsive decisions due to short-term fluctuations.
When identifying market bottoms, investors should focus on the following practical signals:
- Track the number of daily new lows; in the late stages of a bear market, if net new lows exceed 750 in a week, consider positioning in the fourth week.
- Combine the 200-day moving average, sentiment indicators, and on-chain data to improve judgment accuracy.
- Develop a trading plan and regularly evaluate performance, avoiding emotion-driven decisions.
- Avoid trying to time the exact bottom and focus on the long-term value of quality assets.
- Continuously learn about market changes, adjust strategies flexibly, and maintain a rational mindset.
| Traditional Financial Markets | Cryptocurrency Markets |
|---|---|
| Rich data, lower volatility | High volatility, diverse indicators |
FAQ
What are the typical signals of capitulation selling?
During extreme market panic, investors exhibit surging trading volumes, soaring panic indices, and concentrated miner sell-offs. Common signals in the U.S. market include elevated VIX, increased put option trading volume, and capital flows to safe assets.
These signals help investors determine whether the market is nearing a bottom.
How soon might the market reverse after capitulation selling?
Historical data shows that markets typically enter a consolidation phase after capitulation selling. The reversal window often spans weeks to months. Investors can use technical indicators and sentiment analysis tools to assist in judgment.
How can ordinary investors use technical indicators to identify bottoms?
Investors can focus on technical signals like the 200-day moving average, capitulation indicators, and VIX. Combining sentiment analysis tools, such as the CNN Fear & Greed Index, helps improve judgment accuracy.
What are the unique bottom signals in the cryptocurrency market?
Surging miner sell-offs, significant hashrate declines, and changes in on-chain capital flows are common bottom signals in the cryptocurrency market. Investors can track related data in real time using tools like CryptoQuant.
How can investors manage risk during capitulation selling?
Investors should set stop-loss orders, diversify investments across asset classes, and maintain an emergency fund. Dollar-cost averaging and periodic asset reallocation help reduce risk and maintain portfolio stability.
When capitulation pushes both volume and fear to extremes, you’re likely near a “bottom zone,” not a single print. Tighten execution and costs first—use real-time exchange rates to minimize hidden FX drag.
Turn analysis into action: open with BiyaPay in 3 minutes, no overseas account needed. Convert between fiat and USDT for faster funding; same-day remittance is supported so capital moves quickly; fees from 0.5% can mean up to 90% savings versus banks.
For active traders, zero-fee limit orders on contracts enable cost-efficient entries. Manage US and Hong Kong stocks from one account for fewer switches and quicker reactions. Start executing with discipline and a clear risk plan.
*This article is provided for general information purposes and does not constitute legal, tax or other professional advice from BiyaPay or its subsidiaries and its affiliates, and it is not intended as a substitute for obtaining advice from a financial advisor or any other professional.
We make no representations, warranties or warranties, express or implied, as to the accuracy, completeness or timeliness of the contents of this publication.


Contact Us
Company and Team
BiyaPay Products
Customer Services


is a broker-dealer registered with the U.S. Securities and Exchange Commission (SEC) (No.: 802-127417), member of the Financial Industry Regulatory Authority (FINRA) (CRD: 325027), member of the Securities Investor Protection Corporation (SIPC), and regulated by FINRA and SEC.
registered with the US Financial Crimes Enforcement Network (FinCEN), as a Money Services Business (MSB), registration number: 31000218637349, and regulated by FinCEN.
registered as Financial Service Provider (FSP number: FSP1007221) in New Zealand, and is a member of the Financial Dispute Resolution Scheme, a New Zealand independent dispute resolution service provider.