- EasyCard
- Trade
- Help
- Announcement
- Academy
- SWIFT Code
- Iban Number
- Referral
- Customer Service
- Blog
- Creator
Bullish Engulfing Pattern: A Detailed Explanation of Key Technical Indicators for Insight into Market Reversals


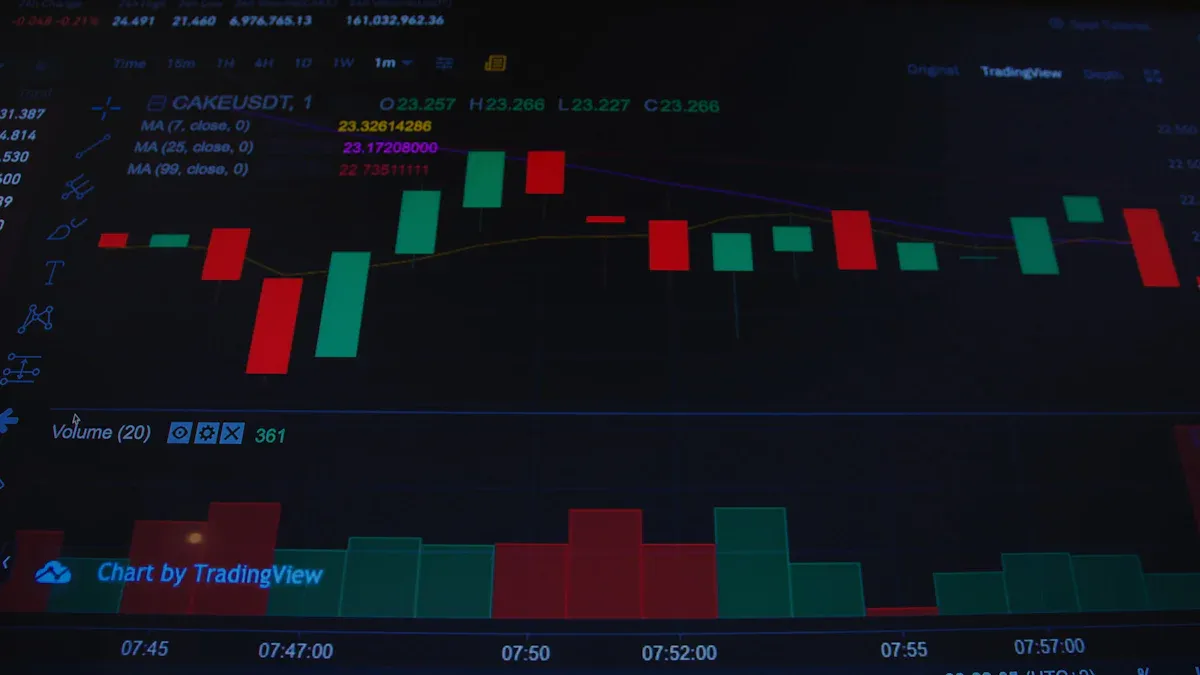
Image Source: pexels
When analyzing the market, you often look for reliable reversal signals. The bullish engulfing pattern, with its simple structure and high frequency of occurrence, is widely regarded in the U.S. market. Data shows that this pattern appears more frequently than other reversal signals:
| Reversal Signal Type | Frequency |
|---|---|
| Bullish Engulfing | Relatively Frequent |
| Other Reversal Signals | Less Frequent |
You should also note that this pattern has a success rate of about 55%, performing particularly well after a mild downtrend. Mastering its identification and application can help you seize critical market reversal opportunities.
Key Takeaways
- The bullish engulfing pattern consists of two candlesticks, with the second candlestick fully or partially engulfing the first, typically appearing at the end of a downtrend, signaling a potential market reversal.
- Successful identification of this pattern requires attention to the size of the candlesticks and the market trend; the larger the body of the second candlestick, the stronger the reversal signal.
- Combining volume and other technical indicators, such as RSI and MACD, can enhance the reliability of the bullish engulfing pattern’s signal and help avoid false signals.
- When trading, it is recommended to set a stop-loss below the low of the engulfing candlestick to effectively manage risk and protect capital.
- The bullish engulfing pattern is applicable across multiple time frames, performing particularly well on daily and weekly charts, making it suitable for short- to medium-term traders.
Definition of the Bullish Engulfing Pattern
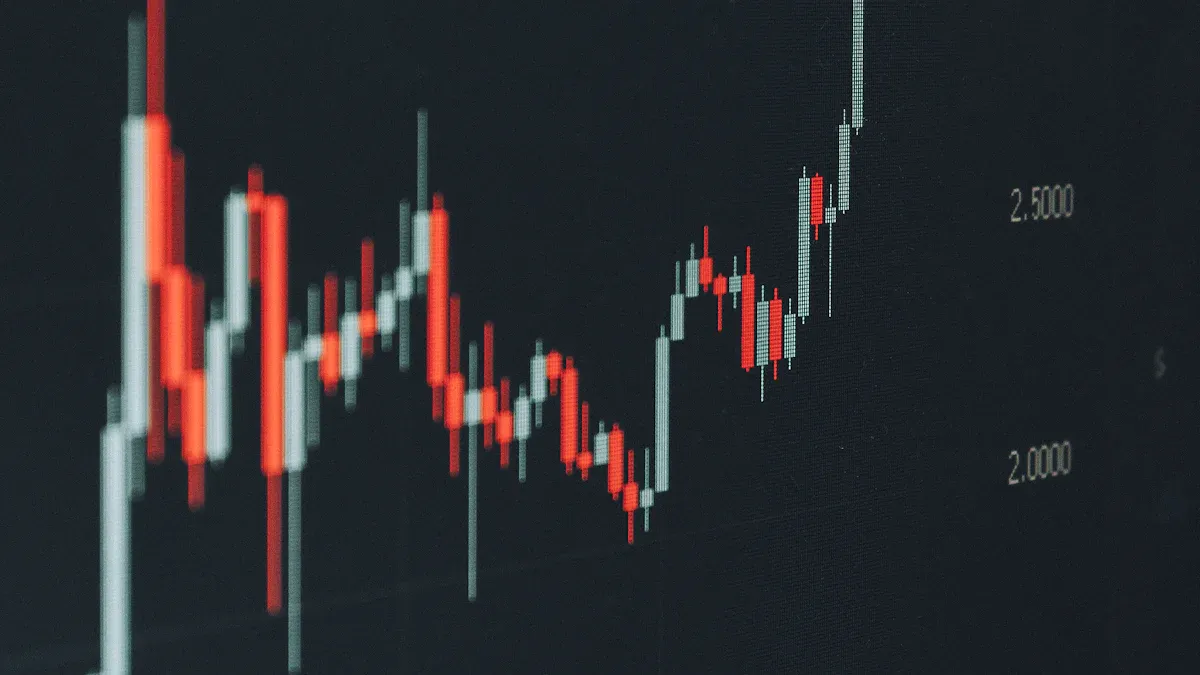
Image Source: pexels
Pattern Structure
When analyzing the U.S. market, you often encounter the bullish engulfing pattern. This pattern consists of two candlesticks, typically appearing at the end of a downtrend. The first is a small bearish candlestick, followed by a larger bullish candlestick. The body of the second candlestick fully or partially engulfs the body of the first, indicating a clear shift in market sentiment. You can better understand its structure and definition through the table below:
| Feature | Description |
|---|---|
| Definition | The bullish engulfing pattern refers to a price trend where the second day’s green candlestick fully or partially engulfs the previous day’s red candlestick, indicating a potential trend reversal. |
| Key Prices | The candlestick chart displays the opening price, closing price, highest price, and lowest price. |
| Pattern Requirements | The second day’s opening price is lower than the first day’s closing price, and the closing price is higher than the first day’s closing price. |
You will notice that the larger the body of the second candlestick, the more pronounced the engulfing effect, and the stronger the reversal signal. This structure is particularly likely to indicate an impending market reversal after a sustained downtrend.
Key Characteristics
When identifying the bullish engulfing pattern, you need to focus on the following key characteristics:
- The pattern consists of a small bearish candlestick followed by a larger bullish candlestick that fully engulfs the former.
- The closing price of the second candlestick is higher than the opening price of the first, indicating strengthening buying pressure.
- This pattern often appears at the end of a downtrend, signaling increasing buying pressure and weakening selling pressure.
- Compared to other reversal patterns, the bullish engulfing pattern clearly reflects a shift in market sentiment from bearish to bullish, serving as a key buying signal for traders.
- If the engulfing candlestick has a large body and fully engulfs the previous candlestick, it indicates strong bullish momentum, making the signal more reliable. If it only partially engulfs or has a smaller body, the signal’s reliability decreases.
- You will notice that in low-volatility market environments, this pattern’s reversal signal is more reliable, while in high-volatility markets, false signals are more likely.
You can refer to the table below to understand the reliability of this pattern under different market conditions:
| Market Condition | Reliability of Engulfing Pattern |
|---|---|
| High Volatility | False signals are more common, making the engulfing pattern less reliable |
| Low Volatility | The engulfing pattern is a reliable indicator of a potential trend reversal |
Additionally, statistical data shows that the bullish engulfing pattern has a theoretical performance of 63%, with a 67% success rate for achieving the optimal price target. This suggests that in practice, combining this pattern with other technical indicators can significantly increase your chances of capturing market reversal opportunities.
Identification and Formation Conditions
Identification Method
When analyzing the U.S. market, you can efficiently identify the bullish engulfing pattern through the following steps:
- Identify the trend. First, determine whether the market is in a clear downtrend. The bullish engulfing pattern is more likely to indicate a reversal when it appears after a downtrend.
- Look for the engulfing pattern. Check the candlestick chart to confirm whether a larger bullish candlestick body fully engulfs the smaller bearish candlestick body from the previous day.
- Wait for confirmation. After identifying the pattern, it’s advisable to wait for the next candlestick’s closing price to be higher than the top of the engulfing pattern to enhance signal validity.
- Manage risk. You should always set a stop-loss, typically below the low of the engulfing candlestick.
In practice, changes in trading volume are equally important. You can focus on the following points:
- When trading volume significantly increases, the reversal signal is stronger, indicating more traders are participating in buying.
- High trading volume helps distinguish strong from weak bullish engulfing patterns, enhancing signal reliability.
Formation Conditions
You need to understand that an effective bullish engulfing pattern must meet the following market conditions:
| Condition | Description |
|---|---|
| Market Trend | Must form during a downtrend. |
| First Candlestick | Must be a small bearish candlestick. |
| Second Candlestick | Must be a larger bullish candlestick, fully engulfing the body of the first candlestick. |
| Candlestick Color Contrast | The first candlestick is bearish (red/black), and the second is bullish (green/white). |
| Confirmation Conditions | The second candlestick’s opening price is lower than the first candlestick’s closing price, and its closing price is higher than the first candlestick’s opening price. |
You can also combine other technical indicators to improve judgment accuracy:
- Indicators like moving averages can enhance the pattern’s reliability, helping you confirm the strength of the reversal signal.
- When the bullish engulfing pattern appears near key support levels or the 50-day or 200-day moving averages, the signal carries more weight.
Professional Advice: In actual trading, it’s recommended to combine candlestick patterns, volume, and technical indicators for multidimensional analysis to avoid misjudgments based on a single signal.
Application of Reversal Signals

Image Source: pexels
Entry Strategies
When analyzing the U.S. market, after encountering a bullish engulfing pattern, you typically consider various entry methods. Here are common entry strategies:
- Immediate Entry: When the pattern appears after a clear downtrend, you can open a long position directly to capture the first wave of the market reversal.
- Wait for a Pullback: Sometimes, the price may retest the high of the engulfing pattern. You can wait for a pullback before entering to reduce the risk of chasing highs.
- Confirmation Entry: You can wait until the closing price of the candlestick following the engulfing pattern is higher than the engulfing candlestick’s top before confirming the market direction and entering.
When operating in practice, it’s advisable to choose the entry timing based on the market environment and your risk tolerance. The table below compares the success rates and optimal time frames of several common reversal signals to help you better plan your trades:
| Pattern Type | Success Rate | Optimal Time Frame |
|---|---|---|
| Bullish Engulfing | 73% | Daily |
| Morning Star | 75% | 4-hour |
| Hammer | 67% | Daily |
| Three White Soldiers | 84% | Weekly |
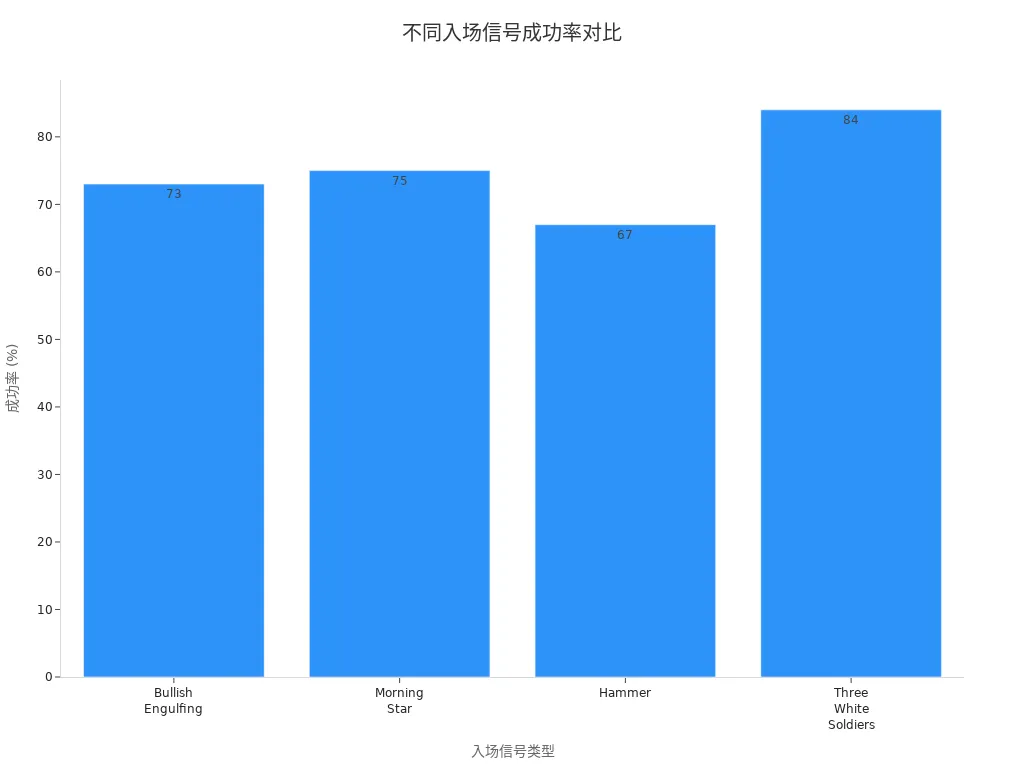
You can see that the bullish engulfing pattern has a high success rate on the daily time frame, making it suitable for short- to medium-term traders.
Stop-Loss and Take-Profit
When formulating a trading plan, you must prioritize stop-loss and take-profit strategies. Proper stop-loss and take-profit settings not only protect your capital but also help lock in profits. Common stop-loss and take-profit methods are shown in the table below:
| Stop-Loss Strategy | Take-Profit Strategy |
|---|---|
| Set the stop-loss below the low of the bullish engulfing candlestick | Set the profit target at the next significant resistance level |
| Set a percentage-based stop-loss based on the entry price | Aim for a risk-reward ratio of at least 2:1 |
| Set the target based on market context and confirmation signals | Set take-profit levels based on lower time frame analysis |
In practice, you can place a stop-loss order below the low of the engulfing candlestick to effectively control losses even if the reversal fails. Historical backtesting shows that this strategy significantly reduces risk:
| Trading Strategy | Stop-Loss Placement |
|---|---|
| Enter a long position at the close of the engulfing candlestick | Set the stop-loss at the low of the engulfing candlestick |
You can also set a percentage-based stop-loss, such as exiting when the loss reaches 2%. For take-profit, it’s advisable to set the target at the next significant resistance level or aim for a risk-reward ratio of at least 2:1.
Professional Advice: You should flexibly adjust stop-loss and take-profit strategies based on different market environments to avoid capital drawdowns due to a single approach.
Technical Indicator Combinations
In actual trading, relying solely on the bullish engulfing pattern may lead to false signals. Combining technical indicators can significantly improve signal reliability. Below are commonly used technical indicator combinations:
- Volume Analysis: You can observe the trading volume when the engulfing pattern appears. If accompanied by increased volume, it indicates strong buying interest, making the reversal signal more reliable.
- Relative Strength Index (RSI): You can use RSI to determine if the market is in an oversold zone. If RSI is below 30 and an engulfing pattern appears, the reversal probability is higher.
- Moving Average Convergence Divergence (MACD): A MACD bullish crossover combined with the engulfing pattern can further confirm a trend reversal.
- Bollinger Bands: You can observe whether the price breaks above the lower Bollinger Band and forms an engulfing pattern, which often signals a rebound opportunity.
You can also combine trend analysis tools to identify the broader market direction. Multiple studies show that when the bullish engulfing pattern is accompanied by high volume and preceded by three or more consecutive bearish candlesticks, the success rate typically exceeds 70%.
Friendly Reminder: You should analyze from multiple dimensions and avoid relying on a single signal to prevent misjudgments. Combining volume, RSI, MACD, and other indicators can effectively improve trading success rates.
Comparative Analysis of Patterns
Comparison with Other Reversal Patterns
When analyzing the U.S. market, you often encounter various reversal patterns. Compared to classic patterns like the hammer or morning star, the bullish engulfing pattern has distinct structural and signal characteristics. The table below helps you quickly understand the core features of these patterns:
| Candlestick Pattern | Description |
|---|---|
| Bullish Engulfing | Consists of two candlesticks: a short red candlestick followed by a long green candlestick that fully engulfs the first, indicating strong buying pressure. |
| Hammer | A single candlestick with a short body and a long lower shadow, appearing at the bottom of a downtrend, showing buyers starting to control the market. |
| Morning Star | A three-candlestick combination: a long red candlestick, a small-bodied candlestick, and a long green candlestick, reflecting weakening selling pressure and a potential reversal. |
You will notice that the bullish engulfing pattern occurs after a small bearish candlestick, followed by a larger bullish candlestick, making the signal direct and easy to identify. The hammer emphasizes the length of the lower shadow, while the morning star requires three candlesticks, making it more complex. In actual trading, you can often more quickly capture market reversal opportunities through the bullish engulfing pattern.
Unique Advantages
When choosing reversal signals, the bullish engulfing pattern offers the following unique advantages:
- Easy to identify and interpret, with a clear structure suitable for both beginners and professional traders.
- Provides a clear stop-loss level, typically based on the low of the engulfing candlestick, facilitating risk management.
- Can be combined with volume, RSI, MACD, and other technical indicators to improve signal accuracy.
- Applicable across multiple time frames and asset classes, allowing flexible use whether you focus on daily, weekly, or different asset types.
- You can focus on the pattern’s appearance at key support and resistance levels, which helps improve market timing.
- Traders can assess the signal’s authority by considering the size of the engulfing candlestick and the overall trend context, especially in significant areas like round numbers or long-term moving averages, where the signal carries more weight.
Professional Tip: In actual trading, it’s advisable to combine market conditions and technical indicators to fully leverage the advantages of the bullish engulfing pattern, enhancing the scientific rigor and effectiveness of trading decisions.
Common Pitfalls
Misjudgment Scenarios
In actual trading, you often encounter misjudgments regarding the bullish engulfing pattern. Below are the most common scenarios:
- You may focus solely on the bullish engulfing pattern itself while ignoring the broader market environment and other technical signals, which can lead to erroneous trading decisions.
- You sometimes overlook the size of the engulfing candlestick’s body, making it difficult to accurately gauge the strength of the trend, thus missing critical buying or selling opportunities.
- Many traders rush to enter a position as soon as the pattern appears, without waiting for confirmation from subsequent candlesticks or technical indicators, resulting in buying at false reversal points.
- You need to note that not every bullish engulfing pattern leads to a genuine trend reversal. False signals are more common in choppy or strongly trending markets.
- If the overall market trend remains bearish, a single engulfing pattern is often insufficient to support a reversal judgment.
When analyzing the U.S. market, it’s advisable to always combine the market trend and volume to avoid misjudging the market due to a single signal.
Avoidance Techniques
You can effectively avoid these common pitfalls and improve trading success through the following methods:
- Combine momentum oscillators like RSI and MACD. When RSI rebounds from an oversold zone or MACD shows a bullish crossover, it provides strong confirmation for the bullish engulfing pattern.
- Focus on key support and resistance levels. If the pattern appears near significant support, buying pressure is stronger, increasing the reversal probability.
- Observe volume changes. High volume accompanying the bullish engulfing pattern typically indicates increased market participation, making the signal more reliable.
- You can combine high volume, RSI bullish crossovers, and bullish engulfing patterns at key support levels to form a high-probability buying strategy.
- Wait for the next candlestick’s closing price to confirm, avoiding false signals due to premature entry.
| Technique Category | Specific Actions |
|---|---|
| Technical Indicator Combinations | RSI, MACD, and volume analysis |
| Key Level Judgment | Focus on support/resistance levels to enhance signal validity |
| Trading Discipline | Wait for confirmation signals to avoid emotional trading |
When formulating a trading plan, it’s advisable to analyze from multiple dimensions, combining various technical indicators and market structures to significantly reduce the risk of misjudgment.
By scientifically identifying the bullish engulfing pattern, you can improve the success rate of trading decisions. According to market research, studies on the trading success rate based on this pattern show that the trading success rate based on this pattern is:
| Trading Strategy | Success Rate |
|---|---|
| Bullish Engulfing Pattern | 63% |
In practice, you should prioritize risk management, with common methods including:
- Setting a stop-loss below the low of the engulfing candlestick or key support level
- Adjusting stop-loss based on market volatility and personal risk tolerance
- Setting reasonable profit targets, focusing on resistance levels
- Using trailing stops to lock in profits
Professional traders also combine their trading systems, flexibly integrating the bullish engulfing pattern with support levels, stop-loss, and profit-taking strategies. You can adapt these methods based on your style to enhance the scientific rigor and safety of operations in the U.S. stock market.
FAQ
What is the best time frame for applying the bullish engulfing pattern?
You can apply the bullish engulfing pattern on daily and weekly charts. The daily time frame is more suitable for short- to medium-term trading, while the weekly time frame suits medium- to long-term strategies.
How can you determine the validity of the signal after a bullish engulfing pattern appears?
You should combine volume, RSI, and other technical indicators. If volume increases significantly and RSI is in the oversold zone, the signal is more reliable.
Can you rely solely on the bullish engulfing pattern for trading decisions?
You are advised not to rely solely on this pattern. Please combine it with trends, support levels, and other technical indicators for multidimensional signal confirmation.
Which asset classes is the bullish engulfing pattern suitable for?
You can apply the pattern to stocks, indices, ETFs, and certain commodities in the U.S. market. Different assets require analysis based on their volatility characteristics.
How should you set a stop-loss to manage risk?
You should set the stop-loss below the low of the engulfing candlestick. This effectively controls losses and protects capital safety.
Mastering the bullish engulfing pattern can help you spot reversal opportunities in the US stock market, but real-world trading often involves high cross-border remittance fees, uncertain exchange rate fluctuations, and the hassle of opening overseas accounts. These issues can cause delays in fund transfers, leading to missed optimal entry points. As an efficiency-focused trader, you need a reliable platform to streamline these processes.
BiyaPay is your ideal solution. It offers real-time exchange rate queries, allowing you to stay on top of fiat-to-crypto conversions with support for multiple currencies, ensuring efficient fund movement. Remittance fees are as low as 0.5%, with zero fees for contract orders, and it supports same-day transfers to most countries and regions worldwide. Best of all, you don’t need an overseas account to trade US and Hong Kong stocks on a single platform, making it easy to capitalize on market trends.
Quickly register for BiyaPay and experience these benefits right away. Whether you’re a beginner or seasoned trader, this platform enhances your trading journey, enabling swift action after spotting reversal signals. Don’t let fees and account barriers hold you back—join BiyaPay now and embark on a smarter financial path!
*This article is provided for general information purposes and does not constitute legal, tax or other professional advice from BiyaPay or its subsidiaries and its affiliates, and it is not intended as a substitute for obtaining advice from a financial advisor or any other professional.
We make no representations, warranties or warranties, express or implied, as to the accuracy, completeness or timeliness of the contents of this publication.


Contact Us
Company and Team
BiyaPay Products
Customer Services


is a broker-dealer registered with the U.S. Securities and Exchange Commission (SEC) (No.: 802-127417), member of the Financial Industry Regulatory Authority (FINRA) (CRD: 325027), member of the Securities Investor Protection Corporation (SIPC), and regulated by FINRA and SEC.
registered with the US Financial Crimes Enforcement Network (FinCEN), as a Money Services Business (MSB), registration number: 31000218637349, and regulated by FinCEN.
registered as Financial Service Provider (FSP number: FSP1007221) in New Zealand, and is a member of the Financial Dispute Resolution Scheme, a New Zealand independent dispute resolution service provider.