- EasyCard
- Trade
- Help
- Announcement
- Academy
- SWIFT Code
- Iban Number
- Referral
- Customer Service
- Blog
- Creator
Avoiding Investment Pitfalls: ROA Analysis Helps You Identify "Fake Profits"


Image Source: unsplash
Have you ever worried that a company’s superficial profit data might conceal its true condition? ROA analysis can help you see through a company’s profitability, enabling you to identify hidden investment traps. By examining the relationship between net income and total assets, you can more intuitively assess asset utilization efficiency. Mastering ROA analysis will give you more scientific investment judgment.
Key Points
- ROA (Return on Assets) is a key indicator for evaluating a company’s ability to generate profits from its assets, helping you assess its profitability.
- By comparing ROA with other financial metrics like ROE and ROS, you can more comprehensively identify the quality of a company’s profits, avoiding being misled by false data.
- Regularly monitoring changes in ROA trends can help you promptly detect potential financial issues in a company, protecting your investment safety.
- Focusing on asset quality indicators, such as the non-performing asset ratio, helps you assess a company’s financial health and avoid investment traps.
- When analyzing a company, combining industry averages and historical data enhances the scientific nature of your investment decisions, ensuring wise choices.
ROA Overview

Image Source: pexels
Definition and Calculation
You can use ROA (Return on Assets) to measure a company’s ability to generate profits from its assets. ROA shows the percentage of profit generated per dollar of assets invested. You can calculate it using the following formula:
Here, net income is the company’s earnings after deducting all expenses and taxes, while average total assets is the average of total assets at the beginning and end of the period. ROA considers not only cash but also all assets like inventory and equipment. Many financial textbooks define ROA as net income divided by total assets, but you should note that standard calculations should focus on operational returns to avoid being influenced by capital structure. The table below shows the main components of ROA:
| Component | Description |
|---|---|
| Net Income | Profit after deducting all operating expenses and taxes. |
| Total Assets | Includes all assets such as cash, inventory, and equipment. |
| ROA Formula | ROA = Net Income / Total Assets, multiplied by 100 to get a percentage. |
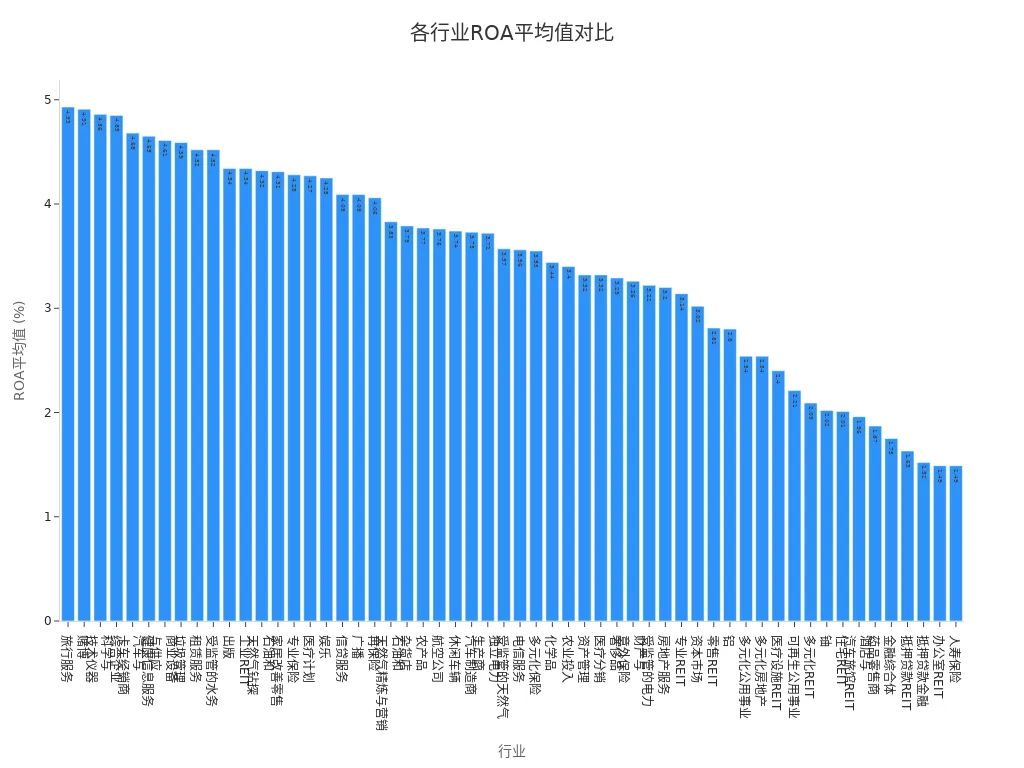
You can use industry averages to assess a company’s asset utilization efficiency. For example, the average ROA for U.S. companies is 6.2%, significantly higher than the 1.9% for mainland Chinese companies. The chart below shows the average ROA levels across different industries:
Role and Limitations
ROA can help you quickly assess a company’s asset utilization efficiency and profitability. You can use ROA to identify which assets contribute the most, optimizing investment decisions. Companies with high ROA are typically more competitive and better able to meet customer needs. By regularly monitoring ROA, you can gain strategic insights into a company’s performance and improvement benchmarks.
Tip: ROA is suitable for comparing companies within the same industry, as differences between industries can be significant.
You should note that ROA has limitations. Different asset valuation methods can affect results, and historical cost may lead to distortions. Differences in accounting standards like GAAP and IFRS can also impact asset recognition and ROA calculations. Relying solely on ROA may overlook critical factors like liquidity, profitability, and market conditions. You should combine other financial metrics to comprehensively analyze a company’s true condition.
Signs of Fake Profits

Image Source: pexels
Profit Inflation
When analyzing corporate financial statements, you often encounter profit inflation. Companies may use various accounting tactics to make their financial data appear better. Here are some common methods of profit inflation:
- Inflating revenue at the end of the period
- Recognizing sales for undelivered goods
- Inflating sales to related parties
- Capitalizing expenses
- Recognizing shipments to resellers without financial capacity
- Estimating sales that have not yet occurred
- Deliberately underestimating bad debt provisions
You should be cautious of these tactics. Companies often manipulate earnings to boost their stock prices. After stock prices rise, company executives may sell stocks for profit.
You may also notice some companies use methods like capitalizing expenses and channel stuffing. Capitalizing expenses involves transferring costs that should be recorded as current expenses to assets, temporarily avoiding profit impact. Channel stuffing involves sending excess products to distributors or retailers at the end of a financial period, beyond their actual sales capacity. These actions may make profits appear higher in the short term, but they do not reflect a genuine improvement in profitability.
Asset Quality
When judging the authenticity of a company’s profits, you cannot rely solely on profit figures; you must also focus on asset quality. Declining asset quality directly affects a company’s future profitability. The table below shows common asset quality warning indicators:
| Indicator | Description |
|---|---|
| Non-Performing Asset Ratio | The ratio of non-performing assets to total assets, reflecting credit quality. |
| Loan Loss Reserve Ratio | The ratio of loan loss reserves to non-performing loans, indicating potential losses. |
| Delinquency Rate Trend | Rising delinquency rates typically signal deteriorating non-performing assets. |
| Capital Ratio | Declining capital ratios may limit a bank’s operational flexibility. |
| Loan Growth Rate | Excessive loan growth may indicate relaxed credit standards. |
You should also note the impact of asset impairment and revaluation on ROA. When a company’s assets are impaired, total assets decrease, and with unchanged net income, ROA may be inflated. Asset revaluation may increase asset values, causing ROA to be underestimated or distorted. These changes can mislead your judgment of a company’s true profitability. You need to combine asset quality indicators with ROA to comprehensively analyze a company’s financial condition, avoiding being misled by superficial data.
How ROA Reveals Fake Profits
Indicator Comparison
When analyzing a company’s profitability, you can compare ROA with other profitability metrics to uncover hidden investment traps. ROA reflects a company’s efficiency in generating profits from assets, but looking at ROA alone may not reveal all issues. You can also focus on ROE (Return on Equity) and ROS (Return on Sales) to gain a more comprehensive financial perspective.
- Comparing ROA with ROE and ROS helps identify discrepancies in a company’s reported profitability.
- By comparing these metrics, you can detect whether a company is engaging in accounting manipulations or suffering from poor management, leading to “fake profits.”
- Multi-dimensional analysis makes it easier to uncover the true state of a company’s financial health and operational efficiency.
For example, a U.S. manufacturing company reports an ROA of 2% but an ROE of 15%. You can infer that the company may be using high leverage to boost ROE, while its actual asset utilization efficiency is low. If both ROA and ROS are below industry averages, you should be cautious of potential profit inflation or declining asset quality. This comparative analysis helps you identify investment traps and avoid being misled by superficial data.
You can also refer to academic research. Many industry reports and papers emphasize the importance of ROA in identifying fake profits. For example, studies on the natural stone industry in Spain and Italy, as well as agricultural companies in mainland China and Indian firms, demonstrate ROA’s effectiveness. These studies provide theoretical support, giving you more confidence in practical investing.
Tip: When analyzing a company, it’s recommended to review ROA, ROE, and ROS together, combined with industry averages, to enhance your ability to identify investment traps.
Trend Analysis
You can further identify fake profits by analyzing ROA trends. A single year’s ROA data may not reflect a company’s true condition, but multi-period data analysis is more informative. You can use statistical methods to detect abnormal fluctuations or sustained declines.
The table below shows common ROA trend analysis methods:
| Method | Description |
|---|---|
| Z-Score | Measures the deviation of a data point from the mean, with absolute values greater than 2 or less than -2 typically indicating anomalies. |
| Percentile Threshold | Identifies outliers by setting percentile thresholds to analyze data distribution. |
| Rolling Average Deviation | Measures the deviation of the current value from the moving average over a selected time window, capturing sustained trends or changes. |
You can use the Z-Score method to determine if a year’s ROA deviates significantly from historical averages. If ROA suddenly spikes without supporting business growth, you should be cautious of potential profit inflation through accounting tactics. Percentile thresholds can help you identify extreme values, while rolling average deviation captures long-term trend changes. Through these methods, you can promptly detect investment traps and protect your capital safety.
When analyzing U.S. market companies, it’s recommended to combine industry cycles and economic conditions to comprehensively assess ROA changes. Sustained ROA declines may signal deteriorating asset quality and increased risks of profit inflation. Through trend analysis, you can not only identify fake profits but also proactively avoid potential investment traps.
Reminder: Before investing, it’s recommended to collect at least three years of ROA data and combine trend analysis to enhance the scientific nature of investment decisions.
Identifying Investment Traps
Case Study 1: Profit Quality
When investing, you often encounter companies with impressive superficial profit data but low actual profit quality. ROA analysis can help you identify these investment traps. By observing a company’s ROA level, you can assess its asset utilization efficiency and management capabilities. If a company’s ROA is consistently below the industry average, it indicates inefficient asset utilization, possibly due to poor management or low efficiency.
You can refer to the following real-world case:
- A U.S. listed retail company reported consistent net income growth in its financial statements, but its ROA declined year after year. Through analysis, you find that the company aggressively expanded its stores, rapidly increasing its asset base, but the new stores had insufficient profitability, leading to a decline in overall asset returns. Ultimately, due to poor management and low asset utilization, the company’s stock price plummeted, causing significant losses for investors.
- Many scholars and industry reports note that companies with high ROA typically have efficient operations and strong brand value. When screening investment targets, you can prioritize companies with ROA above industry averages to effectively avoid investment traps with low profit quality.
You should also be cautious of the following common investment traps:
- Social media ads promising high returns often hide risks.
- Newly acquainted “investment experts” may exploit your trust to lure you into high-risk projects.
- Advisors pressuring you to invest quickly should raise red flags.
- Promises of high returns and quick profits are often characteristics of fraudulent investments.
Before investing, you must conduct independent research and thoroughly understand a company’s financial condition to avoid being misled by superficial data.
Tip: Through ROA analysis, combined with industry averages and historical trends, you can assess profit quality and steer clear of investment traps.
Case Study 2: Net Income Divergence
When analyzing corporate financial statements, you may notice a significant divergence between net income and ROA. This phenomenon often signals profit inflation or deteriorating asset quality. By comparing trends in net income and ROA, you can identify hidden investment traps.
For example, the U.S. market has seen several notable accounting scandals where ROA analysis played a key role. The table below shows some historical cases:
| Case Name | Year | Main Issue Description |
|---|---|---|
| AIG Scandal | 2005 | CEO manipulated stock prices, leading to nearly $4 billion in accounting fraud. |
| Lehman Brothers Scandal | 2008 | Hid over $50 billion in loans disguised as sales, ultimately leading to bankruptcy. |
| Bernie Madoff Scandal | 2008 | The largest Ponzi scheme, defrauding investors of over $64.8 billion. |
| Satyam Scandal | 2009 | Falsely reported $1.5 billion in revenue, with the founder admitting to fraud. |
| Fannie Mae Scandal | 2003 | Manipulated accounts to meet earnings targets, inflating earnings by $5 billion. |
| HealthSouth Scandal | 1999-2002 | Exaggerated earnings by $1.4 billion, with the CEO orchestrating accounting fraud. |
| Waste Management Scandal | 2000 | Falsely reported $1.7 billion in earnings, with management knowingly participating in fraud. |
You can see that before these scandals broke, these companies often reported strong net income data, but their ROA showed abnormal fluctuations or sustained declines. By analyzing the divergence between ROA and net income, you can promptly detect signs of financial fraud or deteriorating asset quality, avoiding investment traps.
In practice, you can use the following methods:
- Compare historical data of a company’s net income and ROA to identify abnormal changes.
- Pay attention to sudden ROA spikes without supporting business growth.
- Combine industry averages to determine if a company has profit inflation or asset quality issues.
Reminder: Before investing, it’s recommended to collect at least three years of ROA and net income data, combined with trend analysis, to enhance your ability to identify investment traps.
Investment Advice
Key Considerations
When interpreting ROA data, you need to focus on several key points. First, different industries have vastly different asset requirements. For example, manufacturing typically requires expensive equipment, while the service industry has fewer assets. You should not directly compare ROA across different industries, as this can lead to misjudgments of a company’s profitability. You should only compare ROA within the same industry to accurately assess asset utilization efficiency.
When analyzing financial statements, it’s recommended to combine multiple financial ratios. You can focus on ROA, ROE, liquidity ratios, and market value ratios simultaneously. This provides a comprehensive view of a company’s financial condition. You also need to understand the context of the income statement and balance sheet to identify the specific factors driving these ratio changes. For example, short-term cost reductions or share buybacks may affect profitability ratios. When analyzing market value ratios, it’s recommended to combine industry standards and economic conditions to avoid overestimating a company’s value.
Tip: When evaluating a company, it’s recommended to combine liquidity ratios and cash flow analysis to assess short-term solvency. When monitoring debt ratios, pay attention to a company’s debt management capabilities under different economic conditions.
Risk Mitigation
During the investment process, you must proactively mitigate risks to avoid falling into investment traps. You can use the following methods to enhance safety:
- Regularly collect at least three years of ROA data, combined with trend analysis, to detect abnormal fluctuations.
- Focus on asset quality indicators, such as non-performing asset ratios and loan loss reserve ratios, to assess a company’s asset health.
- Combine liquidity ratios and cash flow to evaluate a company’s short-term solvency, avoiding losses due to insufficient liquidity.
- When analyzing U.S. market companies, it’s recommended to combine industry cycles and economic conditions to comprehensively assess ROA changes.
- You can refer to the financial statements of licensed Hong Kong banks to analyze their return on assets and debt management capabilities, enhancing risk identification.
Before investing, it’s recommended to thoroughly study a company’s financial statements and avoid relying on superficial data. Through multi-dimensional analysis, you can identify whether a company is engaging in profit inflation or facing asset quality deterioration. This effectively helps you avoid investment traps and protect your capital safety.
You can use ROA analysis to quickly identify a company’s true profitability, effectively avoiding investment traps. ROA, as a common metric for evaluating company performance, comprehensively reflects income and asset conditions and is less susceptible to financial engineering. You can also combine other financial ratios and analyze trend changes to make more scientific investment judgments. The table below summarizes the advantages of ROA analysis:
| Advantage | Description |
|---|---|
| Comprehensiveness | Considers both income and assets. |
| Stability | Less susceptible to accounting policies and financial engineering. |
| Practicality | Applicable to multiple industries and investment scenarios. |
You can use professional guides and financial data APIs to continuously learn about ROA and financial statement analysis. Rational investing and ongoing improvement of your financial analysis skills will help you make safer investment decisions in the U.S. market.
FAQ
Which Industries Is ROA Analysis Suitable For?
You can use ROA analysis in manufacturing, retail, and service industries. ROA helps you compare asset utilization efficiency. Comparisons within the same industry yield better results.
Is a Higher ROA Always Better?
You cannot judge solely based on ROA’s value. A high ROA indicates good asset utilization efficiency, but you must also analyze it in conjunction with industry averages and the company’s specific circumstances.
Can ROA Analysis Detect All Fake Profits?
You cannot rely solely on ROA analysis. ROA can reveal some fake profits, but you also need to combine asset quality, cash flow, and other metrics for a comprehensive judgment.
How Can You Obtain a Company’s ROA Data?
You can review a company’s annual financial reports or use professional financial data platforms. When analyzing, it’s recommended to collect at least three years of ROA data to observe trend changes.
How Is ROA Analysis Applied in the Banking Industry?
You can use ROA to analyze the return on assets of licensed Hong Kong banks. ROA helps you assess a bank’s asset management efficiency and identify potential risks.
You have gained deep insight into the Protective Call strategy, understanding that risk management and capital efficiency are equally vital when shorting US stocks. In options trading, real-time exchange rates, low transaction fees, and rapid fund settlement are key factors in executing your hedge strategy effectively and locking in profits.
Traditional cross-border methods, such as trading US stock options through licensed banks in Hong Kong, often encounter high remittance fees, complex processes, and non-transparent exchange conversions. These issues not only eat into the potential returns from your sophisticated strategy but can also delay you from seizing fleeting trading opportunities.
BiyaPay eliminates these pain points. We offer real-time exchange rate inquiry and conversion for fiat currencies, and remittance fees as low as 0.5%, ensuring every cross-border transaction is cost-effective. With BiyaPay, you can easily switch between various fiat and cryptocurrencies and participate in global financial markets, including Stocks and options, all on one platform—without needing an overseas account. Your funds can be remitted and arrive within the same day. Click the Real-time Exchange Rate now, BiyaPay for quick registration, and use efficient fund management to steer clear of all investment traps!
*This article is provided for general information purposes and does not constitute legal, tax or other professional advice from BiyaPay or its subsidiaries and its affiliates, and it is not intended as a substitute for obtaining advice from a financial advisor or any other professional.
We make no representations, warranties or warranties, express or implied, as to the accuracy, completeness or timeliness of the contents of this publication.


Contact Us
Company and Team
BiyaPay Products
Customer Services


BIYA GLOBAL LLC is a licensed entity registered with the U.S. Securities and Exchange Commission (SEC No.: 802-127417); a certified member of the Financial Industry Regulatory Authority (FINRA) (Central Registration Depository CRD No.: 325027); regulated by the Financial Industry Regulatory Authority (FINRA) and the U.S. Securities and Exchange Commission (SEC).
BIYA GLOBAL LLC is registered with the Financial Crimes Enforcement Network (FinCEN), an agency under the U.S. Department of the Treasury, as a Money Services Business (MSB), with registration number 31000218637349, and regulated by the Financial Crimes Enforcement Network (FinCEN).
BIYA GLOBAL LIMITED is a registered Financial Service Provider (FSP) in New Zealand, with registration number FSP1007221, and is also a registered member of the Financial Services Complaints Limited (FSCL), an independent dispute resolution scheme in New Zealand.