- EasyCard
- Trade
- Help
- Announcement
- Academy
- SWIFT Code
- Iban Number
- Referral
- Customer Service
- Blog
- Creator
Signs of a U.S. Stock Market Bubble: How Investors Can Avoid Losses


Image Source: pexels
The valuation of the U.S. stock market has reached an extraordinary level. Currently, the gap between expected returns of large-cap growth stocks and cheaper alternative stocks is very significant, indicating that the market is overpricing certain sectors. At the same time, the market capitalization of U.S. stocks accounts for two-thirds of the global market, far exceeding its share of the global economy and population. This scale of imbalance not only reflects potential market risks but may also exacerbate future volatility. Faced with these signs of a U.S. stock market bubble, you need to formulate strategies in advance to protect your investments.
Main Indicators of a U.S. Stock Market Bubble
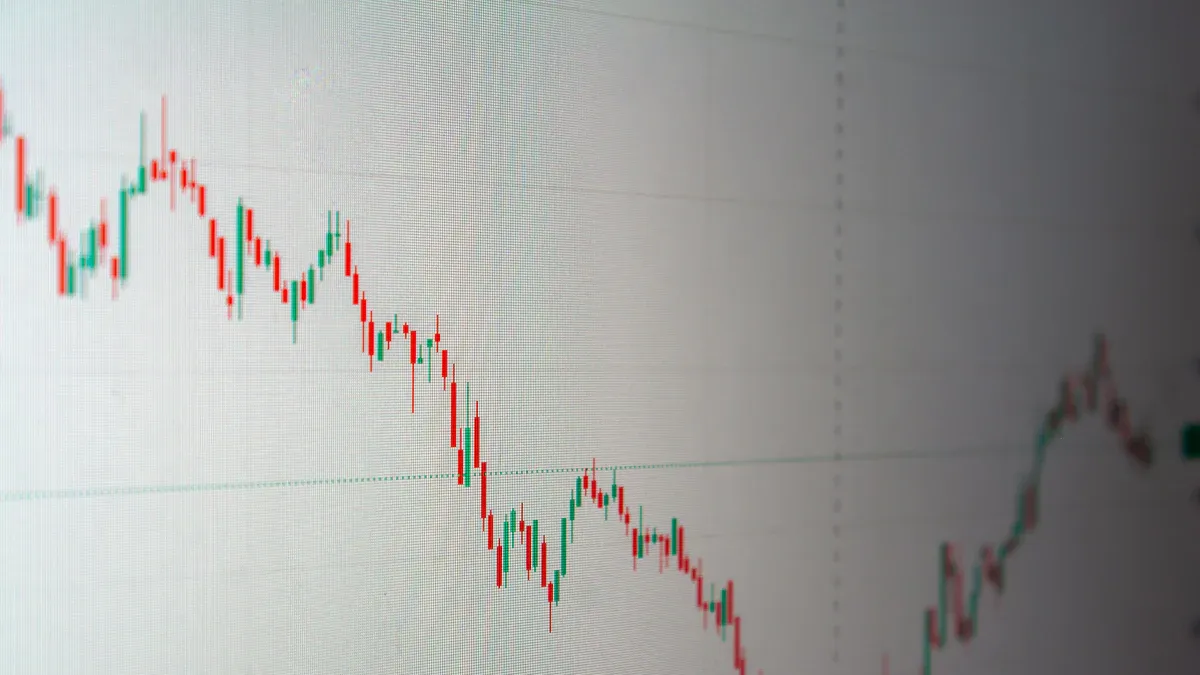
Image Source: unsplash
Market Overheating: Surging Trading Volume and Speculative Behavior
When market trading volume significantly increases, it often signals active speculative behavior. You may have noticed that trading volumes for options and leveraged single-stock ETFs have risen sharply recently. These instruments have attracted a large number of investors, especially retail investors, who hope to achieve high returns through short-term operations. Here are some specific manifestations:
- Options trading volume continues to grow, especially short-term call options, attracting significant participation from retail investors.
- Leveraged single-stock ETFs (such as GraniteShares’ NVDL) provide 2x exposure to NVIDIA stock, fueling a surge in trading activity.
- Investors’ pursuit of short-term gains has led to high-risk speculative activities.
These phenomena indicate overly optimistic market sentiment, with investors ignoring potential risks. You need to be cautious of these signs of market overheating and avoid blindly following the crowd.
Overvaluation: High P/E Ratios and Cyclically Adjusted P/E (CAPE) Anomalies
Overvaluation is a key indicator of a U.S. stock market bubble. The current S&P 500 price-to-earnings ratio (P/E TTM) has reached 26.6 times, standing at the 93.96th percentile historically. This figure is significantly higher than other major markets, such as the Shanghai Composite Index at 14.4 times and the Hang Seng Index at 10.3 times. Here are some key data points:
| Indicator | Current Value | Historical Percentile |
|---|---|---|
| S&P 500 P/E TTM | 26.6x | 93.96% |
| Shanghai Composite P/E TTM | 14.4x | N/A |
| Hang Seng Index P/E TTM | 10.3x | N/A |
| Nikkei 225 P/E TTM | 18.2x | N/A |
| FTSE 100 P/E TTM | 17.1x | N/A |
| DAX P/E TTM | 18.6x | N/A |
As shown in the table, U.S. stock valuations are significantly higher than other markets. This abnormal valuation level may signal future correction risks. You need to monitor these data and avoid blindly increasing positions at high valuations.
Disconnect Between Economic Fundamentals and Stock Market Performance
When stock market performance diverges from economic fundamentals, it is often another sign of a bubble. Despite slowing U.S. economic growth, with pressures from unemployment and inflation persisting, the stock market continues to hit new highs. This phenomenon may stem from overly optimistic market expectations about the future, ignoring potential economic risks.
For example, the market capitalization of many technology stocks far exceeds their actual profitability. This disconnect could lead to greater adjustment pressures in the future. You need to closely monitor the relationship between economic data and stock market performance to avoid making misguided investment decisions driven by market sentiment.
Overly Optimistic Investor Sentiment
When investor sentiment becomes overly optimistic, the market often experiences irrational exuberance. This phenomenon is one of the signs of a U.S. stock market bubble, deserving your special attention. Excessively optimistic sentiment typically leads investors to overlook risks and blindly chase high-return opportunities. Here are some common manifestations:
- Large Influx of Retail Investors: Many novice investors enter the market during upswings, aiming to capture short-term gains. They often lack deep understanding of fundamentals and make decisions based solely on market sentiment.
- Fear of Missing Out (FOMO) Psychology: As the market continues to rise, many fear missing out on opportunities and buy even at high valuations. This psychology further inflates stock prices, creating a vicious cycle.
- Media and Social Network Amplification: Media and social platforms often amplify optimistic market sentiment, attracting more participants. For example, certain popular stocks or sectors may surge rapidly due to online discussions, pushing prices far beyond reasonable levels.
Tip: When you hear rhetoric like “this time is different” or “the stock market will never fall,” it often signals that market sentiment has become overly optimistic.
How to Address Overly Optimistic Market Sentiment?
You need to adopt a calm and rational approach to avoid being swayed by market sentiment. Here are some practical suggestions:
- Stick to Fundamental Analysis: Before investing, thoroughly research a company’s financial health, profitability, and industry outlook. Don’t blindly follow the crowd just because a stock is “hot.”
- Set Clear Investment Goals: Define your investment objectives and risk tolerance. Avoid altering long-term plans due to short-term market fluctuations.
- Monitor Market Signals: Stay vigilant when speculative behavior or overvaluation emerges in the market. These signals may foreshadow an impending market correction.
Maintaining rationality and calmness is key to addressing overly optimistic market sentiment. You need to constantly remind yourself that stock market fluctuations are normal, and blindly chasing highs may lead to significant losses.
Historical Lessons: Insights from Bubble Bursts
Dot-Com Bubble: The Cost of Excessive Speculation
The dot-com bubble is one of the most iconic speculative cases in history. In the late 1990s, technology stock prices were pushed to extreme levels by market sentiment. Many companies lacked actual profitability but attracted massive investment through exaggerated market expectations. Ultimately, the bubble burst in 2000, causing severe global economic fallout.
Here are some specific data points:
- The U.S. and U.K. experienced recessions following the dot-com bubble burst.
- Overcapacity forced capital into speculative markets, forming asset bubbles.
- The U.S. economic losses reached 1.9 times those of the 1929 Great Depression.
| Country | Economic Losses (Trillion Yen) | GDP Proportion |
|---|---|---|
| Japan | 1,000 | 2.4 |
| United States | 1.9x 1929 Great Depression | N/A |
You need to learn from this to avoid blindly chasing high-risk assets. Focus on a company’s actual profitability rather than short-term market sentiment.
Financial Crisis: Leverage and Liquidity Risks
The 2008 financial crisis highlighted the severity of leverage and liquidity risks. Many investors used borrowed funds for high-leverage investments, leading to soaring margin debt. Companies also took on significant debt through non-productive spending and stock buybacks, further exacerbating market risks.
Research shows that higher leverage ratios can reduce systemic risk by enhancing bank liquidity. During the crisis, increased bank capital provided survival space. However, excessively high leverage can also trigger market collapses. Here are some key data points:
| Variable | Coefficient | Significance Level |
|---|---|---|
| Leverage Ratio (lev) | -2.16 | 5% |
| Capital Adequacy Ratio (CAR) | 31.80 | N/A |
| Return on Equity (ROE) | -5.68 | N/A |
You need to be cautious of the risks of leveraged investing to avoid falling into distress due to insufficient liquidity.
Historical Lessons: Heed Market Signals and Monetary Policy Changes
History shows that certain key economic signals often appear before a bubble bursts.
For example:
- Debt levels and margin debt surge.
- Corporate profits stagnate or decline.
- Free cash flow turns negative.
- Asset prices reach historical highs, with valuations becoming excessive.
Additionally, changes in monetary policy can act as a catalyst for bubble bursts. When central banks tighten monetary policy, market liquidity decreases, and asset prices may plummet rapidly. You need to closely monitor these signals and adjust your investment strategy promptly to avoid significant losses due to market corrections.
Investment Strategies to Address a U.S. Stock Market Bubble
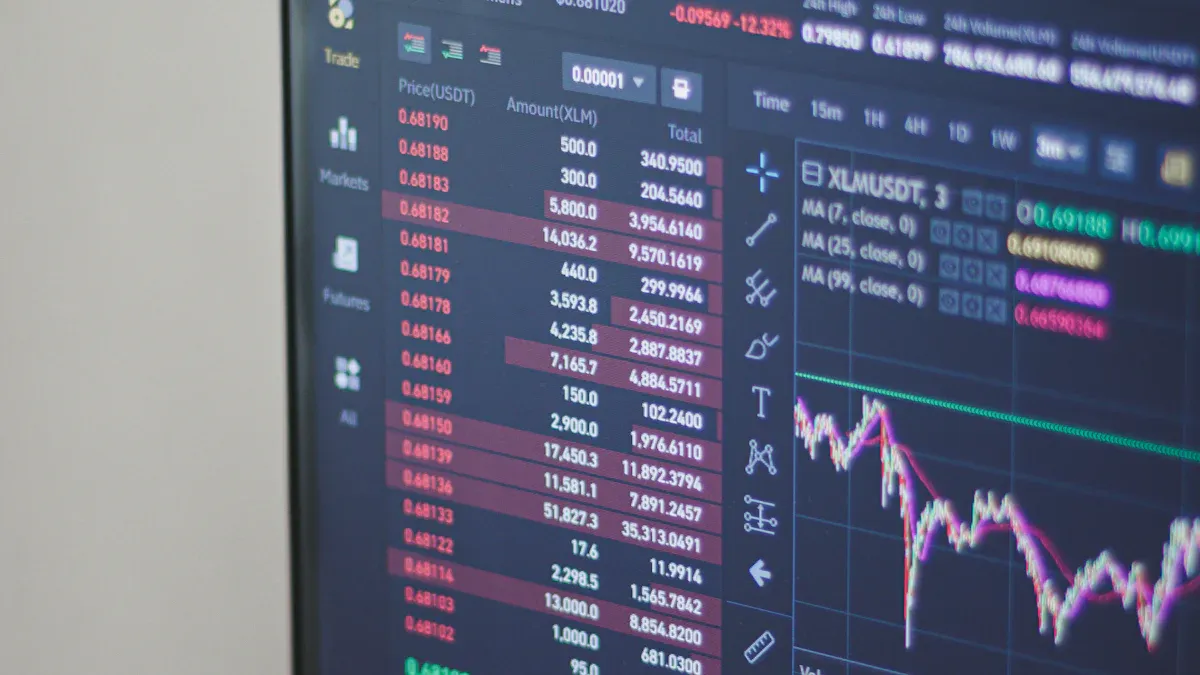
Image Source: unsplash
Diversification: Reducing Single-Asset Risk
Diversification is a critical strategy for addressing signs of a U.S. stock market bubble.
By spreading funds across different asset classes, you can effectively reduce the risk of a single asset. Stocks, bonds, gold, and cash each perform differently, and diversification can help you maintain stable returns during market volatility.
Here is the annual return data for various asset classes:
| Asset Class | Annual Return (%) |
|---|---|
| Stocks | 6.9 |
| Long-Term Treasury Bonds | 3.6 |
| Short-Term Treasury Bonds | 2.5 |
| Gold | 0.6 |
| U.S. Dollar Cash | -1.4 |
As shown in the table, stocks offer the highest annual returns but also carry higher risks. Gold and bonds, while yielding lower returns, perform more stably during market volatility. By rationally allocating these assets, you can achieve a better risk-return balance in different market environments.
Moreover, diversified investment strategies outperform single-market investments over the long term. Here is a comparison of diversified investment strategy returns versus the CSI 300 Index:
| Year | Strategy Return (%) | CSI 300 (%) |
|---|---|---|
| 2015 | 30.04 | 5.58 |
| 2016 | 14.64 | −11.28 |
| 2017 | 1.94 | 21.78 |
| 2018 | −0.84 | −25.31 |
| 2019 | 21.83 | 36.07 |
| 2020 | 6.70 | 27.21 |
| 2021 | 30.14 | −5.2 |
| 2022 | 9.56 | −24.11 |
| Cumulative Return | 168.03 | 64.93 |
The data shows that diversified investment strategies perform more stably in years of high market volatility. You can reduce risks and achieve long-term stable returns through diversification.
Focus on Defensive Sectors: Healthcare and Consumer Staples
During periods of heightened market volatility, defensive sectors typically perform better. Healthcare and consumer staples are two classic defensive sectors that can provide stable returns during economic slowdowns or stagflation.
Here is their historical performance:
- The best-performing sectors during stagflation include healthcare and consumer staples.
- According to EPFR Global data, funds flowed into defensive sectors like healthcare and consumer staples during significant equity fund outflows.
- Industry data since 1989 shows that defensive sectors like healthcare and consumer staples perform best during stagflation.
You can consider allocating a portion of your funds to these sectors to mitigate the impact of market volatility on your portfolio. For example, the demand for healthcare is generally unaffected by economic cycles, and consumer staples are essential daily products. These characteristics make them safe havens for investors during heightened economic uncertainty.
Using Hedging Mechanisms: Gold, Bonds, and Short-Selling Tools
Hedging mechanisms are another effective strategy for addressing signs of a U.S. stock market bubble. Gold, bonds, and short-selling tools can help protect your portfolio’s value during market corrections.
Gold is a traditional safe-haven asset. It typically performs well during heightened market volatility or rising inflation. Bonds offer stable returns with relatively low risk. You can choose long-term or short-term treasury bonds based on your risk tolerance.
Additionally, short-selling tools can help you profit during market downturns. For example, you can use inverse ETFs or options strategies to hedge risks. These tools can offer additional protection during market corrections.
Tip: When using hedging tools, you need to understand their risks and costs. For instance, short-selling tools may involve higher transaction fees, and gold price fluctuations can impact returns. Proper use of these tools can help maintain portfolio stability during market volatility.
Maintaining Cash Flow and Flexibility: Navigating Market Corrections
During periods of heightened market volatility, maintaining sufficient cash flow and flexibility is a vital strategy for protecting your portfolio. Cash flow is not only the lifeblood of business operations but also a critical tool for navigating market corrections. Flexibility allows you to quickly adjust your investment strategy, seize new opportunities, or mitigate potential risks.
Why Is Cash Flow Critical?
Free cash flow is a key indicator of a company’s profitability and financial health. It not only reflects the company’s actual earnings but also serves as a reference for your investment decisions. Here are the key roles of free cash flow:
- Profitability: Companies with high free cash flow typically have strong profitability, generating enough cash to meet capital expenditure needs.
- Financial Flexibility: Free cash flow provides companies with the ability to navigate market changes, such as through strategic investments or debt repayment.
- Investment Value: Investors often focus on free cash flow as it reflects a company’s actual profitability and potential shareholder returns.
When selecting investment targets, prioritize companies with ample free cash flow. These companies are more resilient during market corrections and better equipped to handle economic uncertainty.
How to Maintain Investment Flexibility?
Flexibility is another critical factor in navigating market corrections. Here are some practical suggestions to help you stay proactive:
- Maintain a Cash Reserve
Cash is the most flexible asset. During market corrections, sufficient cash reserves allow you to seize buying opportunities at low prices. It’s advisable to keep a portion of your portfolio in cash, especially when market valuations are high. - Regularly Evaluate Your Portfolio
Periodically review your portfolio’s performance to ensure it aligns with the current market environment and your investment goals. If certain assets carry excessive risk or underperform, adjust allocations promptly. - Focus on High-Liquidity Assets
Highly liquid assets are easier to liquidate during market volatility. For example, short-term treasury bonds and money market funds are relatively safe options. They carry low risk and can be quickly converted to cash when needed. - Avoid Over-Reliance on a Single Strategy
Market changes are hard to predict. Maintain a diverse set of strategies and avoid concentrating all funds in one asset or approach. Diversification reduces overall portfolio risk.
Tip: Flexibility is not only about asset allocation but also about mental preparedness. Market corrections may bring short-term losses, but staying calm and rational can lead to wiser decisions.
Long-Term Benefits of Cash Flow and Flexibility
Historical data shows that maintaining cash flow and flexibility can significantly reduce risks from market corrections.
Both companies and investors benefit:
- Companies enhance profitability and financial flexibility through free cash flow, better navigating economic volatility.
- Investors leverage flexible asset allocation and cash reserves to seize opportunities during market downturns, achieving long-term returns.
You can incorporate these strategies into your investment plan to better address future uncertainties. Cash flow and flexibility are not only short-term safeguards but also the cornerstone of long-term investment success.
Importance of Investor Psychology and Behavior
Avoiding Herd Mentality: Don’t Blindly Chase Highs
Herd mentality is a common behavioral trap for investors. Many people, seeing a rising market, rush to buy out of fear of missing out, often leading to buying at highs. However, this behavior can increase the risk of significant losses. Research shows that herd behavior is particularly pronounced in China’s securities market.
| Researcher | Research Focus | Conclusion |
|---|---|---|
| Song Jun, Wu Chongfeng | Empirical study on herd behavior of investment funds in China’s securities market | Found significant herd behavior in Chinese funds, more pronounced than in Western pension funds and mutual funds. |
| Lu Jianqing | Survey-based study of investor herd mentality | Classified investors into three types, revealing different manifestations of herd behavior. |
| Xia Yebei, Zhu Jianjun | Relationship between managerial reputation concerns and corporate investment herd behavior | Professional reputation concerns are a key driver of corporate investment herd behavior. |
You need to avoid herd mentality, especially during periods of market exuberance. Stick to independent thinking and make decisions based on data and analysis to minimize losses from chasing highs.
Staying Rational: Focus on Long-Term Goals and Fundamental Analysis
Market volatility can make you uneasy, but staying rational is key to successful investing. Focusing on long-term goals and fundamental analysis helps you find opportunities during market corrections. Here are some key points:
- Earnings growth prospects and valuations are the main factors influencing stock prices.
- Stocks favored by institutions often have stronger upward momentum.
- Relative industry price strength helps identify leading stocks, with rising sectors often harboring investment opportunities.
By focusing on these fundamental factors, you can better assess the value of investment targets, rather than being swayed by short-term market sentiment.
Controlling Emotions: Avoiding Panic Selling
During market downturns, panic selling is often the first reaction for many investors. However, this behavior typically leads to greater losses. Historical data shows that sharp market sentiment swings often accompany significant declines:
- The VIX fear index once surged 50% in a single day, hitting a multi-year high.
- CNN’s Fear & Greed Index once dropped to 4, indicating “extreme fear” in the market.
- Major U.S. stock indices fell over 5% amid panic sentiment, entering technical bear market territory.
In such situations, you need to control your emotions and avoid panic selling. Staying calm and returning to fundamental analysis can help you find better investment opportunities during market corrections.
Conclusion
The signs of a U.S. stock market bubble are evident, including market overheating, overvaluation, a disconnect from economic fundamentals, and overly optimistic investor sentiment. These risks could lead to sharp market volatility, causing significant losses for investors.
To address these challenges, you need to adopt prudent investment strategies. Diversification reduces the risk of single assets, while hedging tools like gold and bonds protect portfolio value during market corrections. Additionally, maintaining cash flow and flexibility allows you to adjust strategies quickly, seizing new investment opportunities.
Top economist David Rosenberg suggests that investors focus on defensive sectors like healthcare and consumer goods to mitigate potential market risks. He notes that rapid market upswings may lead to future crashes, making increased allocation to defensive stocks particularly important.
Here are some common signs of a bubble and corresponding investment strategy recommendations:
| Bubble Sign | Investment Strategy Recommendation |
|---|---|
| Market Overvaluation | Focus on healthcare, defensive stocks |
| Corporate Financial Misconduct | Focus on consumer staples, utility stocks |
| Rapid Investor Sentiment | Allocate to stocks with “insurance” characteristics |
Raising risk awareness, avoiding chasing highs, and focusing on long-term goals and fundamental analysis are key to protecting your investments in the current market environment. By adopting these prudent strategies, you can better navigate future uncertainties and achieve long-term investment success.
FAQ
1. How can I determine if the U.S. stock market is in a bubble?
You can observe market valuations, price-to-earnings (P/E) ratios, and cyclically adjusted P/E (CAPE) ratios. When these metrics are significantly above historical averages, the market may be in a bubble. Additionally, surging trading volumes, active speculative behavior, and overly optimistic investor sentiment are important signals.
Tip: Monitor the divergence between economic fundamentals and stock market performance to avoid following trends blindly.
2. How should investors handle market volatility?
Diversification is key. Allocate funds across stocks, bonds, gold, and other asset classes to reduce single-asset risk. Maintain a cash reserve to flexibly seize opportunities during market downturns, and adjust your portfolio periodically.
Recommendation: Regularly assess your portfolio to ensure alignment with market conditions and personal goals.
3. Why are defensive sectors safer during a bubble?
Defensive sectors like healthcare and consumer staples have stable demand, unaffected by economic cycles. During market volatility or economic slowdowns, these sectors typically perform more steadily, offering investors a higher margin of safety.
| Sector | Characteristics | Example Industries |
|---|---|---|
| Healthcare | Strong necessity, resilient to cycles | Pharmaceuticals, medical equipment |
| Consumer Staples | Essential daily needs, stable demand | Food, beverages |
4. Are short-selling tools suitable for retail investors?
Short-selling tools like inverse ETFs or options strategies are suitable for experienced investors. They can generate profits during market downturns but carry high risks and potential for significant losses. Retail investors should use them cautiously, fully understanding their mechanics and costs.
Note: Short-selling tools have high transaction fees and require close market monitoring.
5. How can I avoid investment mistakes driven by herd mentality?
Stick to independent thinking and make decisions based on data and fundamental analysis. Set clear investment objectives and avoid chasing highs driven by market euphoria. By studying historical cases, you can understand the dangers of herd mentality and enhance your judgment.
Reminder: When market sentiment is high, stay calm and analytical to avoid being swayed by FOMO (fear of missing out).
As signs of a U.S. stock market bubble emerge, high valuations and volatility demand agile, cost-effective investment strategies. BiyaPay empowers you with a seamless platform to navigate global markets like U.S. or Hong Kong stocks without needing overseas accounts. Convert over 30 fiat currencies with 200+ cryptocurrencies and access real-time fiat exchange rate tracking to manage currency risks, with transfer fees as low as 0.5% across 190+ countries for rapid fund deployment. Try BiyaPay now for secure, efficient transactions. Licensed by U.S. MSB and SEC, BiyaPay ensures trust and compliance. During market uncertainty, grow idle funds with a 5.48% APY flexible savings product, accessible anytime, aligning perfectly with dynamic market needs. Sign up with BiyaPay to safeguard and optimize your investments today!
*This article is provided for general information purposes and does not constitute legal, tax or other professional advice from BiyaPay or its subsidiaries and its affiliates, and it is not intended as a substitute for obtaining advice from a financial advisor or any other professional.
We make no representations, warranties or warranties, express or implied, as to the accuracy, completeness or timeliness of the contents of this publication.


Contact Us
Company and Team
BiyaPay Products
Customer Services


BIYA GLOBAL LLC is a licensed entity registered with the U.S. Securities and Exchange Commission (SEC No.: 802-127417); a certified member of the Financial Industry Regulatory Authority (FINRA) (Central Registration Depository CRD No.: 325027); regulated by the Financial Industry Regulatory Authority (FINRA) and the U.S. Securities and Exchange Commission (SEC).
BIYA GLOBAL LLC is registered with the Financial Crimes Enforcement Network (FinCEN), an agency under the U.S. Department of the Treasury, as a Money Services Business (MSB), with registration number 31000218637349, and regulated by the Financial Crimes Enforcement Network (FinCEN).
BIYA GLOBAL LIMITED is a registered Financial Service Provider (FSP) in New Zealand, with registration number FSP1007221, and is also a registered member of the Financial Services Complaints Limited (FSCL), an independent dispute resolution scheme in New Zealand.