- EasyCard
- Trade
- Help
- Announcement
- Academy
- SWIFT Code
- Iban Number
- Referral
- Customer Service
- Blog
- Creator
Latest Breakthroughs in the Dow Jones Industrial Index's Market Performance in 2025


Image Source: pexels
The Dow Jones Industrial Index may experience significant breakthroughs in 2025, driven by multiple economic and market factors. Recently, the index rose by 0.39%, reaching 42594.35 points, indicating positive changes in market sentiment. Meanwhile, progress in U.S.-China trade negotiations has further boosted investor confidence, although the potential impact of tariff policies still requires close attention. Despite rising unemployment claims and declining productivity posing some pressure, the robust performance of overall economic data provides strong support for the index. These indicators suggest that the market is moving toward a more optimistic direction.
Key Takeaways
- The Dow Jones Industrial Index may see significant breakthroughs in 2025, driven by economic recovery and policy adjustments.
- Investors should focus on key economic indicators, such as employment data and the Consumer Price Index, to gauge market trends.
- Diversified investment is an effective strategy to reduce risk and enhance portfolio stability.
- Technical analysis tools can help investors identify market trends and optimize investment decisions.
- Geopolitical events may cause market volatility, and investors should remain calm, avoiding emotional decisions.
Global Economic and Market Background in 2025
Image Source: pexels
Main Trends in Global Economic Recovery
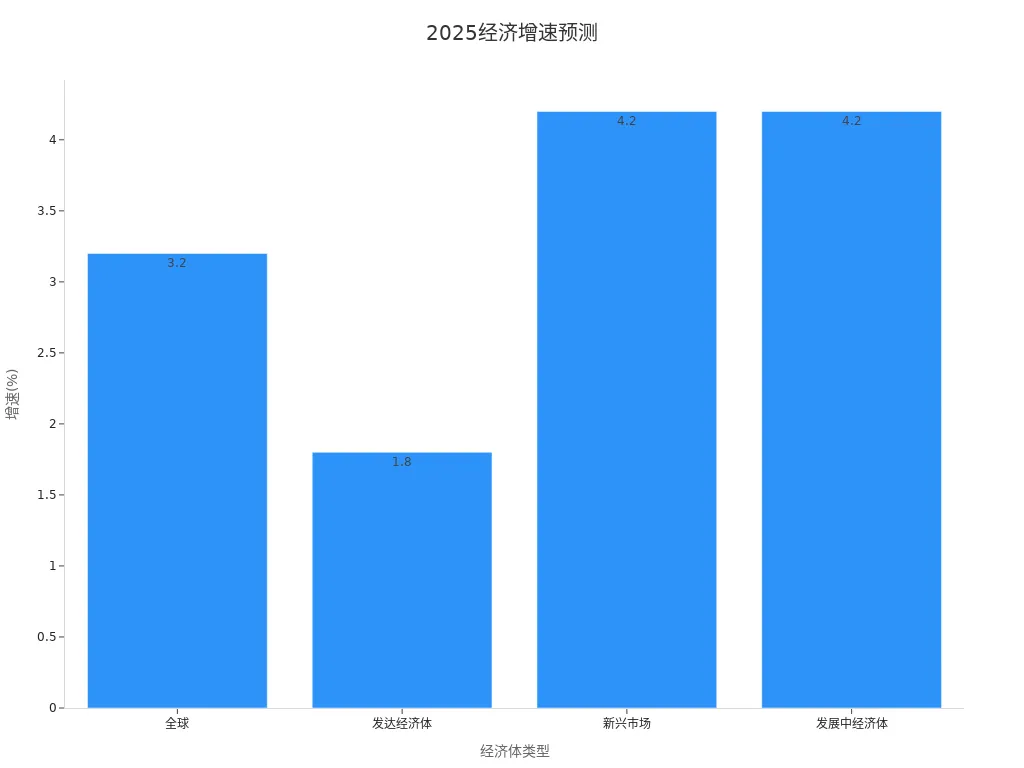
In 2025, global economic recovery shows diverse trends. According to forecasts, global economic growth will reach 3.2%, with developed economies growing at 1.8% and emerging markets and developing economies both at 4.2%. The following are specific data:
| Economy Type | 2025 Growth Forecast |
|---|---|
| Global | 3.2% |
| Developed Economies | 1.8% |
| Emerging Markets | 4.2% |
| Developing Economies | 4.2% |
Manufacturing and infrastructure investment are key pillars of economic recovery. Although slowing export growth may impact manufacturing investment to some extent, fiscal policy support will drive rapid development in equipment upgrades and infrastructure projects. Additionally, global inflation levels are gradually declining, expected to drop from 6.7% in 2023 to 5.8% in 2024, creating a more stable environment for economic recovery.
Performance of Core U.S. Economic Indicators
The U.S. economy in 2025 demonstrates steady growth momentum. Non-farm payroll data performed strongly, with 139,000 jobs added in May, exceeding expectations of 130,000, highlighting the vitality of the labor market. Additionally, the Consumer Price Index (CPI) is expected to rise from 2.3% to 2.5%, and the core CPI inflation indicator will increase from 2.8% to 2.9%. These data indicate that domestic demand and consumption capacity in the U.S. economy remain robust, providing solid support for the market.
Financial Market Volatility and Investor Sentiment
Financial market volatility in 2025 may be influenced by multiple factors, including geopolitical events and monetary policy adjustments. However, investor sentiment is generally optimistic. The Manufacturing Purchasing Managers’ Index (PMI) remains in the expansion zone at 50.5%, further boosting market confidence. Meanwhile, GDP grew by 5.4% year-over-year, the urban surveyed unemployment rate dropped to 5.3%, and total retail sales of consumer goods increased by 4.6%. These indicators collectively reflect sustained economic recovery and market stability.
Key Drivers of the Dow Jones Industrial Index

Image Source: pexels
Impact of Economic Data on the Market
Economic data is one of the key factors influencing the Dow Jones Industrial Index. In 2025, several critical indicators show strong economic recovery, providing positive signals for the market:
- The PMI (Purchasing Managers’ Index) rose to 54.4, marking the highest level since April 2022, indicating continued expansion in manufacturing activity.
- The labor market performed strongly, with initial jobless claims dropping by 8,000, the largest consecutive decline since September last year, demonstrating the resilience of the labor market.
These data indicate that the fundamentals of the U.S. economy remain solid, providing strong support for the Dow Jones Industrial Index’s upward movement. Investors typically view these indicators as a barometer of market health, adjusting their investment strategies accordingly.
Role of Federal Reserve Policy and Interest Rate Adjustments
The Federal Reserve’s monetary policy has a profound impact on the Dow Jones Industrial Index’s trajectory. In 2025, the Fed has adopted a more cautious approach to interest rate adjustments to balance economic growth and inflationary pressures.
Interest rate changes directly affect corporate borrowing costs and consumer lending capacity. When interest rates fall, corporate operating costs decrease, profitability improves, and the stock market typically receives a boost. Conversely, when interest rates rise, the market may face pressure. In 2025, the Fed’s policy statements indicate it will maintain interest rates at relatively low levels to support economic recovery. This policy provides a stable growth environment for the Dow Jones Industrial Index.
Additionally, investors closely monitor each Fed policy meeting and statement, as these often trigger short-term market fluctuations.
Market Impact of Geopolitical Events
The impact of geopolitical events on the market is often unpredictable, yet their influence cannot be ignored. Historical data shows that major geopolitical events typically trigger significant market volatility. For example:
| Evidence Type | Description |
|---|---|
| Event Dataset | Acadian Asset Management’s event dataset includes over 2,600 geopolitical shocks affecting 72 countries from 1928 to 2015. |
| Research Findings | Studies suggest that diversified investors without information advantages should remain in the market rather than quickly reducing holdings or liquidating positions. |
| Event Characteristics | Focus on unplanned, reasonably characterized but unforeseen events, such as coups, revolutions, and civil unrest. |
In 2025, global geopolitical risks persist, including U.S.-China trade negotiations, the European energy crisis, and geopolitical tensions in the Asia-Pacific region. These events may lead to sharp short-term market fluctuations, but in the long term, markets typically stabilize gradually.
Investors facing geopolitical risks should avoid emotional decisions and maintain portfolio diversification to reduce potential losses.
Reference to Technical Analysis and Historical Trends
Technical analysis plays a significant role in predicting the future trajectory of the Dow Jones Industrial Index. By analyzing historical data and market trends, investors can better understand market behavior and develop effective investment strategies. The following are commonly used technical analysis methods and their applications in market forecasting:
- General Analysis Techniques: Utilize data processing tools (e.g., SQL EM, CLEMATINE) for deep mining of historical data. These tools can identify sensitive events in the market and help investors pinpoint critical market change points. For example, analyzing market fluctuations over the past decade reveals that the Dow Jones Industrial Index typically exhibits higher growth potential during economic recovery periods.
- Outlier Detection Techniques: Use Python algorithm packages or C++ programming tools to analyze anomalies in data. These techniques help investors identify potential risks in the market. For instance, a sudden surge in trading volume for certain stocks may signal an impending significant market change.
- Real-Time Data Monitoring: Build real-time data monitoring systems using tools like SAS Base. These systems can dynamically analyze market trends and issue early warning signals. For example, when technical indicators (e.g., RSI or MACD) reach critical levels, the system can alert investors to take corresponding actions.
Analysis of historical trends also provides valuable references for market forecasting. Historical data for the Dow Jones Industrial Index shows that the index typically experiences prolonged rallies during economic expansion periods, while it may face significant volatility during recessions. For example, after the 2008 financial crisis, the index saw a notable recovery over the subsequent decade, offering important insights for current market forecasts.
Additionally, technical analysis emphasizes attention to key indicators, such as Moving Averages (MA), Relative Strength Index (RSI), and Bollinger Bands. These indicators help investors assess whether the market is overbought or oversold, optimizing investment decisions.
Tip: Technical analysis is not a foolproof tool; its effectiveness depends on data accuracy and the scientific rigor of analytical methods. Investors should combine fundamental analysis with market dynamics for a comprehensive risk assessment.
By integrating technical analysis with historical trends, investors can gain a more comprehensive understanding of market behavior. This approach not only improves the accuracy of market forecasts but also provides clearer decision-making guidance for investors.
Market Forecast for the Dow Jones Industrial Index
Short-Term Price Range and Volatility Trends
In 2025, the short-term price range and volatility trends of the Dow Jones Industrial Index will be influenced by multiple factors. Real-time data and statistical models play a crucial role in predicting short-term market fluctuations. The following are commonly used forecasting methods:
- Adaptive Learning Strategies: Dynamically adjust model parameters to adapt to rapid market changes.
- Reinforcement Learning Framework: Optimize trading strategies using historical data and real-time feedback.
- Real-Time Mid-Price Prediction in High-Frequency Trading: Capture short-term market fluctuations by analyzing high-frequency data.
These methods help investors predict short-term market trends more accurately. For example, using high-frequency trading data can identify subtle market changes, enabling more precise investment decisions.
Historical data shows that the Dow Jones Industrial Index often experiences significant volatility in the early stages of economic recovery. This volatility reflects the market’s sensitivity to economic data and policy changes. In 2025, as Federal Reserve policies become clearer and economic data continues to improve, short-term volatility in the index may stabilize. However, investors should remain vigilant about the short-term impact of geopolitical events and unexpected economic data on the market.
Tip: While short-term volatility is difficult to predict entirely, combining technical analysis with real-time data allows investors to better seize market opportunities.
Long-Term Trend Outlook and Potential Breakthrough Points
In the long term, the performance of the Dow Jones Industrial Index will be profoundly influenced by global economic and technological developments. The following are key long-term trends:
- Global Economic Growth Slowdown, potentially entering a phase of low-to-medium growth in the future.
- Aging populations and declining birth rates intensify, with fertility rates continuing to fall.
- Technological development focuses on digitalization and decarbonization, with information technology and green tech becoming primary areas of innovation.
Based on current international economic, political, and social trends, a slowdown in global economic growth is almost inevitable. High inflationary pressures and tightening monetary policies may have negative spillover effects on the global economy. Additionally, demographic changes will profoundly impact economic growth and consumption patterns.
Technological innovation provides new growth momentum for the market. Rapid advancements in digital transformation and green technology will drive stock performance in related sectors. For example, companies in renewable energy and artificial intelligence may become key drivers of future breakthroughs in the Dow Jones Industrial Index.
Historical data shows that the index typically experiences prolonged rallies during economic expansion periods. For instance, after the 2008 financial crisis, the index achieved significant growth over the subsequent decade. This trend provides important reference points for long-term forecasts in 2025.
Potential Risks and Uncertainties
Despite an overall optimistic market outlook, investors must remain attentive to potential risks and uncertainties. The following are key factors that may affect the Dow Jones Industrial Index:
- Geopolitical Risks: U.S.-China trade negotiations, the European energy crisis, and tensions in the Asia-Pacific region could significantly impact the market.
- Monetary Policy Changes: Federal Reserve interest rate adjustments and policy statements may trigger short-term market fluctuations.
- Economic Data Volatility: Unexpected changes in employment data, inflation rates, and GDP growth could lead to sharp shifts in market sentiment.
Additionally, while technical analysis tools offer predictive capabilities, their effectiveness depends on data accuracy and market stability. In highly volatile environments, the reliability of technical analysis may be challenged.
When formulating strategies, investors should consider these risk factors comprehensively and maintain portfolio diversification. By monitoring market dynamics and key economic indicators, investors can better navigate uncertainties and reduce potential losses.
Recommendation: In high-uncertainty market environments, investors should avoid over-concentration of investments and prioritize sectors and companies with stable growth potential.
Investment Strategy Recommendations
Focus on Key Economic Indicators and Policy Signals
When formulating strategies, investors should prioritize key economic indicators and policy signals. These data help investors gauge market trends and optimize decisions. The following are economic indicators with high success rates:
| Economic Indicator | Success Rate | Outperformance vs. CSI 300 Median |
|---|---|---|
| Low P/E and Low P/B Stocks | >57% | 4.61% |
| Dividend Yield Above 30% with Low Valuation | >59% | 6.61% |
| Debt-to-Asset Ratio Below 50% and ROE Above 10% | ~58% | 7.65% |
| Market Value Below Discounted Free Cash Flow | 68% | N/A |
Additionally, the true value of low-valuation stocks should be assessed from three perspectives: liquidation value, free cash flow, and enterprise multiples. Industries with high success rates include non-ferrous metals (77%), pharmaceuticals (75%), telecommunications (75%), and media (73%). These data indicate that focusing on economic indicators not only improves investment success rates but also helps investors identify opportunities with potential in the market.
Diversify Investments to Reduce Risk
Diversified investment is an effective strategy to reduce risk. By allocating funds across different asset classes and industries, investors can mitigate the impact of single-market fluctuations on their portfolios. The following are the main advantages of diversified investment:
- Reduces exposure to single-asset risks.
- Enhances portfolio stability.
- Strengthens resilience to market volatility.
For example, in environments with high geopolitical risks, investors can diversify funds into sectors like energy, technology, and healthcare. These industries typically have strong risk resistance and can maintain stable growth during market fluctuations. Diversified investment not only protects investors’ capital but also provides assurance for long-term returns.
Leverage Technical Analysis Tools to Optimize Decisions
Technical analysis tools provide investors with powerful market insights. These tools help investors understand market trends, optimize business processes, and develop more precise investment strategies. The following are the main applications of technical analysis:
- Market Trend Analysis: Identify market development directions and competitive dynamics.
- Customer Insights: Analyze customer behavior and preferences to support personalized marketing.
- Predictive Analytics: Forecast market demand and sales performance to help businesses adapt to changes.
For example, by using real-time data monitoring systems, investors can quickly capture short-term market fluctuations and adjust investment strategies. Technical analysis also helps investors identify potential risks, such as abnormal changes in trading volume or critical points in technical indicators. By combining these tools, investors can significantly improve decision-making accuracy and optimize investment returns.
Tip: The effectiveness of technical analysis tools depends on data quality and the scientific rigor of analytical methods. Investors should combine fundamental analysis with market dynamics for a comprehensive assessment to optimize decisions.
The Dow Jones Industrial Index may experience significant breakthroughs in 2025. Economic recovery and policy adjustments provide strong momentum for the market. Investors should closely monitor market dynamics, particularly key economic indicators and policy changes. Flexible investment strategies can effectively address potential risks. In the future, the index’s performance will continue to serve as a key barometer of global economic health, offering valuable guidance for investors.
FAQ
What is the Dow Jones Industrial Index?
The Dow Jones Industrial Index is a key indicator of the U.S. stock market, consisting of 30 large publicly traded companies. These companies span multiple industries, reflecting the overall performance of the U.S. economy. Investors typically view it as a barometer of market health.
What are the main drivers of the Dow Jones Industrial Index in 2025?
In 2025, the main drivers of the Dow Jones Industrial Index include economic data, Federal Reserve policy adjustments, geopolitical events, and technical analysis signals. These factors collectively influence market sentiment and investor decisions.
How can investors address market volatility?
Investors can reduce risk through diversified investments, focus on key economic indicators and policy signals, and leverage technical analysis tools to optimize decisions. These methods help investors achieve stable returns in volatile markets.
What is the role of technical analysis in predicting market trends?
Technical analysis studies historical data and market trends to help investors identify potential opportunities and risks. Common tools include Moving Averages, Relative Strength Index, and Bollinger Bands. These indicators provide references for overbought or oversold market conditions.
How do geopolitical events affect the Dow Jones Industrial Index?
Geopolitical events, such as U.S.-China trade negotiations or the European energy crisis, may cause short-term market volatility. Investors should avoid emotional decisions and maintain portfolio diversification to mitigate potential losses.
The Dow Jones Industrial Average (DJIA) is poised for breakthroughs in 2025, closing at 21.65 USD on July 10, driven by economic recovery and progress in U.S.-China trade talks, with opportunities amid market volatility. BiyaPay offers a seamless financial platform, enabling trading in U.S. and Hong Kong stocks without offshore accounts, helping you leverage USD, HKD, and other assets to capture DJIA’s growth potential.
Supporting 30+ fiat and digital currencies with real-time exchange rate transparency, plus global remittances to 190+ countries with remittance fees as low as 0.5%. A 5.48% annualized yield savings product with no lock-in period ensures flexibility. Sign up for BiyaPay today to combine DJIA trends with BiyaPay’s versatile tools for efficient, secure investments!
*This article is provided for general information purposes and does not constitute legal, tax or other professional advice from BiyaPay or its subsidiaries and its affiliates, and it is not intended as a substitute for obtaining advice from a financial advisor or any other professional.
We make no representations, warranties or warranties, express or implied, as to the accuracy, completeness or timeliness of the contents of this publication.


Contact Us
Company and Team
BiyaPay Products
Customer Services


BIYA GLOBAL LLC is a licensed entity registered with the U.S. Securities and Exchange Commission (SEC No.: 802-127417); a certified member of the Financial Industry Regulatory Authority (FINRA) (Central Registration Depository CRD No.: 325027); regulated by the Financial Industry Regulatory Authority (FINRA) and the U.S. Securities and Exchange Commission (SEC).
BIYA GLOBAL LLC is registered with the Financial Crimes Enforcement Network (FinCEN), an agency under the U.S. Department of the Treasury, as a Money Services Business (MSB), with registration number 31000218637349, and regulated by the Financial Crimes Enforcement Network (FinCEN).
BIYA GLOBAL LIMITED is a registered Financial Service Provider (FSP) in New Zealand, with registration number FSP1007221, and is also a registered member of the Financial Services Complaints Limited (FSCL), an independent dispute resolution scheme in New Zealand.