- EasyCard
- Trade
- Help
- Announcement
- Academy
- SWIFT Code
- Iban Number
- Referral
- Customer Service
- Blog
- Creator
Top U.S. Stock ETF Recommendations: 2025 Investment Guide


Image Source: pexels
In 2025, the U.S. stock ETF market continues to attract the attention of global investors. The following are some popular ETFs worth your close attention, particularly recommended U.S. stock ETFs:
- Vanguard S&P 500 ETF (VOO): Tracks the S&P 500 index, including tech giants like Apple, Amazon, and Microsoft, showing strong growth potential.
- SPDR S&P 500 ETF Trust (SPY): Known for its stability and broad coverage, it is a top choice for many investors.
- Schwab U.S. Dividend Equity ETF (SCHD): Offers high dividend yields, suitable for investors seeking stable cash flow.
- Invesco QQQ Trust (QQQ): Focuses on the Nasdaq 100 index, targeting growth in the tech sector.
- Vanguard Dividend Appreciation ETF (VIG): Aims for long-term dividend growth, ideal for long-term investment strategies.
- iShares Core S&P Mid-Cap ETF (IJH): Covers mid-cap companies, offering growth potential and risk diversification.
These ETFs not only allow wealth accumulation through dollar-cost averaging during market pullbacks but also demonstrate high cost-effectiveness due to low expense ratios (e.g., SPLG’s 0.020%). By choosing these popular ETFs, you can seize market growth opportunities while enjoying stable returns, making them highly recommended U.S. stock ETFs.
Key Takeaways
- Selecting Vanguard S&P 500 ETF (VOO) and SPDR S&P 500 ETF Trust (SPY) can provide stable long-term growth, suitable for investors seeking low risk.
- Invesco QQQ Trust (QQQ) focuses on the tech sector, ideal for investors looking to capitalize on tech development opportunities with high growth potential.
- High-dividend ETFs like Schwab U.S. Dividend Equity ETF (SCHD) and Vanguard Dividend Appreciation ETF (VIG) offer ideal choices for investors seeking stable cash flow.
- Dollar-cost averaging helps diversify risk across different market environments, reducing investment costs, suitable for long-term investors.
- Diversifying investments across different asset classes and industries can effectively reduce overall investment risk, ensuring portfolio stability.
2025 Top U.S. Stock ETF Recommendations

Image Source: pexels
Vanguard S&P 500 ETF (VOO)
Vanguard S&P 500 ETF (VOO) is one of the classic ETFs tracking the S&P 500 index. It includes the 500 largest U.S. companies by market capitalization, such as Apple, Microsoft, and Amazon. These companies span multiple sectors, including technology, finance, and healthcare, providing broad market representation. VOO’s expense ratio is only 0.03%, making it highly competitive among similar ETFs. For investors seeking long-term stable growth, VOO is an ideal choice.
Another advantage of VOO is its liquidity. In 2025, VOO’s average daily trading volume is expected to remain at a high level, meaning you can easily buy or sell without worrying about liquidity issues. Additionally, VOO’s historical performance is impressive, with an annualized return of nearly 10% over the past decade. If you’re looking for a low-risk, high-stability U.S. stock ETF recommendation, VOO is undoubtedly a worthy option.
Invesco QQQ Trust (QQQ)
Invesco QQQ Trust (QQQ) focuses on the Nasdaq 100 index, primarily covering leading companies in technology, communications, and consumer sectors. QQQ’s holdings include tech giants like Tesla, Google, and Meta, which have significant advantages in innovation and growth. In 2025, with the rapid development of artificial intelligence, cloud computing, and 5G technologies, QQQ’s growth potential remains robust.
QQQ’s expense ratio is 0.20%, slightly higher than VOO, but its high growth potential compensates for this. For investors looking to seize opportunities in the tech sector, QQQ is a highly noteworthy U.S. stock ETF recommendation. Additionally, according to market data, QQQ’s trading volume ranks among the top ETFs, ensuring investment flexibility.
| ETF Name | Description |
|---|---|
| Vanguard Total World Stock ETF | Global stock ETF |
| Health Care Select Sector SPDR ETF | Healthcare select ETF |
| Financial Select Sector SPDR ETF | Financial sector select ETF |
| Consumer Staples Select Sector SPDR ETF | Consumer staples select ETF |
| Vanguard Information Technology ETF | Information technology ETF |
| Invesco QQQ ETF | Nasdaq 100 tech stock ETF |
As shown in the table, QQQ holds a prominent position in the tech sector. If you’re interested in the tech industry, QQQ is a must-consider choice.
iShares Core S&P Mid-Cap ETF (IJH)
iShares Core S&P Mid-Cap ETF (IJH) focuses on mid-cap companies, tracking the S&P MidCap 400 index. Compared to large-cap stocks, mid-cap stocks typically offer higher growth potential while maintaining relatively lower risk. IJH’s holdings include mid-cap companies across industries such as industrials, consumer goods, and healthcare, with this diversified allocation helping to spread investment risk.
IJH’s expense ratio is 0.05%, which is low among mid-cap ETFs. In 2025, as the U.S. economy continues to recover, mid-cap companies may see more development opportunities. For investors seeking a balance between stability and growth, IJH is a noteworthy U.S. stock ETF recommendation.
Additionally, IJH’s liquidity is excellent. According to market data, IJH’s average daily trading volume ranks among the top mid-cap ETFs. This means you can quickly buy or sell when needed without significantly impacting market prices.
SPDR S&P 500 ETF Trust (SPY)
SPDR S&P 500 ETF Trust (SPY) is the world’s first ETF and remains one of the largest and most liquid ETFs today. It tracks the S&P 500 index, covering the 500 largest U.S. companies by market capitalization, including industry giants like Apple, Microsoft, and Google. SPY’s broad coverage makes it a core investment tool for many investors.
SPY’s expense ratio is 0.0945%, slightly higher than VOO, but its exceptional liquidity compensates for this. In 2025, SPY’s average daily trading volume is expected to remain high, meaning you can buy or sell at any time without significantly affecting market prices. For investors seeking comprehensive market exposure through a single ETF, SPY is a highly worthy choice.
Moreover, SPY’s historical performance is very stable, with its annualized return closely aligned with the S&P 500 index over the past decade. Whether for long-term investing or short-term trading, SPY meets your needs. If you’re looking for a low-risk, high-liquidity U.S. stock ETF recommendation, SPY is an ideal option.
Tip: SPY is suitable for investors who want to cover the entire U.S. stock market with a single investment tool. Its high liquidity and stability make it a core component of many portfolios.
Vanguard Dividend Appreciation ETF (VIG)
Vanguard Dividend Appreciation ETF (VIG) focuses on companies with a history of long-term dividend growth. It tracks the Nasdaq U.S. Dividend Achievers Select Index, with holdings including well-known companies like Johnson & Johnson, Coca-Cola, and Procter & Gamble. These companies typically have stable cash flows and strong profitability, maintaining resilience during economic fluctuations.
VIG’s expense ratio is only 0.06%, among the lowest in its category. In 2025, as demand for stable income grows among investors, VIG’s appeal will further increase. For investors aiming to accumulate wealth through dividend growth, VIG is a highly noteworthy U.S. stock ETF recommendation.
Another advantage of VIG is its low risk. Due to its focus on financially sound companies, VIG tends to exhibit greater resistance to declines during market downturns. If you seek long-term stable investment returns, VIG is a very suitable choice.
Tip: VIG is particularly suitable for investors seeking passive income through dividend growth. Its low expense ratio and stability make it an ideal tool for long-term investing.
Schwab U.S. Dividend Equity ETF (SCHD)
Schwab U.S. Dividend Equity ETF (SCHD) targets high dividend yields, tracking the Dow Jones U.S. Dividend 100 Index. Its holdings include high-dividend companies like PepsiCo, Texas Instruments, and Home Depot. These companies not only provide stable cash flows but also have growth potential.
SCHD’s expense ratio is only 0.06%, making it highly competitive among high-dividend ETFs. In 2025, as interest rate environments shift, high-dividend stocks may attract more investor attention. SCHD’s high dividend yield makes it an ideal choice for investors seeking stable cash flow.
Another highlight of SCHD is its high diversification. Its holdings span multiple industries, including consumer goods, finance, and industrials. This diversified allocation helps reduce investment risk. If you aim to achieve stable income through high dividends while diversifying risk, SCHD is a highly worthy U.S. stock ETF recommendation.
Recommendation: SCHD is suitable for investors seeking stable cash flow through high dividends. Its low expense ratio and diversified allocation make it a highly cost-effective choice.
Analysis of Recommendation Reasons
Growth Potential of the Tech Sector
The tech sector has long been a key driver of global economic growth. In 2025, with the rapid development of technologies like artificial intelligence, cloud computing, and the Internet of Things, the investment potential of the tech sector is even more pronounced. You may wonder how the tech sector’s growth directly impacts investment returns. The following data provides answers:
| Metric | Value |
|---|---|
| FinTech ETF Return Rate | 41.01% |
| One-Month Return Rate | 3.33% |
As shown in the table, tech-related ETFs have significantly higher returns than many traditional sectors. Additionally, market forecasts indicate that the market size and sales of the tech sector will continue to grow in the coming years, particularly in cloud data centers and information technology. ETFs like Invesco QQQ Trust (QQQ), which focus on leading tech companies, can help you capitalize on this growth trend.
Tip: When investing in tech sector ETFs, pay attention to market size forecasts and changes in companies’ market share to better seize investment opportunities.
Policy Support and Market Demand for Clean Energy
The clean energy sector has been driven by both policy and market forces in recent years. Governments worldwide have introduced policies to support clean energy development. For example, China added 5.75GW of energy storage capacity from January to April 2024, a 66.95% year-on-year increase. The following are key data points:
- In April 2024, newly installed capacity was 1.98MW, up 31.66% year-on-year and 225.84% month-on-month.
- Newly installed capacity was 6.54GWh, up 90.39% year-on-year and 392.98% month-on-month.
Policy support is also reflected in long-term planning. For instance, the 2021 “Opinions on Carbon Peaking and Carbon Neutrality” clearly outlined actions to accelerate the development of new energy and clean energy vehicles and ships. These policies provide a stable growth environment for the clean energy sector. The rapid growth in market demand further reflects the investment potential of clean energy. ETFs like iShares Global Clean Energy ETF (ICLN), focused on the clean energy sector, allow you to participate in this green revolution.
Recommendation: When choosing clean energy ETFs, pay attention to policy releases and market demand changes to better evaluate investment value.
Long-Term Stability of the Healthcare Sector
The healthcare sector is renowned for its counter-cyclical nature and stability. Regardless of economic conditions, demand for healthcare services persists. In 2025, with global population aging and advancements in medical technology, investment opportunities in the healthcare sector are even more prominent.
Healthcare-related ETFs, such as Health Care Select Sector SPDR ETF (XLV), typically hold industry giants like Johnson & Johnson and Pfizer. These companies have stable cash flows and strong R&D capabilities, maintaining resilience during market fluctuations. The healthcare sector’s long-term stability makes it an essential part of investment portfolios.
Tip: If you seek stable investment returns, healthcare sector ETFs are a worthy consideration.
Low Risk and Steady Returns of Large-Cap Index ETFs
Large-cap index ETFs, with their low risk and stable returns, are a top choice for many investors. They track the largest companies by market capitalization, offering broad coverage and effective risk diversification. For those seeking stable returns, large-cap index ETFs are a noteworthy option.
The following historical data supports the low risk and stable returns of large-cap index ETFs:
- Low-risk strategies outperform high-risk strategies, with higher risk-adjusted returns.
- Historical data shows that low-risk assets perform well across multiple countries and asset classes.
- Even in out-of-sample tests, low-risk strategies demonstrate stability and effectiveness.
These data confirm that large-cap index ETFs are suitable for long-term investing and offer some protection during market volatility. ETFs like Vanguard S&P 500 ETF (VOO) and SPDR S&P 500 ETF Trust (SPY) track the S&P 500 index, covering giants like Apple and Microsoft. These companies typically have stable profitability and strong risk resistance, providing a solid foundation for your portfolio.
Tip: If you seek low risk and stable returns, consider large-cap index ETFs as core investment tools.
Yield Advantages of High-Dividend ETFs
High-dividend ETFs, with their stable cash flows and risk resistance, attract many income-focused investors. They typically hold stocks of companies with high dividend yields, which demonstrate greater resilience during market volatility. For those seeking passive income through dividends, high-dividend ETFs are an ideal choice.
The following highlight the yield advantages of high-dividend ETFs:
- In quarterly and annual data, high-dividend ETFs demonstrate stable cash flows.
- During heightened market volatility, high-dividend sectors offer better protection for investors.
- Historical data shows that high-dividend sectors often outperform other sectors.
For example, Schwab U.S. Dividend Equity ETF (SCHD) and Vanguard Dividend Appreciation ETF (VIG) are two highly popular high-dividend ETFs. SCHD tracks the Dow Jones U.S. Dividend 100 Index, with holdings including PepsiCo and Home Depot. VIG focuses on companies with long-term dividend growth, such as Johnson & Johnson and Procter & Gamble. These ETFs not only provide stable cash flows but also have growth potential.
Recommendation: When choosing high-dividend ETFs, focus on the dividend policies and financial health of their holdings to better assess investment value.
How to Choose the Right ETF for You
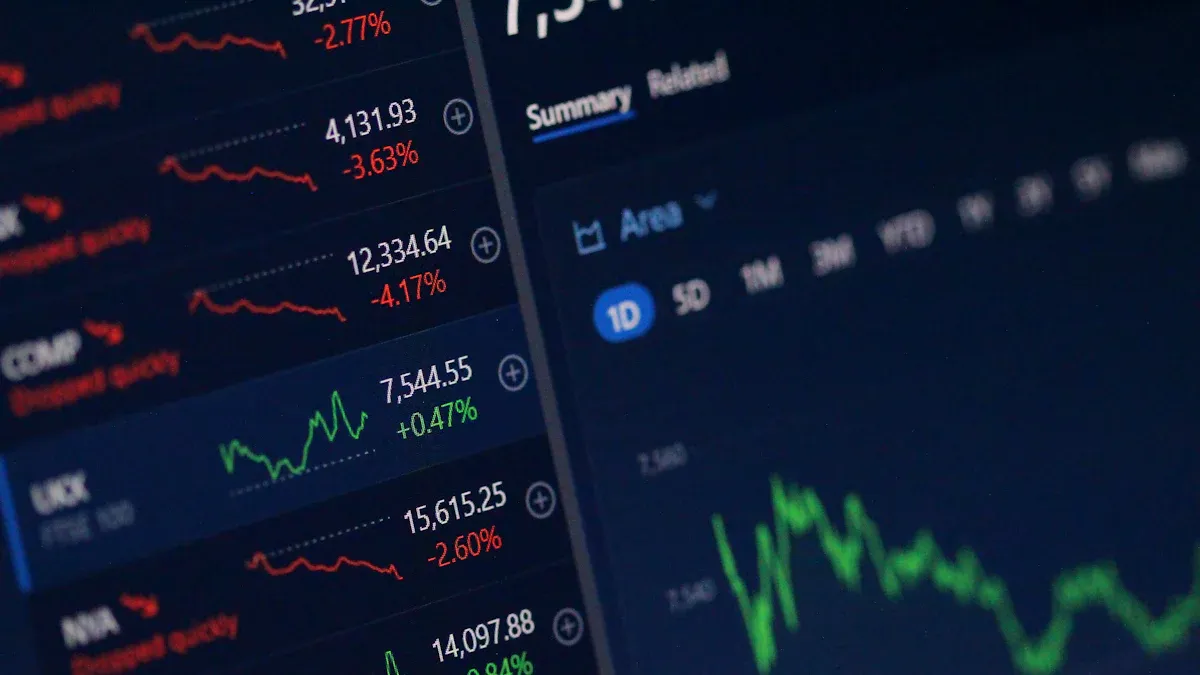
Image Source: unsplash
Choosing the right ETF is a critical step toward investment success. You need to comprehensively evaluate factors such as your investment goals, risk tolerance, and the ETF’s expense ratio. The following provides specific guidance to help you make informed choices.
Choosing Based on Investment Goals
Your investment goals determine which type of ETF you should select. If your goal is long-term wealth accumulation, consider ETFs tracking large-cap indices, such as Vanguard S&P 500 ETF (VOO). If you focus on short-term gains or growth potential in specific sectors, tech ETFs like Invesco QQQ Trust (QQQ) may be more suitable.
When selecting ETFs, you can refer to the following market statistics to evaluate whether they align with your investment goals:
- Liquidity: High-liquidity ETFs are easier to buy and sell, suitable for short-term traders.
- Transaction Costs: Low transaction costs are better for long-term investors.
- Policy Risks: Some sector ETFs may be affected by policy changes, such as clean energy ETFs.
- Fund Size: Larger ETFs are generally more stable, suitable for conservative investors.
- Tracking Error: ETFs with smaller tracking errors more accurately reflect the performance of their underlying index.
- Expense Ratio: Low expense ratios reduce investment costs and increase net returns.
Data shows that the GARCH (1,1) model demonstrates quantifiable value in investment strategies and can help screen ETFs that match objectives. The table presents its core performance:
| Model | Out-of-Sample Returns | Conditional Sharpe Ratio (Rebalancing Strategy) | Conditional Sharpe Ratio (Buy-and-Hold Strategy) |
|---|---|---|---|
| GARCH (1,1) | High | 29% | 25% |
As shown in the table, the GARCH (1,1) model has clear data support in both “Rebalancing Strategy” and “Buy-and-Hold Strategy”. Combined with investment logic, choosing the right strategy and ETF type can significantly boost returns. This model can serve as a practical reference (Note: Other models cannot be compared due to missing data and require further data supplementation for analysis).
Assessing Risk Tolerance
Every investor has a different risk tolerance. You need to evaluate the suitable ETF type based on your financial situation, investment experience, and psychological resilience. If you prefer low-risk investments, choose large-cap index ETFs like SPDR S&P 500 ETF Trust (SPY). If you’re willing to take higher risks for greater potential returns, consider mid-cap or tech ETFs like iShares Core S&P Mid-Cap ETF (IJH) or QQQ.
The following are key metrics to assess ETF risks:
- Tracking Deviation: Reflects the performance difference between the ETF and its underlying index; lower deviation indicates lower risk.
- Tracking Error: Measures the daily return volatility difference between the ETF and its index; smaller errors indicate greater stability.
- Liquidity: High-liquidity ETFs are easier to trade during market volatility, reducing liquidity risk.
By analyzing these metrics, you can better understand an ETF’s risk level and choose products that match your risk tolerance.
Tip: When assessing risk, consider your investment goals and time horizon. If your investment period is longer, you can afford to take on more risk for higher potential returns.
Focusing on ETF Expense Ratios
The expense ratio is a critical factor to consider when choosing an ETF. It directly affects your investment returns. Lower expense ratios mean lower investment costs and higher net returns. The following industry data helps you understand average ETF expense ratios and comparison metrics:
| Type | Average Expense Ratio | Lowest ETF Management Fee | Lowest ETF Custody Fee |
|---|---|---|---|
| All ETFs | 0.44% | 0.15% | 0.05% |
| Lowest-Cost ETFs | 0.15% | 0.15% | 0.05% |
As shown in the table, the lowest ETF management fees on the market are only 0.15%. For example, VOO’s expense ratio is 0.03%, well below the industry average, making it ideal for cost-conscious investors.
Recommendation: When choosing ETFs, prioritize products with lower expense ratios, especially for long-term investors. Low expense ratios can significantly boost long-term returns.
By analyzing investment goals, risk tolerance, and expense ratios, you can confidently select ETFs that suit you, taking the first step toward investment success.
Analyzing ETF Historical Performance and Liquidity
An ETF’s historical performance and liquidity are important indicators for assessing its investment value. By analyzing these data, you can better understand an ETF’s stability and trading efficiency, making more informed investment decisions.
Importance of Historical Performance
An ETF’s historical performance reflects its ability to perform across different market environments. You can evaluate an ETF’s potential returns and risks by examining long-term return rates and volatility. For example, bond ETFs have performed strongly in recent years, becoming key tools for asset allocation. The following are key data points:
- As of June 6, the total assets under management for bond ETFs surpassed 300 billion yuan for the first time, reaching 304.3 billion yuan.
- Bosera SSE 30-Year Treasury Bond ETF rose 14.52% over the past year.
- Penghua China Bond-30-Year Treasury ETF rose 14.40% over the past year.
These data indicate that bond ETFs offer stable returns and some protection during market volatility. If you seek stable returns, bond ETFs are a worthy consideration.
Impact of Liquidity on Investments
Liquidity is a key indicator of an ETF’s trading efficiency. High-liquidity ETFs are easier to buy and sell, suitable for both short-term traders and long-term investors. The following are advantages of high-liquidity ETFs:
- Efficient Trading: High-liquidity ETFs allow quick transactions, minimizing the impact of market price fluctuations.
- Low Fees: High-liquidity ETFs typically have lower expense ratios, reducing investment costs.
- Broad Market Coverage: High-liquidity ETFs are often larger in scale and cover broader markets, meeting diverse investor needs.
For example, SPDR S&P 500 ETF Trust (SPY) and Vanguard S&P 500 ETF (VOO) are two highly liquid ETFs. Their average daily trading volumes are among the highest in the ETF market, ensuring investment flexibility.
How to Evaluate ETF Historical Performance and Liquidity
When evaluating an ETF’s historical performance and liquidity, focus on the following key metrics:
| Metric | Description |
|---|---|
| Long-Term Return Rate | Reflects the ETF’s performance across different market environments. |
| Volatility | Measures the ETF’s price stability; lower volatility indicates greater stability. |
| Average Daily Trading Volume | Indicates the ETF’s liquidity; higher volumes mean greater flexibility. |
| Expense Ratio | Lower expense ratios reduce investment costs. |
By analyzing these metrics, you can better understand an ETF’s investment value. For example, VOO’s expense ratio is only 0.03%, and SPY’s average daily trading volume is extremely high, making them top choices for many investors.
Tip: When selecting ETFs, prioritize products with stable historical performance and high liquidity. They offer stable returns and ensure trading flexibility.
By deeply analyzing ETF historical performance and liquidity, you can better seize investment opportunities, optimize asset allocation, and pave the way for investment success.
Investment Strategy Recommendations
Core-Satellite Portfolio Strategy
The core-satellite portfolio strategy is an effective portfolio management approach. It divides investments into two parts: core and satellite. The core portion typically consists of low-risk, stable-return assets, such as large-cap index ETFs like Vanguard S&P 500 ETF (VOO). The satellite portion is allocated to high-growth potential assets, such as tech ETFs like Invesco QQQ Trust (QQQ).
The advantage of this strategy is balancing risk and return. The core portion provides stability, while the satellite portion injects growth momentum into the portfolio. Through this combination, you can reduce overall risk while capitalizing on market growth opportunities.
Tip: When implementing the core-satellite strategy, ensure the core portion has a higher allocation to maintain portfolio stability. The satellite portion can be flexibly adjusted based on market trends.
Dollar-Cost Averaging
Dollar-cost averaging is a simple and effective investment strategy. By investing a fixed amount regularly, you can diversify risk across different market environments. Regardless of market highs or lows, you can reduce investment costs through averaging.
The following statistical data supports the value of dollar-cost averaging:
- Dollar-cost averaging reduces investment risk through cost averaging.
- Starting from market highs, the shortest loss period was 429 days, and the longest was 7 months.
- Adding to positions during market lows can significantly shorten loss periods.
- From July 15, 2011, to June 12, 2025, dollar-cost averaging yielded a maximum return of up to 257.59%.
This strategy is particularly suitable for long-term investors. It not only helps you avoid psychological stress from market volatility but also accumulates wealth over time.
Recommendation: Choose low-cost ETFs like VOO or SCHD for dollar-cost averaging to further enhance long-term returns.
Diversified Investment to Reduce Risk
Diversified investment is a critical strategy for minimizing overall risk. Its core principle is “don’t put all your eggs in one basket.” By spreading investments across different asset classes, industries, and regions, you can reduce the impact of single-asset fluctuations on your portfolio.
The following are key diversification dimensions:
- Asset Class Diversification: Invest in stocks, bonds, cash, and other assets.
- Industry Diversification: Cover sectors like finance, technology, and consumer goods.
- Geographic Diversification: Invest in both U.S. and international markets.
Choosing assets with low correlation is particularly important, as when one asset declines, others may remain unaffected, offsetting overall risk.
Tip: When implementing diversification, consider multi-strategy portfolios, such as combining CTA strategies with stock quantitative strategies. This composite approach can reduce losses and enhance returns, demonstrating its effectiveness.
Through core-satellite portfolios, dollar-cost averaging, and diversified investments, you can build a robust portfolio with growth potential. These strategies help reduce risk while boosting long-term returns.
Balancing Long-Term Holding and Short-Term Trading
In investing, you may face an important choice: long-term holding or short-term trading? Both strategies have their merits and drawbacks, and finding the right balance is crucial.
Long-term holding suits investors seeking stable growth. By holding high-quality ETFs, you can harness the power of compounding. For example, ETFs like Vanguard S&P-500 ETF (VOO) have historically delivered annualized returns of nearly 10% over the past decade. Long-term holding also reduces fees and taxes from frequent trading. For those with limited time to monitor markets, this is a time-efficient strategy.
Short-term trading suits those aiming to capitalize on market fluctuations. Through intraday or swing trading, you can maximize returns in a short period. However, this strategy requires greater market analysis skills and time commitment. Short-term trading carries higher risks, but with a reasonable profit-to-loss ratio, you can still achieve gains.
The following outlines the relationship between profit-to-loss ratios and strategies, helping you understand the risks and rewards of both approaches:
| Profit-to-Loss Ratio Type | Description |
|---|---|
| High Profit-to-Loss Ratio | Expected returns are large relative to potential losses, suitable for high-return seekers. |
| Low Profit-to-Loss Ratio | Higher risk is taken for expected returns, suitable for high-probability strategies. |
| Profit-to-Loss Ratio and Strategy | Intraday traders typically set lower ratios, while long-term investors use higher ratios. |
| Profit-to-Loss Ratio and Success Rate | Low-ratio, high-success-rate strategies can still be profitable. |
| Profit-to-Loss Ratio and Capital Management | Combining reasonable capital management with ratios impacts overall profit potential. |
Tip: If you favor long-term holding, choose low-expense-ratio ETFs to boost returns. For short-term trading, ensure stop-loss levels are set to manage risk.
Regardless of your chosen strategy, the key is to create a plan based on your investment goals and risk tolerance. By balancing long-term holding and short-term trading, you can find the optimal mix of stability and flexibility.
In 2025, the U.S. stock ETF market is full of opportunities. Whether it’s large-cap index ETFs like VOO and SPY, or tech-focused QQQ, these ETFs demonstrate strong growth potential. High-dividend ETFs like SCHD and VIG offer ideal options for those seeking stable returns.
Tip: When selecting ETFs, clearly defining your investment goals and risk tolerance is crucial.
By combining strategies like core-satellite portfolios or dollar-cost averaging, you can create a tailored long-term plan. Through scientific investment methods, you’ll be closer to achieving your wealth growth objectives.
FAQ
What Is an ETF?
An ETF (Exchange-Traded Fund) is a fund listed and traded on a stock exchange. It tracks the performance of a specific index or sector, and investors can trade ETFs like stocks.
What Fees Should You Watch for When Investing in U.S. Stock ETFs?
When investing in U.S. stock ETFs, pay attention to management fees (expense ratios) and trading commissions. Management fees are typically low, for example, VOO’s expense ratio is only 0.03%. Trading commissions depend on your broker.
Which ETFs Are Suitable for Long-Term Investment Among Recommended U.S. Stock ETFs?
VOO and VIG are suitable for long-term investment among recommended U.S. stock ETFs. VOO tracks the S&P 500 index, offering stable growth; VIG focuses on dividend growth companies, ideal for passive-income seekers.
Is Liquidity Important for U.S. Stock ETFs?
Liquidity is very important. High-liquidity ETFs are easier to buy and sell, such as SPY and QQQ. Their high average daily trading volumes ensure investment flexibility.
How to Choose the Right U.S. Stock ETF for You?
Choose an ETF based on your investment goals and risk tolerance. For stable growth, consider VOO. For tech sector opportunities, QQQ is a strong choice.
The 2025 U.S. ETF market offers diverse, low-risk investment opportunities, but efficient fund management and cost-effective trading are key to success. BiyaPay provides a seamless financial solution, enabling trading in U.S. and Hong Kong stock ETFs without offshore accounts, using USD, HKD, and 30+ fiat and digital currencies with real-time exchange rate transparency.
With remittance fees as low as 0.5% across 190+ countries, it empowers investors to participate in top ETFs like VOO and QQQ cost-effectively, achieving diversification and risk control. A 5.48% annualized yield savings product with no lock-in period supports flexible fund allocation during market volatility, boosting returns. Sign up for BiyaPay today to combine ETF investment strategies with BiyaPay’s low-cost tools for a secure, efficient wealth-building journey!
*This article is provided for general information purposes and does not constitute legal, tax or other professional advice from BiyaPay or its subsidiaries and its affiliates, and it is not intended as a substitute for obtaining advice from a financial advisor or any other professional.
We make no representations, warranties or warranties, express or implied, as to the accuracy, completeness or timeliness of the contents of this publication.


Contact Us
Company and Team
BiyaPay Products
Customer Services


BIYA GLOBAL LLC is a licensed entity registered with the U.S. Securities and Exchange Commission (SEC No.: 802-127417); a certified member of the Financial Industry Regulatory Authority (FINRA) (Central Registration Depository CRD No.: 325027); regulated by the Financial Industry Regulatory Authority (FINRA) and the U.S. Securities and Exchange Commission (SEC).
BIYA GLOBAL LLC is registered with the Financial Crimes Enforcement Network (FinCEN), an agency under the U.S. Department of the Treasury, as a Money Services Business (MSB), with registration number 31000218637349, and regulated by the Financial Crimes Enforcement Network (FinCEN).
BIYA GLOBAL LIMITED is a registered Financial Service Provider (FSP) in New Zealand, with registration number FSP1007221, and is also a registered member of the Financial Services Complaints Limited (FSCL), an independent dispute resolution scheme in New Zealand.