- EasyCard
- Trade
- Help
- Announcement
- Academy
- SWIFT Code
- Iban Number
- Referral
- Customer Service
- Blog
- Creator
US Stock Pre-Market Active Trends


Image Source: pexels
Pre-market trading in US stocks is a key window for investors to understand market dynamics. Pre-market trading provides you with an opportunity to observe market sentiment and predict opening trends. Trading volume and price fluctuations often reflect investors’ reactions to company news or economic data.
Currently, the most active stocks in pre-market trading include Tesla (TSLA), Apple (AAPL), and NVIDIA (NVDA). These stocks exhibit significant pre-market trading volume and relatively large price fluctuations. By analyzing the pre-market performance of these stocks, you can identify market trends and formulate more effective trading strategies. Additionally, understanding the rules of pre-market and after-hours trading in US stocks helps you better seize trading opportunities.
List of Active Pre-Market US Stocks
Image Source: pexels
Latest Pre-Market Active Stock Data
In pre-market trading, the performance of active stocks is often influenced by market news, earnings releases, or macroeconomic data. The following is the latest pre-market active stock data statistics:
| Stock Name | Current Price (USD) | Change % | Trading Volume |
|---|---|---|---|
| TSLA Tesla | 326.090 | +5.67% | 9,501,000,840 |
| CRCL Circle | 105.910 | -8.10% | 6,706,901,000 |
| NVDA NVIDIA | 143.960 | +0.93% | 3,112,804,302 |
| TME Tencent Music | 18.340 | -0.92% | 2,228 |
| AAPL Apple | 202.670 | +0.61% | 21 |
| INTC Intel | 22.080 | +7.81% | 2,035,113 |
| TSM TSMC | 212.460 | +2.64% | 1,929,334 |
| AMD Advanced Micro Devices | 123.240 | +1.24% | 18 |
| GOOG Google-C | 180.010 | +1.34% | 1,641,163 |
| BABA Alibaba | 121.880 | +0.33% | 1,108,318 |
From the table, it can be seen that Tesla (TSLA) and Circle (CRCL) stand out in pre-market trading, with trading volumes of 9.5 billion and 6.7 billion, respectively, ranking at the forefront. Tesla’s gain reached 5.67%, while Circle fell 8.10% due to negative news.
Additionally, the following bar chart illustrates the trading volume distribution of these stocks:
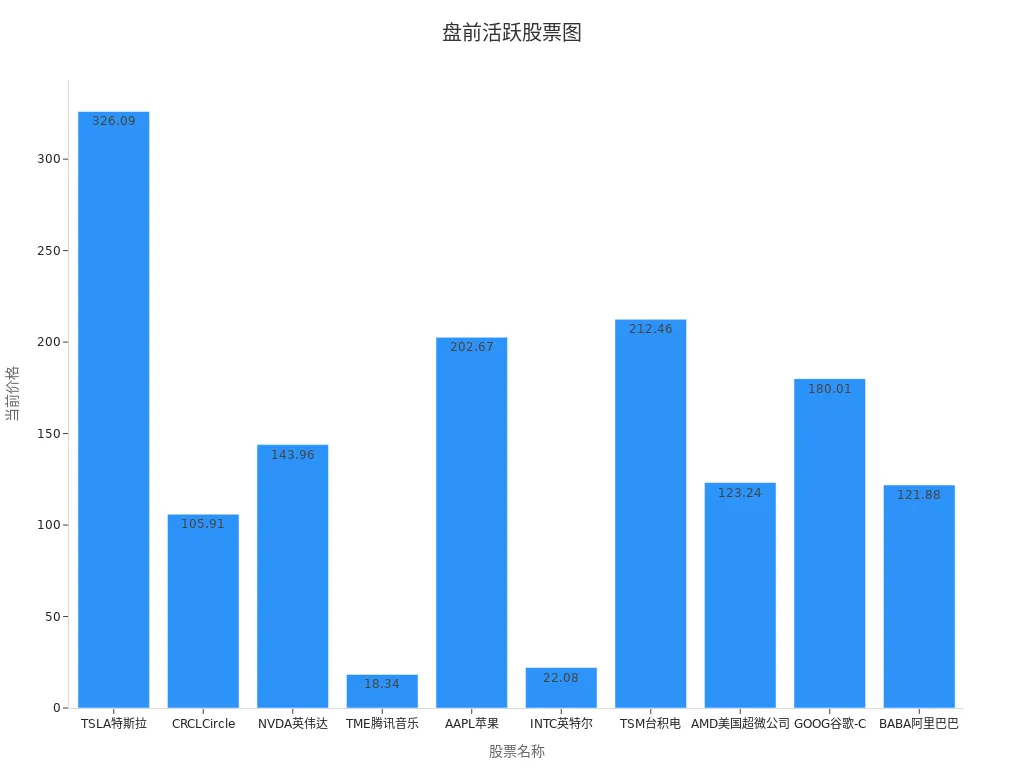
Stock Tickers and Trading Volume Analysis
In pre-market trading, trading volume is a key indicator of stock activity. High trading volume typically indicates strong market attention to a stock, often accompanied by significant price fluctuations. The following is the recent trading volume ranking for some stocks:
| Ticker | After-Hours Volume | After-Hours Period | After-Hours Change | After-Hours Change % | Price (USD) | Change % | Trading Volume | Market Cap (USD) | 1-Year Market Cap Performance % |
|---|---|---|---|---|---|---|---|---|---|
| VTAK | 93.58 M | 0.4659 | +0.2395 | +105.79% | 0.2264 | +0.80% | 97.74 M | 2.49 M | −45.43% |
| CARM | 28.66 M | 0.80 | −0.31 | −27.86% | 1.11 | +389.42% | 722.61 M | 9.48 M | −84.67% |
| GTI | 24.01 M | 0.0569 | −0.0300 | −34.52% | 0.0869 | −1.59% | 41.69 M | 12.75 M | −97.85% |
| HCTI | 19.78 M | 0.0070 | −0.0002 | −2.78% | 0.0072 | −1.37% | 150.63 M | 2.94 M | −7.96% |
| GNLN | 17.64 M | 0.0069 | −0.0002 | −2.82% | 0.0071 | +9.23% | 263.21 M | 7.25 M | +225.88% |
From the data, it can be seen that VTAK’s after-hours trading volume reached 93.58 million, with a gain exceeding 105%. This indicates strong market expectations for its future performance. In contrast, while CARM and GTI also had high trading volumes, their prices experienced significant declines.
Price Change and Other Key Indicators
In pre-market trading, price change is one of the core indicators investors focus on. It directly reflects the market’s short-term expectations for a stock. For example, Intel (INTC) saw a pre-market gain of 7.81%, indicating strong market confidence in its recent performance. In contrast, Circle (CRCL) experienced a decline of 8.10%, possibly related to recent negative news.
In addition to price changes, other key indicators such as market capitalization performance and one-year market cap changes are also worth noting. The following is the market capitalization performance data for some stocks:
- Tesla (TSLA): Stable market cap performance, with a pre-market gain of 5.67%.
- NVIDIA (NVDA): Significant market cap growth, with a pre-market gain of 0.93%.
- Alibaba (BABA): Steady market cap performance, with a pre-market gain of 0.33%.
By analyzing these data, you can better understand market sentiment and, combined with pre-market and after-hours trading rules, formulate more effective investment strategies.
Analysis of US Stock Pre-Market Active Trends

Image Source: pexels
Price Fluctuation Trends
Price fluctuation is one of the most attention-grabbing indicators in pre-market trading. By observing price change trends, you can understand the market’s expectations for a particular stock. For example, Tesla (TSLA) rose 5.67% in pre-market trading, indicating market confidence in its future performance. Price fluctuations are typically influenced by company news, earnings releases, and macroeconomic data.
In pre-market trading, price fluctuations can be relatively large. You can take advantage of this characteristic to capture short-term trading opportunities. For instance, when a stock’s price continues to rise in pre-market trading, it may indicate increased market demand for that stock. Conversely, a price decline may signal ainseparable. The illustration of the price-volume relationship shows the interaction between price and trading volume, helping you identify changes in market trends and optimal buying or selling opportunities. By analyzing price fluctuation trends, you can better predict market performance after the opening.
Trading Volume Change Trends
Trading volume is a key indicator for measuring stock activity. By observing changes in trading volume, you can gauge the market’s attention to a particular stock. For example, Tesla (TSLA) recorded a pre-market trading volume of 9.5 billion, indicating high market attention.
Research shows that there is a nonlinear relationship between trading volume and price changes. When trading volume decreases, prices do not necessarily fall. This means you need to combine other indicators to judge market trends. Here are some commonly used strategies:
- Use the relationship between price changes and trading volume to assess market capital inflows and outflows, capturing market trends and reversal signals.
- By calculating the linear regression slope of the money flow index and price, combined with specific threshold conditions, generate buy or sell signals.
Changes in trading volume trends can also help you identify market sentiment. When trading volume significantly increases, it may indicate rising market interest in a stock. By combining pre-market and after-hours trading rules, you can formulate more effective trading strategies.
Market Driver Analysis
Market drivers are important variables affecting pre-market trading. By analyzing these factors, you can understand the overall market trends. Here are some common drivers:
- Company News: Major news such as acquisitions, partnerships, or product launches directly impacts stock prices. For example, Circle (CRCL) fell 8.10% in pre-market trading due to negative news.
- Earnings Releases: Quarterly earnings are often a focal point in pre-market trading. When earnings data exceed expectations, stock prices may rise; otherwise, they may fall.
- Macroeconomic Data: Economic indicators such as employment data and inflation rates affect market sentiment. By paying attention to these data, you can predict short-term market trends.
Additionally, the pre-market performance of industry sectors is worth noting. The technology sector is typically active in pre-market trading, while the energy sector may be influenced by fluctuations in international oil prices. By combining pre-market and after-hours trading rules, you can better grasp market dynamics.
US Stock Pre-Market and After-Hours Trading Rules and Market Dynamics
Timing and Characteristics of Pre-Market and After-Hours Trading
The rules for pre-market and after-hours trading in US stocks are crucial for investors. By understanding these rules, you can better plan your trading schedule. The following is the schedule for pre-market and after-hours trading:
- Pre-Market Trading Hours: 04:00-09:30 (Eastern Time).
- Regular Trading Hours: 09:30-16:00 (Eastern Time).
- After-Hours Trading Hours: 16:00-20:00 (Eastern Time).
The time difference between Daylight Saving Time and Standard Time affects the trading hours for Chinese investors. For example, pre-market trading hours during Daylight Saving Time are 16:00-21:30, while during Standard Time, they are 17:00-22:30. After-hours trading hours also vary with the season.
After-hours trading has its unique characteristics. Exchanges conduct centralized matching based on time priority, and the settlement of funds and stocks is automatically completed by the securities trading system. You need to log into your securities account during the declaration period, enter the stock code, trading direction, and declaration price. The declaration price is usually within a certain percentage range of the closing price.
Pre-Market Performance of Major Market Indices
In pre-market trading, the performance of major market indices can help you understand the overall market trend. The following is the pre-market data for some market indices:
| Name | Latest | Change Amount | Change % | Market Overview | Up | Down |
|---|---|---|---|---|---|---|
| DJ Basic Material | 568.48 | +3.44 | +0.61% | Up 74.42% Down 25.58% | 32 | 11 |
| DJ Financials | 1,070.42 | +1.36 | +0.13% | Up 67.54% Down 31.14% Unchanged 1.32% | 154 | 71 |
| DJ Health Care | 1,433.06 | +15.21 | +1.07% | Up 71.43% Down 27.38% Unchanged 1.19% | 60 | 23 |
| DJ Oil & Gas | 710.74 | +12.10 | +1.73% | Up 85.00% Down 15.00% | 34 | 6 |
| S&P 500 Energy Sector | 645.41 | +11.22 | +1.77% | Up 78.26% Down 21.74% | 18 | 5 |
From the data, it can be seen that the energy and oil & gas sectors performed particularly well in pre-market trading, with gains of 1.77% and 1.73%, respectively. These sectors’ gains may be influenced by fluctuations in international oil prices. The following is a bar chart showing the latest values and percentage changes of pre-market market indices:
Pre-Market Performance of Industry Sectors
The pre-market performance of industry sectors can reveal market hotspots. The technology sector is typically active in pre-market trading, while the energy sector may be affected by international oil price fluctuations. The following are some characteristics of industry sector performance in pre-market trading:
- Technology Sector: Significantly influenced by earnings releases and company news, with notable price fluctuations.
- Energy Sector: Directly affected by changes in international oil prices in pre-market performance.
- Healthcare Sector: Typically driven by macroeconomic data and policy changes.
By observing the pre-market performance of these sectors, you can identify market hotspots and, combined with pre-market and after-hours trading rules, formulate more effective investment strategies.
Investment Advice
How to Use Pre-Market Data for Stock Selection
Pre-market data provides you with important market information to help you screen potential stocks. Here are some specific strategies:
- Focus on price gains over the past N days and use the
ndayratestrategy to select high-performing stocks. This strategy is highly flexible and suitable for different investor needs. - Combine machine learning techniques to build efficient predictive models. Research shows that this approach can significantly improve stock selection accuracy, helping you make scientific decisions.
- Use deep learning models (such as RNN, LSTM, GRU) to capture complex relationships in the market and improve prediction efficiency.
Successful cases show that by optimizing stock selection strategies, total assets grew from $500,000 to $1 million, with overall returns increasing from 400% to 900%, and annualized returns rising from 17% to 26%. These data demonstrate the value of pre-market data.
Risk Mitigation Strategies
In investing, risk management is crucial. The following strategies can help you reduce risks:
- Promote digital management to improve market response speed. For example, digital supply chain management can effectively reduce financial risks.
- Strengthen internal controls to enhance financial risk prevention capabilities. Through information sharing, you can respond to market changes more quickly.
- Diversify investments to avoid concentrating funds in a single stock or sector. This can reduce the impact of market fluctuations on your portfolio.
Historical data shows that digital transformation and risk management measures can significantly reduce maximum drawdowns from 50% to 20%. These methods provide reliable risk mitigation tools.
Pre-Market Trading Strategies for Long-Term and Short-Term Investments
Pre-market trading strategies should be adjusted based on investment goals:
- Short-Term Investments: Focus on price fluctuations and trading volume changes. Use pre-market data to capture short-term opportunities, such as quickly following up when a stock rises due to news or earnings.
- Long-Term Investments: Analyze macroeconomic data and industry trends. Select stocks with stable growth potential and ignore short-term fluctuations.
Regardless of the strategy chosen, pre-market data provides critical reference points. By combining scientific investment methods, you can better achieve your financial goals.
The trends of active pre-market stocks reveal the core dynamics of the market. The following are some key data and statistical conclusions:
| Core Data | Statistical Conclusions |
|---|---|
| ADR Indicator | ADR typically ranges between 0.5 and 1.5; |
| ADR > 1.5 indicates a high likelihood of a market pullback; | |
| ADR < 0.65 indicates a high likelihood of a market rebound; | |
| Leading Stock Performance | Latest sector leader: Low-altitude economy |
| Daily Gains | Six stocks: Lihang Technology +10.01%, etc. |
| Trading Volume | Top 30 by volume led by Inspur Information |
| Buy/Sell Points | Hot topic: Low-altitude economy |
Through these data, you can identify market hotspots and optimize trading strategies. Pre-market trading provides an opportunity to observe market sentiment and capital flows. The following points can help you better understand market dynamics:
- Reviewing helps identify market commonalities and differences, predicting future trends.
- Pay attention to the turnover list and hot capital movements to identify potential opportunities.
- Improve trading models through reviews to increase success rates.
Pre-market trading is not only a powerful tool for short-term investments but also a guide for long-term investments. By combining after-hours data, you can further refine your investment strategies and seize more market opportunities.
FAQ
What is US Stock Pre-Market Trading?
US stock pre-market trading refers to stock buying and selling activities conducted before the official market opening. The trading hours are typically from 04:00 to 09:30 Eastern Time. You can use pre-market trading to observe market sentiment and position yourself in advance.
How to Obtain Pre-Market Active Stock Data?
You can obtain pre-market active stock information through real-time data provided by financial platforms or brokers. For example, use Yahoo Finance or Bloomberg to check the latest trading volume and price changes.
What Are the Risks of Pre-Market Trading?
Pre-market trading has lower liquidity and larger price fluctuations. You need to be aware that insufficient trading volume may lead to difficulties in buying or selling. Additionally, pre-market prices may differ significantly from the official opening prices.
Can Pre-Market Data Predict Opening Trends?
Pre-market data can provide some reference, but it is not absolutely accurate. You can analyze opening trends by combining trading volume, price changes, and market news, but decisions should be made cautiously.
How Can Chinese Investors Participate in US Stock Pre-Market Trading?
Chinese investors can open US stock accounts through Hong Kong banks or international brokers. Ensure the account supports pre-market trading functions and understand the related fees and exchange rate impacts.
Premarket trading in U.S. stocks offers a critical window for investors to capture market dynamics and short-term opportunities, particularly with active stocks like Tesla (TSLA: $309.87), Apple (AAPL: $212.41), and NVIDIA (NVDA: $164.10). BiyaPay provides a seamless financial solution, enabling trading in U.S. and Hong Kong stocks without offshore accounts, allowing you to participate in the market cost-effectively, whether capturing premarket volatility through high-frequency trading or investing in resilient assets for the long term.
It supports USD, HKD, and 30+ fiat and digital currencies with real-time exchange rate transparency, ensuring clear transactions and aiding risk management. With remittance fees as low as 0.5% across 190+ countries, it facilitates flexible cross-border fund allocation to navigate market uncertainty. A flexible 5.48% annualized yield savings product with no lock-in period optimizes capital use during premarket gaps, boosting return potential. Sign up for BiyaPay today to leverage premarket data with BiyaPay’s low-cost tools for a flexible, efficient investment experience!
*This article is provided for general information purposes and does not constitute legal, tax or other professional advice from BiyaPay or its subsidiaries and its affiliates, and it is not intended as a substitute for obtaining advice from a financial advisor or any other professional.
We make no representations, warranties or warranties, express or implied, as to the accuracy, completeness or timeliness of the contents of this publication.


Contact Us
Company and Team
BiyaPay Products
Customer Services


is a broker-dealer registered with the U.S. Securities and Exchange Commission (SEC) (No.: 802-127417), member of the Financial Industry Regulatory Authority (FINRA) (CRD: 325027), member of the Securities Investor Protection Corporation (SIPC), and regulated by FINRA and SEC.
registered with the US Financial Crimes Enforcement Network (FinCEN), as a Money Services Business (MSB), registration number: 31000218637349, and regulated by FinCEN.
registered as Financial Service Provider (FSP number: FSP1007221) in New Zealand, and is a member of the Financial Dispute Resolution Scheme, a New Zealand independent dispute resolution service provider.