- EasyCard
- Trade
- Help
- Announcement
- Academy
- SWIFT Code
- Iban Number
- Referral
- Customer Service
- Blog
- Creator
How Is the Nasdaq Index Different from Other U.S. Indices?


Image Source: pexels
If you want to compare major U.S. indices, you will find that the Nasdaq has several distinct characteristics: it includes over 3,000 constituent companies, with a very high proportion of technology stocks, and its industry distribution is concentrated in information technology and communication services. The table below shows the main differences among the three major indices:
| Index Name | Number of Constituents | Main Industry Distribution | Internationalization Characteristics |
|---|---|---|---|
| Nasdaq | 3,000+ | Dominated by technology and communication services, with concentrated weight | High degree of internationalization |
| S&P 500 | 500 | Diversified industries, with dispersed technology stocks | Broad representation, relatively high internationalization |
| Dow Jones Industrial Average | 30 | Dominated by blue-chip stocks, with fewer technology stocks | Lower degree of internationalization |
When choosing an index or ETF, you need to pay attention to these differences, as they directly affect the industry distribution and volatility of your investment portfolio.
Key Points
- The Nasdaq Index includes over 3,000 companies, with a high proportion of technology stocks, suitable for tracking innovative and high-growth companies.
- The S&P 500 covers 500 large companies, with diversified industries and risk dispersion, suitable for investors seeking stable returns.
- The Dow Jones Industrial Average selects only 30 blue-chip stocks, emphasizing traditional large U.S. companies, with a different calculation method from other indices.
- The Nasdaq and S&P 500 use market capitalization weighting, reflecting the influence of large companies; the Dow Jones Industrial Average uses price weighting, heavily influenced by high-priced stocks.
- When investing, you should choose an index based on your personal risk tolerance and goals; the Nasdaq has higher volatility but greater growth potential, while the S&P 500 and Dow Jones Industrial Average are more stable.
Index Overview
Nasdaq
If you want to understand the Nasdaq Index, you should first know that it has two main versions: the Nasdaq Composite Index and the Nasdaq 100. The Nasdaq Composite Index covers over 3,000 companies, making it the U.S. major index with the most constituents. You will find that this index is calculated using market capitalization weighting, where companies with larger market caps have greater influence. The Nasdaq 100 focuses on the 100 largest non-financial companies, with the technology sector accounting for over half. This index is particularly suitable if you want to track the performance of technology and new economy companies. The Nasdaq’s representativeness lies in its reflection of the development and innovation momentum of the U.S. technology industry.
S&P 500
The S&P 500 Index represents the 500 largest publicly listed companies in the U.S. You can see that this index covers multiple industries, including technology, healthcare, financials, consumer goods, and industrials. According to the latest data, the technology sector accounts for about 27%, healthcare 14%, and financials 12%. If you want to know how constituents are selected, the S&P 500 has strict criteria: a company’s market capitalization must be at least USD 14.6 billion, it must be a U.S.-based company, it must have positive earnings for the most recent four quarters and the latest quarter, and public shareholding must reach at least 10%. These criteria ensure that the index’s constituent companies are large-scale and consistently profitable. The index also uses market capitalization weighting, reflecting the market influence of large companies.
Dow Jones Industrial Average
The Dow Jones Industrial Average is one of the oldest stock market indices in the U.S. You will find that it includes only 30 large blue-chip companies from industries such as healthcare, financials, technology, and industrials. The technology sector accounts for about 17% of the Dow Jones Industrial Average, with healthcare and financials each accounting for 20%. This index is calculated using price weighting, unlike the Nasdaq and S&P 500. The Dow Jones Industrial Average emphasizes the stability of the U.S. economy and the representativeness of traditional industries. If you want to track the most historically significant and influential U.S. companies, this index is one of your reference points.
Constituents

Image Source: pexels
Nasdaq
If you closely examine the Nasdaq Composite Index, you will find that it includes over 3,000 companies, making it the U.S. major index with the most constituents. This index has relatively lenient selection criteria, as companies listed on the Nasdaq exchange are generally included. You will see many emerging industries and technology companies, such as Apple, Microsoft, and Amazon. This design allows the index to better reflect the development of the technology industry and innovative companies.
The Nasdaq 100 selects only the 100 largest non-financial companies by market capitalization. If you want to track the performance of U.S. technology giants, the Nasdaq 100 is more focused. This index excludes the financial sector, primarily focusing on technology, consumer, and healthcare sectors in the new economy. The constituent companies of the Nasdaq 100 have large market capitalizations and higher volatility. You can use this index to observe the growth pace of the U.S. innovation industry.
Tip: The Nasdaq Composite Index represents all companies listed on the Nasdaq exchange, while the Nasdaq 100 selects only the 100 most representative non-financial companies.
Other Indices
If you compare the S&P 500 and Dow Jones Industrial Average, you will find that their number of constituents and selection criteria are quite different:
- The S&P 500 includes 500 large companies, with diversified industry distribution and risk dispersion. This index uses market capitalization weighting, where companies with larger market caps have greater influence.
- The S&P 500’s constituents are selected by a dedicated committee and adjusted quarterly. Selection criteria are flexible, considering factors such as market capitalization, profitability, and liquidity. This ensures the index reflects the overall state of the U.S. economy.
- The Dow Jones Industrial Average has only 30 constituent companies, all of which are large blue-chip stocks. This index uses price weighting, where companies with higher stock prices have greater influence.
- The Dow Jones Industrial Average’s selection process is similar to the S&P 500 but includes far fewer companies, limiting its representativeness. If you want to track the most historically significant and influential U.S. companies, you can refer to this index.
You can use the table below to quickly compare the constituent characteristics of the three major indices:
| Index Name | Number of Constituents | Selection Criteria | Weighting Method |
|---|---|---|---|
| Nasdaq Composite Index | 3,000+ | Listed on Nasdaq | Market Cap Weighted |
| Nasdaq 100 | 100 | Largest market cap non-financial companies | Market Cap Weighted |
| S&P 500 | 500 | Committee selection, based on multiple criteria | Market Cap Weighted |
| Dow Jones Industrial Average | 30 | Committee selection, focused on blue-chip stocks | Price Weighted |
If you want to diversify your investments, the S&P 500 is more suitable. If you want to focus on technology or new economy companies, you can consider the Nasdaq 100 or Nasdaq Composite Index. The Dow Jones Industrial Average is suitable if you want to track the performance of traditional large U.S. companies.
Industry Distribution
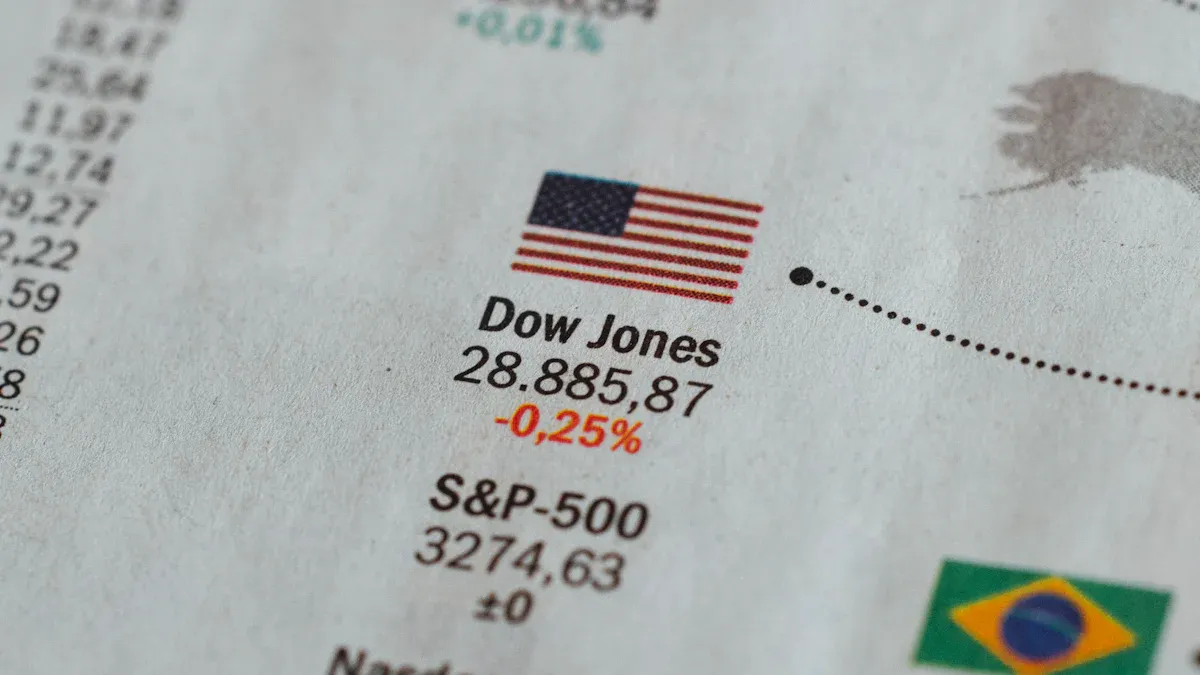
Image Source: unsplash
Technology Stocks
If you observe the Nasdaq’s constituent companies, you will find that technology stocks dominate. The Nasdaq has about 3,000 listed companies, with the Nasdaq 100 specifically selecting the 100 largest non-financial companies, most of which come from high-tech and IT-related sectors. At the end of December each year, the index is re-ranked based on market capitalization to ensure that leading technology companies maintain significant positions. This design makes the Nasdaq a global benchmark for the technology industry. If you want to invest in tech giants like Apple, Microsoft, or Amazon, the Nasdaq Index is your top choice. The high proportion of technology stocks makes the index particularly sensitive to changes in innovation and the new economy.
Tip: A high proportion of technology stocks means higher volatility, with more pronounced rises and falls compared to other indices.
Diversification
The industry distribution of the S&P 500 and Dow Jones Industrial Average is more diversified. You will see that the S&P 500 covers technology, healthcare, financials, consumer goods, industrials, and other sectors, with technology stocks being significant but not overly concentrated. The Dow Jones Industrial Average selects 30 large blue-chip companies, with industry distribution including healthcare, financials, industrials, and some technology companies. This diversified design helps spread risk, making the indices’ performance more stable.
In addition to its high proportion of technology stocks, the Nasdaq includes many international companies. You will find that many companies from China, Europe, Israel, and other regions choose to list on the Nasdaq, reflecting the index’s internationalization and diversification characteristics. If you want to invest in global new economy companies, the Nasdaq offers more choices.
Calculation Methods and Volatility
Market Capitalization Weighting
If you want to understand index calculation methods, you can first look at the difference between market capitalization weighting and price weighting. Market capitalization weighting determines a company’s influence in the index based on its market cap. The larger the market cap, the greater the company’s influence. The Nasdaq and S&P 500 both use this method. For example, companies like Apple and Microsoft, with huge market caps, have a significant impact on the index’s rise or fall. This calculation method reflects the actual performance of large companies in the market.
The Dow Jones Industrial Average uses price weighting. This method determines influence based on a company’s stock price. The higher the stock price, the greater the company’s influence. You will find that sometimes companies with smaller market caps but higher stock prices have a greater impact on the Dow Jones Industrial Average than companies with larger market caps. This design causes the Dow Jones Industrial Average’s performance to sometimes differ significantly from other indices.
| Index Name | Weighting Method | Main Influencing Factor |
|---|---|---|
| Nasdaq | Market Cap Weighted | Company Market Cap |
| S&P 500 | Market Cap Weighted | Company Market Cap |
| Dow Jones Industrial Average | Price Weighted | Company Stock Price |
Tip: Market capitalization weighting more accurately reflects the market dynamics of large companies, while price weighting is easily influenced by individual high-priced stocks.
Risk
If you choose to invest in Nasdaq-related indices, you must note their higher volatility. The heavy weighting of technology stocks means these companies innovate quickly but also face high risks from market competition and policy changes. When positive news hits the technology sector, the index can rise sharply; but negative news can lead to significant declines. You will find that the Nasdaq’s daily fluctuations are often greater than those of the S&P 500 and Dow Jones Industrial Average.
The S&P 500 and Dow Jones Industrial Average, due to their diversified industry distribution, have relatively lower volatility. If you want to reduce investment risk, you can consider these two indices. The Nasdaq is suitable for investment strategies seeking high growth and willing to tolerate greater volatility.
Note: High volatility means high risk but also potential for high returns. You should choose an index based on your risk tolerance.
Impact on Investors
Diversification
When choosing an index, diversification is an important consideration. A highly diversified index can help you reduce risks from a single industry or company. You can use the Herfindahl Index (HI) to measure diversification effects. The lower the HI value, the more diversified the portfolio and the lower the risk.
- The S&P 500, with many constituents and broad industry distribution, typically has a lower HI value, with significant diversification effects.
- The Dow Jones Industrial Average, with only 30 companies, has a higher HI value and is more susceptible to individual company influence.
- The Nasdaq Composite Index, despite having many companies, has a high proportion of technology stocks, making its diversification less ideal than the S&P 500.
You should not only look at the number of companies but also consider industry concentration. Diversified holdings can reduce outlier risks, making your investment portfolio more stable.
Strategies
You can choose different index investment strategies based on your risk tolerance and investment goals.
- If you seek stable returns, you can consider low-volatility strategies. Academic research shows that low-volatility stocks often outperform high-volatility stocks in risk-adjusted returns.
- You can use metrics like standard deviation and maximum drawdown to analyze the volatility of different indices. The S&P 500 and Dow Jones Industrial Average have lower volatility, suitable for conservative investors.
- If you are willing to tolerate higher volatility for growth potential, you can choose indices with a high proportion of technology stocks. These indices offer higher returns during favorable market conditions but carry greater risks during declines.
Tip: You can flexibly adjust your portfolio based on your age, financial goals, and risk preferences. Diversified investments and low-volatility strategies help enhance long-term investment stability.
When choosing an index, you should make decisions based on industry distribution, volatility, and personal investment goals. The Nasdaq, with its high proportion of technology stocks, is suitable if you seek innovation and high growth. The S&P 500 and Dow Jones Industrial Average, with more diversified industry distribution and lower volatility, are better suited for conservative investors.
- Investment teams believe artificial intelligence and the energy sector are core drivers of future growth.
- Nvidia, despite facing tariff pressures, continues to show strong performance, demonstrating resilience in specific industries during volatility.
- Government policies supporting the energy sector create more investment opportunities.
- The U.S. market continues to benefit from the AI theme, with potential in both the short and long term.
You can flexibly choose the appropriate index based on your risk tolerance and views on industry trends.
FAQ
What is the difference between the Nasdaq Index and the Nasdaq 100?
The Nasdaq Index includes over 3,000 companies, while the Nasdaq 100 selects the 100 largest non-financial companies by market cap. If you want to focus on investing in tech giants, you can choose the Nasdaq 100.
Is the S&P 500 suitable for beginner investors?
If you want to diversify risk, the S&P 500 is more suitable. It covers multiple industries with lower volatility, making it ideal for beginners in long-term investing.
Why does the Dow Jones Industrial Average have only 30 companies?
The Dow Jones Industrial Average emphasizes representativeness, selecting only the 30 most influential U.S. blue-chip companies. You can use it to observe the performance of major U.S. companies.
What are the risks of investing in the Nasdaq Index?
The Nasdaq has a high proportion of technology stocks and significant volatility. If you seek high growth, you must tolerate larger price fluctuations and industry risks.
Can U.S. index ETFs be purchased in Hong Kong?
You can buy U.S. index ETFs through many banks or brokerages in Hong Kong. Transactions are settled in U.S. dollars (USD), so you need to be aware of exchange rate changes.
The Nasdaq Index, with its tech-heavy focus and high growth potential, stands out for tracking innovative companies, but how can you transform your enthusiasm for US indices into cost-effective global trading? BiyaPay offers an all-in-one financial platform, enabling trading of US and Hong Kong stocks without offshore accounts, allowing you to seize opportunities in Nasdaq and S&P 500 markets without complex cross-border setups.
Supporting USD, HKD, and 30+ fiat and digital currencies, real-time exchange rate tracking ensures cost transparency, while global remittances to 190+ countries feature transfer fees as low as 0.5% with swift delivery, meeting the liquidity needs of index-driven investments. A 5.48% annualized yield savings product, with no lock-in period, balances the risks and rewards of volatile markets. Sign up for BiyaPay today to merge the growth potential of US indices with BiyaPay’s global financial solutions, crafting a dynamic, efficient investment approach!
*This article is provided for general information purposes and does not constitute legal, tax or other professional advice from BiyaPay or its subsidiaries and its affiliates, and it is not intended as a substitute for obtaining advice from a financial advisor or any other professional.
We make no representations, warranties or warranties, express or implied, as to the accuracy, completeness or timeliness of the contents of this publication.


Contact Us
Company and Team
BiyaPay Products
Customer Services


is a broker-dealer registered with the U.S. Securities and Exchange Commission (SEC) (No.: 802-127417), member of the Financial Industry Regulatory Authority (FINRA) (CRD: 325027), member of the Securities Investor Protection Corporation (SIPC), and regulated by FINRA and SEC.
registered with the US Financial Crimes Enforcement Network (FinCEN), as a Money Services Business (MSB), registration number: 31000218637349, and regulated by FinCEN.
registered as Financial Service Provider (FSP number: FSP1007221) in New Zealand, and is a member of the Financial Dispute Resolution Scheme, a New Zealand independent dispute resolution service provider.