- EasyCard
- Trade
- Help
- Announcement
- Academy
- SWIFT Code
- Iban Number
- Referral
- Customer Service
- Blog
- Creator
How Technical Analysis Enhances Dow Jones Index Chart Interpretation


Image Source: pexels
Many investors often wonder whether technical analysis can truly improve the interpretation of Dow Jones index charts. Studies show that while technical indicators such as moving averages, RSI, and MACD aid in short-term trend judgment, statistical data has not proven their significant advantage in the Dow Jones index. Professional analysts suggest that investors should focus on major market trends and support/resistance levels, and combine independent thinking, to effectively identify buy and sell signals.
Key Points
- Technical analysis, through price and volume data, helps investors judge market trends and trading opportunities, enhancing understanding of Dow Jones index charts.
- Combining multiple technical indicators such as moving averages, MACD, RSI, and KD indicators can improve judgment accuracy and reduce the risk of misjudgment.
- Trend lines, support, and resistance levels are critical for analysis, helping investors assess price movements and adjust trading strategies.
- Technical indicators have lag and false signal risks, so investors should use them rationally, combining fundamental and news analysis to enhance overall judgment.
- Continuous learning and practicing technical analysis skills, along with diverse data and strategy backtesting, help investors steadily grasp market changes and risks.
Technical Analysis Principles
Price and Volume Assumptions
Technical analysis is built on several core assumptions. First, prices reflect all information. Every transaction in the market embodies investors’ expectations for the future. Second, history tends to repeat itself. Professional analysts often use large amounts of historical price and volume data to predict future market trends. Volume, as one of the foundational elements for calculating technical indicators, reflects the total market buying and selling activity. When volume significantly increases, it usually indicates higher market participation, enhancing the reliability of price trends. Conversely, if volume decreases, price movements may lack support, potentially signaling a trend reversal.
Volume and price are closely linked. When stock prices rise with increasing volume, the market atmosphere is active, and the trend is more likely to persist. The relationship between volume and price serves as a key basis for judging trend strength. These historical data and technical indicators collectively support the correlation theory between price and volume in technical analysis.
Trends and Support/Resistance
In Dow Jones index chart analysis, trends, support, and resistance play critical roles. A trend refers to the direction of price movement over an extended period, classified as upward, downward, or sideways consolidation. Investors can draw trend lines by connecting multiple highs or lows to assist in determining market direction.
Support lines are where prices stop falling and rebound, as buying forces outweigh selling forces, making prices likely to rise. Resistance lines are where prices stop rising and pull back, with stronger selling forces causing prices to fall. These levels often become psychological support or resistance, and frequent price touches strengthen the trend. When prices break through support or resistance levels without quickly rebounding, the trend may continue until new support or resistance forms.
- Pivot points are calculated based on previous highs, lows, and closing prices, helping determine whether the market trend is bullish or bearish.
- Support and resistance lines reflect the balance of buying and selling forces, becoming psychological thresholds when frequently tested.
- After a price breaks through support or resistance, the trend’s significance may change, allowing investors to adjust stop-loss or take-profit positions accordingly.
Technical indicators like RSI can further assist in assessing trend strength and reversal timing. Combining these analytical methods, investors can more effectively interpret Dow Jones index charts and improve judgment.
Common Indicators for Dow Jones Index Charts
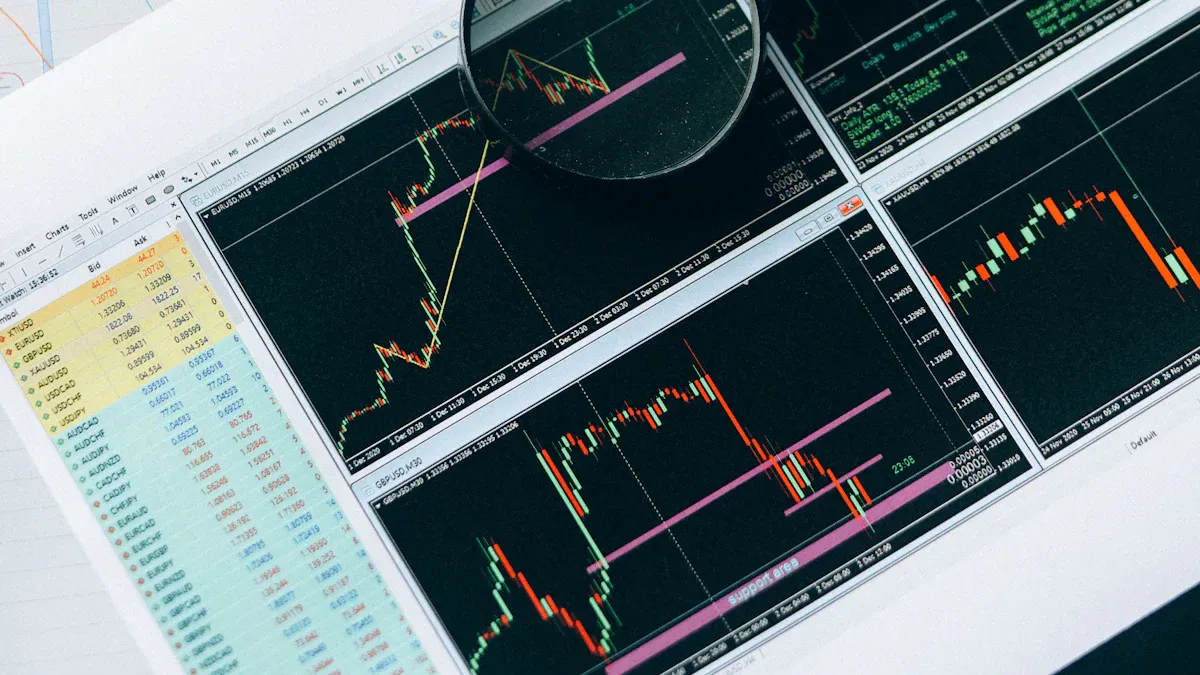
Image Source: pexels
When analyzing Dow Jones index charts, technical indicators help investors gain clearer insights into market movements. Below are some of the most commonly used technical indicators and their key applications.
Moving Averages (MA/EMA)
Moving averages are among the most fundamental technical indicators. MA (Simple Moving Average) calculates the average closing price over a period, while EMA (Exponential Moving Average) assigns higher weight to recent prices.
- MA is suitable for identifying long-term trends, while EMA is more responsive and suited for short-term trading.
- When prices are above the moving average, the market is typically in an upward trend; below it indicates a downward trend.
- Crossovers of multiple moving averages with different periods are commonly used to identify buy and sell opportunities.
MACD
MACD (Moving Average Convergence Divergence) combines short-term and long-term EMAs to reflect changes in market momentum.
- When the MACD line crosses above the signal line, it’s a buy signal; crossing below is a sell signal.
- The histogram shows momentum strength, with larger bars indicating an accelerating trend and smaller bars suggesting a potential reversal.
- MACD is suitable for medium- to long-term trend analysis, filtering out some short-term noise.
RSI
RSI (Relative Strength Index) measures whether the market is overbought or oversold.
- When RSI exceeds 70, the market enters overbought territory, and prices may pull back, prompting investors to consider taking profits.
- When RSI falls below 30, the market is oversold, and prices may rebound.
- RSI is often combined with other indicators (e.g., KD) to improve accuracy in judging extreme market conditions.
- Single RSI signals should not be used in isolation; they require confirmation from volume, market sentiment, and fundamental analysis.
KD Indicator
The KD indicator (Stochastic Oscillator) uses K and D values to reflect the speed of price changes, suitable for short-term trading.
- The K value reacts faster, while the D value is slower; their crossovers produce golden cross (buy) and death cross (sell) signals.
- When the D value exceeds 80, the market is overbought, increasing pullback risks; below 20, it’s oversold, raising rebound chances.
- When the KD indicator remains high or low for extended periods (passivation), its judgment reliability decreases, leading to potential misjudgments.
- KD is highly sensitive and prone to short-term noise, so it’s recommended to use it with other indicators.
Bollinger Bands
Bollinger Bands use a moving average and standard deviation to set upper and lower bands, capturing price fluctuation ranges.
- When prices touch the upper band, the market may be overheated; falling below the lower band suggests oversold conditions.
- Historical data shows that after prices break below the lower band, they often return to the mean and rebound near the middle band.
- Backtesting reveals that combining Bollinger Bands with profit-taking mechanisms can improve returns and reduce risks.
- Investors can use Bollinger Bands to set stop-loss and take-profit points, responding rationally to fluctuations.
Other Auxiliary Indicators
In addition to the above mainstream indicators, investors can refer to the following auxiliary tools to enhance Dow Jones index chart interpretation:
- Chaikin Oscillator: Combines volume and price changes to assess capital flow direction.
- TRIX: Triple exponential moving average, filtering short-term noise, suitable for medium- to long-term trend analysis.
- OBV (On-Balance Volume): Tracks cumulative volume changes to reflect major capital movements.
- Candlestick Charts: Display daily open, high, low, and close prices in candlestick form, intuitively showing bullish and bearish forces.
- Volatility Indicators (e.g., VIX): Measure market fear or calm, predicting future volatility risks.
Technical indicators have their strengths and weaknesses. Investors should flexibly select and combine them based on their trading cycle, risk tolerance, and market environment. Applying multiple indicators to Dow Jones index charts helps improve judgment accuracy and reduces the risk of misjudging single signals.
Multi-Indicator Application
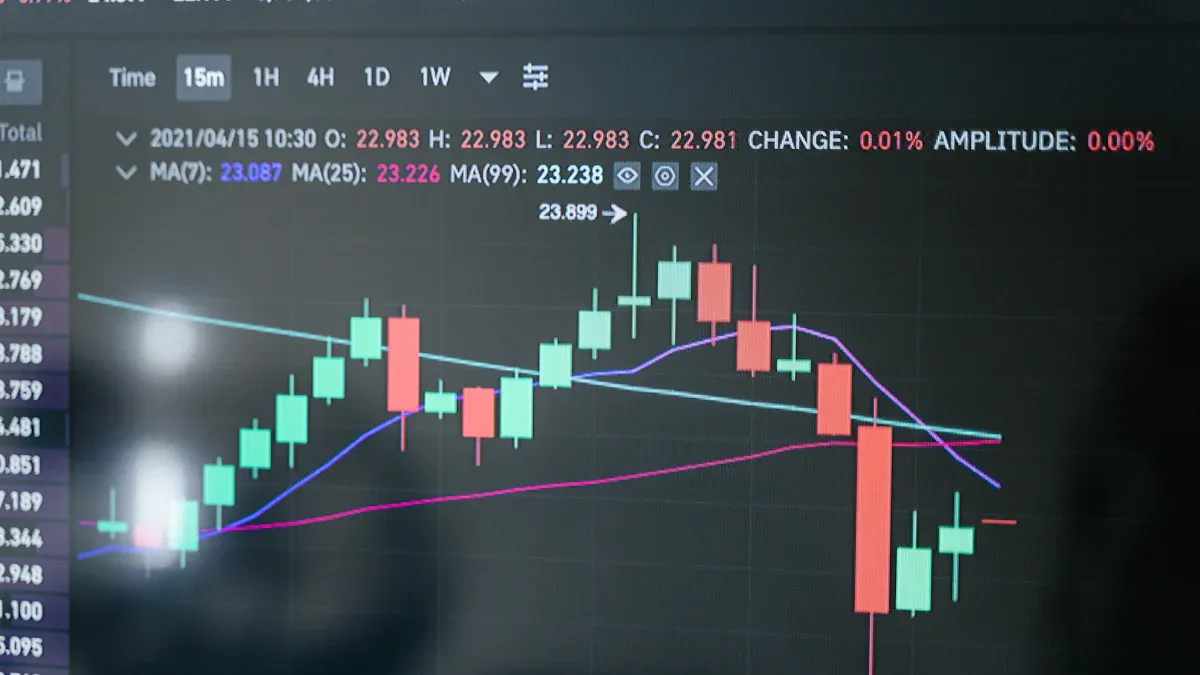
Image Source: pexels
Indicator Combination Strategies
When analyzing Dow Jones index charts, a single technical indicator often fails to fully reflect market conditions. Multi-indicator combination strategies can effectively improve judgment accuracy and reduce misjudgment risks.
Below are the main advantages of multi-indicator combinations:
- Combining trend-following indicators (e.g., moving averages) with oscillator indicators (e.g., RSI, KD) allows simultaneous tracking of trend direction and overbought/oversold signals, compensating for the shortcomings of single indicators.
- Different indicators have varying periods and characteristics, providing multiple perspectives; when one indicator’s signal diverges or fails, others can serve as auxiliary judgment tools.
- Historical data backtesting shows that combination strategies generally outperform single indicators and can be flexibly adjusted based on different trading styles.
- Combination strategies help reduce the costs of chasing highs and selling lows, providing long-term protection for short-term trading and increasing overall profit opportunities.
- Practical drills and fine-tuning of indicator parameters can further optimize combination strategy performance to adapt to market changes.
Technical indicators perform differently across markets and timeframes due to changes in market characteristics and trader structures. Investors can use historical data backtesting to validate combination strategy performance and flexibly adjust indicator parameters based on market conditions to enhance strategy stability and profitability.
Buy and Sell Signal Judgment
Multi-indicator combination strategies not only improve judgment accuracy but also help investors more precisely capture trading opportunities.
Examples include:
- When moving averages form a bullish arrangement, the MACD line crosses above the signal line, and RSI is between 50 and 70, the market is likely in an upward trend, and investors may consider entering positions in batches.
- If the KD indicator shows a golden cross and prices rebound quickly after touching the lower Bollinger Band, this is typically a short-term rebound signal, suitable for short-term trading.
- When the MACD histogram shrinks, RSI exceeds 70, and prices approach the upper Bollinger Band, investors should stay vigilant, consider taking profits in batches, or set take-profit points.
Multi-indicator combinations can effectively filter false signals, reducing the risk of misjudgment from single indicators. Investors should establish clear entry and exit rules based on synchronized signals from multiple indicators and strictly implement risk control.
Different Cycle Applications
Market cycles vary significantly, requiring adjustments to multi-indicator strategies across different periods.
Common application methods include:
- Coincident indicators (e.g., industrial production index, employment data, consumer spending) reflect current economic conditions, helping investors gauge market health.
- Combining leading indicators (e.g., PMI) with lagging indicators provides a comprehensive analysis of potential market changes, improving judgment accuracy.
- Investors can adjust portfolios cyclically based on coincident indicator changes. For example, when industrial production and employment growth slow, reduce exposure to growth stocks and increase defensive stock allocations; conversely, increase growth stock exposure.
- Focus on consumer and cyclical industries, adjusting allocations based on changes in employment, consumer spending, and retail data to seize market demand growth opportunities or avoid risks.
Multi-indicator combination strategies can flexibly adjust investment directions across different market cycles, enhancing Dow Jones index chart interpretation. Investors should continuously monitor economic data and technical indicator changes, regularly reviewing and optimizing investment strategies.
Risks and Limitations
Indicator Lag
Technical indicators are inherently lagging tools and cannot instantly reflect the latest market changes.
- Moving averages (e.g., 144 and 169 Vegas Channel moving averages) are calculated based on past prices, resulting in delayed responses.
- Moving average crossover patterns are common in cycles above one hour and require short-term moving averages for auxiliary judgment.
- Market conditions change approximately every three months, requiring continuous parameter adjustments to avoid misjudgments.
- Technical indicators are only auxiliary tools and cannot be used alone for profit.
Investors should understand that indicator lag can delay trading timing and should combine multiple tools to enhance judgment.
False Signals
Technical analysis often produces false signals, which can mislead investors.
- During backtesting, poor data quality or insufficient sample sizes can affect indicator accuracy.
- Over-optimizing parameters can create a “parameter island” effect, reducing future applicability.
- Divergent signals from single indicators can lead to erroneous operations.
Investors should regularly conduct in-sample and out-of-sample testing, avoid over-reliance on historical data, and select parameter ranges with higher stability.
Unexpected Events
Historical risk events, such as flash crashes or the Covid-19 pandemic, have extreme impacts on technical indicators.
- These events may not repeat, and backtesting should exclude extreme values to avoid misjudgments.
- Technical indicators cannot predict unexpected events and only reflect past market behavior.
Investors should closely monitor global economic and political news, combining fundamental analysis to enhance risk awareness.
Rational Application Suggestions
Technical analysis is an auxiliary decision-making tool and cannot be fully relied upon.
- Indicators based on statistical data can highlight key metrics like moving averages, KD, RSI, and MACD to assist in judging trading opportunities.
- Strategy backtesting can calculate win rate, annualized return, and profit-loss ratio, helping optimize decisions.
- Investors can use platforms like TradingView to validate strategy performance and improve rational judgment.
- It’s recommended to combine fundamental analysis, news, and capital flow analysis to reduce the risk of blind operations.
Technical analysis can enhance Dow Jones index chart interpretation, but rational application and diverse integration are key to long-term stable profits.
Technical analysis can effectively improve investors’ ability to interpret Dow Jones index charts. Professional analysts recommend that investors use various technical indicators rationally and combine them with fundamental and news analysis. Continuous learning and practice are crucial.
- Platform data shows that students analyzing learning behavior charts can identify their shortcomings and proactively adjust learning strategies.
- Teachers using data mining techniques can provide personalized guidance to different students, further enhancing learning outcomes.
Investors who effectively apply these methods will find it easier to grasp market changes and strengthen risk awareness.
FAQ
Is technical analysis suitable for all investors?
Technical analysis is suitable for most investors. Beginners can start with basic indicators, while experienced investors can combine multiple tools. Each investor should choose strategies based on their risk tolerance.
Can technical indicators predict unexpected events?
Technical indicators cannot predict unexpected events. They only reflect past market behavior. Investors should also monitor global economic and political news.
Does using multiple indicators increase judgment difficulty?
Multi-indicator combinations can improve accuracy, but too many indicators may cause confusion. It’s recommended to use 2–3 complementary indicators and regularly review strategy effectiveness.
How does technical analysis differ from fundamental analysis?
Technical analysis focuses on price and volume, while fundamental analysis examines company financials and economic data. Combining both can enhance investment decision quality.
Is technical analysis applicable to investment products offered by Hong Kong banks?
Technical analysis is applicable to U.S. stocks, ETFs, and other products offered by Hong Kong banks. Investors can use technical indicators to assist in judging trading opportunities, improving operational efficiency.
Technical analysis, using tools like moving averages, RSI, and MACD, enhances your ability to interpret Dow Jones Index trends, enabling precise trading decisions for leading US stocks like Apple and Microsoft, but lagging indicators, false signals, and cross-border costs can limit returns—how can you maximize global investment efficiency? BiyaPay offers an all-in-one financial platform, enabling seamless trading of US and Hong Kong stocks without offshore accounts, allowing you to apply technical analysis insights to both the Dow Jones and top Hong Kong enterprises.
Supporting USD, HKD, and 30+ fiat and digital currencies, real-time exchange rate tracking ensures cost transparency, while global remittances to 190+ countries feature transfer fees as low as 0.5%, significantly below traditional bank cross-border costs, with swift delivery to meet global investment needs. A 5.48% annualized yield savings product, with no lock-in period, balances market volatility with steady returns. Sign up for BiyaPay today to combine technical analysis precision with BiyaPay’s worldwide financial solutions, creating a sharp, efficient wealth management experience!
*This article is provided for general information purposes and does not constitute legal, tax or other professional advice from BiyaPay or its subsidiaries and its affiliates, and it is not intended as a substitute for obtaining advice from a financial advisor or any other professional.
We make no representations, warranties or warranties, express or implied, as to the accuracy, completeness or timeliness of the contents of this publication.


Contact Us
Company and Team
BiyaPay Products
Customer Services


is a broker-dealer registered with the U.S. Securities and Exchange Commission (SEC) (No.: 802-127417), member of the Financial Industry Regulatory Authority (FINRA) (CRD: 325027), member of the Securities Investor Protection Corporation (SIPC), and regulated by FINRA and SEC.
registered with the US Financial Crimes Enforcement Network (FinCEN), as a Money Services Business (MSB), registration number: 31000218637349, and regulated by FinCEN.
registered as Financial Service Provider (FSP number: FSP1007221) in New Zealand, and is a member of the Financial Dispute Resolution Scheme, a New Zealand independent dispute resolution service provider.