- EasyCard
- Trade
- Help
- Announcement
- Academy
- SWIFT Code
- Iban Number
- Referral
- Customer Service
- Blog
- Creator
How to Use Free Stock Quote Platforms for Technical Analysis


Image Source: pexels
Do you want to learn technical analysis? Now, you can start by making good use of free stock quote platforms. You can check stock trends and observe market changes at any time without paying. As long as you prepare practical questions, you can follow the steps and experience the analysis process firsthand. When encountering difficulties, remember to practice and operate more, as this will help you master the skills faster.
Key Points
- Free stock quote platforms are diverse, and choosing a platform that suits your needs can improve analysis efficiency.
- Most platforms provide real-time quotes, technical indicators, and charting tools, making technical analysis convenient.
- Registration is simple, and you can quickly check the latest trends and data by searching for stock symbols.
- Using multi-stock comparison and technical indicator functions helps determine buy and sell timings and optimize investment portfolios.
- Technical analysis requires practice and integration with other methods, while noting platform limitations and data delays to improve judgment accuracy.
Free Stock Quote Platforms

Image Source: unsplash
Platform Selection
You can find many free stock quote platforms online. Common options include Google Sheets, TradingView, Yahoo Finance, Ticker, and HSBC InvestExpress App. These platforms allow you to check stock quotes and charts for free. You can choose a platform based on your needs. For example, if you want to check stocks on your phone anytime, the HSBC InvestExpress App is convenient. If you prefer analyzing data on a computer, TradingView and Google Sheets are suitable. You can try several platforms to see which one suits you best.
Tip: You can use multiple free stock quote platforms simultaneously to compare their data and features.
Main Features
Most free stock quote platforms provide real-time or delayed quotes, candlestick charts, technical indicators, and fundamental data. You can find various technical analysis tools on TradingView, such as Moving Averages (MA), MACD, RSI, and Bollinger Bands. Yahoo Finance also offers basic technical indicators and company information. Google Sheets can automatically update stock prices using formulas, making it easy to customize your portfolio. Ticker and HSBC InvestExpress App are suitable for quickly checking Hong Kong and U.S. stock quotes. You can use these features to easily perform technical analysis and manage your investment portfolio.
| Platform Name | Technical Indicators | Multi-Market Quotes | Portfolio Management | Fundamental Data |
|---|---|---|---|---|
| Google Sheets | Basic | Yes | Yes | Yes |
| TradingView | Rich | Yes | Yes | Yes |
| Yahoo Finance | Basic | Yes | Yes | Yes |
| Ticker | Basic | Yes | Yes | Yes |
| HSBC InvestExpress App | Basic | Yes | Yes | Yes |
You can use this table to quickly compare the features of different free stock quote platforms and choose the most suitable tool for yourself.
Technical Analysis Steps
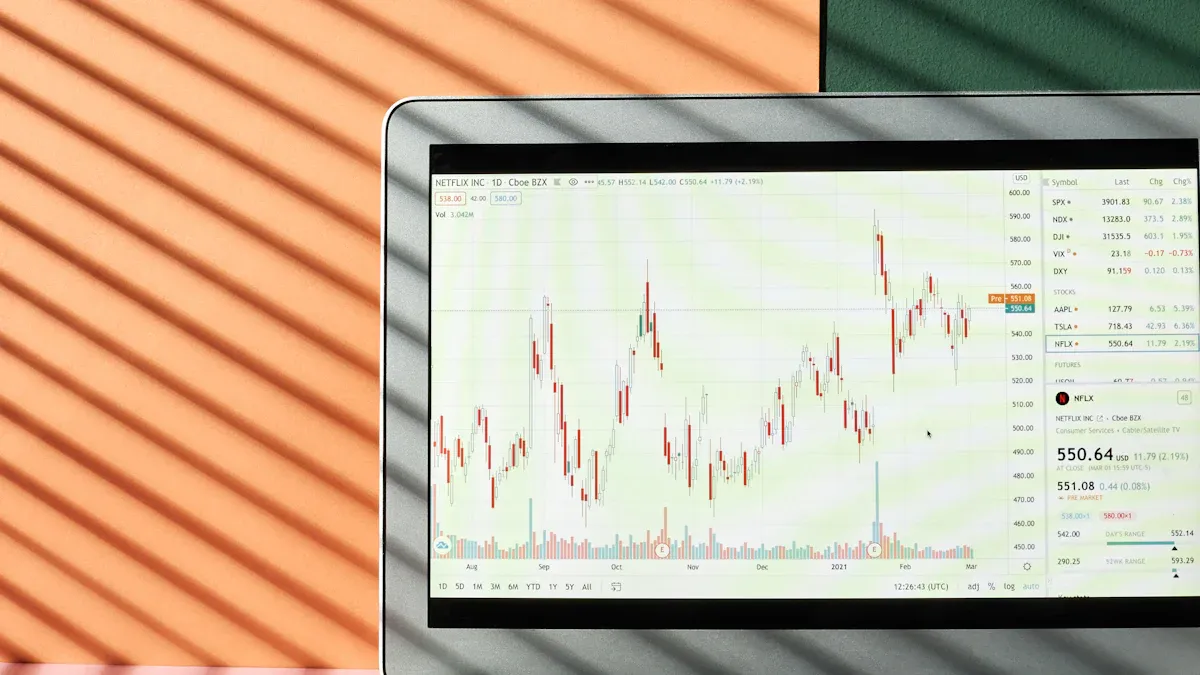
Image Source: pexels
Register and Log In
You first need to register an account on your chosen free stock quote platform. Most platforms, such as TradingView and Yahoo Finance, support email registration, and some also allow direct login with Google or Facebook accounts. You only need to fill in basic information, set a password, and verify your email. The registration process is generally quick and free of charge. After registering, you can log in anytime to start using technical analysis features.
Tip: Some platforms, like Google Sheets, don’t require registration; you can use them directly with a Google account.
Find Quotes
After logging in, you can enter a stock symbol or company name in the search bar to quickly find quotes. Free stock quote platforms typically display real-time or delayed quotes. For example, with TradingView, after entering a stock symbol, the system instantly shows the latest price, trading volume, and percentage change. These platforms respond quickly, reflecting market changes in real time. According to descriptions from multiple platforms, TradingView provides comprehensive and real-time updated data, and its web-based operation requires no software installation, with cross-device synchronization for easy access anytime.
| Performance Metric | Description |
|---|---|
| Fast and Stable | Can display trends instantly during fast market conditions |
| Response Speed | Faster response for product downloads and searches |
| Issue Improvement | Improves opening delays and tick omissions |
You can use these features to stay updated on stock movements and improve analysis efficiency.
Open Charts
After finding the target stock, you can click to access the chart page. Most free stock quote platforms support various chart types, such as candlestick charts and line charts. You can choose different time frames, such as 1-minute, 5-minute, daily, or weekly charts. These charts help you observe price trends and market movements. TradingView and Yahoo Finance offer rich charting tools, allowing you to easily switch between different visual effects.
Note: Charting functions vary slightly across platforms, so you can try multiple platforms to find the charting tool that suits you best.
Add Indicators
You can add technical indicators to charts, such as Moving Averages (MA), MACD, RSI, and Bollinger Bands. These indicators help you determine buy or sell timings. For example, with TradingView, you just click the “Indicators” button, select the desired technical indicator, and the system automatically overlays it on the chart. You can also customize indicator parameters, such as adjusting the number of days for moving averages or the RSI period, to align with your strategy.
Tip: You can add multiple indicators simultaneously to observe signals from different indicators, improving judgment accuracy.
Stock Comparison
You can use the multi-stock comparison function of free stock quote platforms to overlay multiple stocks on the same chart. This feature helps you compare the performance of different stocks and identify better investment targets. According to 30 years of U.S. market data, about 47% of stocks lose money, with only a few performing exceptionally well. By comparing multiple stocks, you can effectively diversify risk and enhance portfolio stability. This function is crucial for assessing stock selection capabilities and investment decision outcomes.
- Multi-stock comparison helps with:
- Diversifying non-systematic risk
- Evaluating the returns and risks of different stocks
- Optimizing portfolio allocation
Annotations and Sharing
You can add annotations to charts to record your analysis ideas. For example, you can mark important support levels, resistance levels, or the timing of specific events. Most free stock quote platforms support saving charts and sharing features. You can save your analysis results to the cloud or share them directly with friends and investment communities. This allows you to review your analysis process anytime and facilitates sharing investment insights with others.
Note: Technical analysis is not 100% accurate. Experts point out that the success rate of technical analysis typically ranges between 20% and 30%, with no clear statistics on error or failure rates. You should practice more, gain experience, and combine other analysis methods to improve your odds.
Tips and Limitations
Platform Limitations
When using free stock quote platforms, you may encounter some common limitations. Most platforms’ quote data have delays, especially for U.S. and Hong Kong stocks, with delays possibly reaching 15 minutes. The number of technical indicators you can add is limited, with some platforms allowing only 2 to 3 indicators at a time. Data length is also restricted, with some platforms providing only the past year’s historical data. You need to note that these limitations can affect the depth and accuracy of your analysis. You can compare multiple platforms to choose the tool that best suits your needs.
Note: Statistical data and charts can sometimes be inaccurate due to sampling bias or insufficient samples. Creators may also exaggerate or downplay trends by cropping tables or altering the vertical axis scale. Be cautious of potential misinterpretations from visualized charts.
Advanced Features
You can make good use of advanced features on free stock quote platforms to improve analysis efficiency. The multi-stock view function allows you to compare the trends of multiple stocks simultaneously, making it easy to identify market strengths and weaknesses. Some platforms support seasonal analysis, helping you identify price patterns for specific months or quarters. The data export function lets you download data to your computer for deeper analysis. Portfolio management features help you track the performance of multiple stocks and optimize capital allocation. According to analysis of 30 years of Nikkei futures and over 200 stocks, short-term trading with a 4-day cycle is optimal, as trends typically continue for 4 days, with direction likely to change after the 5th day. This finding shows that using advanced technical analysis features can help you set more appropriate trading cycles based on trends, improving success rates.
Analysis Tips
When learning technical analysis, you can refer to the following tips:
- Choose stable free stock quote websites, such as StockCharts to reduce misjudgments due to platform instability.
- [Use the correlation between price ranges, closing prices, and trading volume](https://www.books.com.tw/products/0011005195?srsltid=AfmBOoqhSLU5Ofy76868aS_k4hVlAtHeSr-EOYuzNuzXeasYsW конфликты_hmc) to observe market behavior.
- Compare buy and sell operations with returns to analyze the causal relationship between trading volume and price trends.
- Observe resistance conditions during price rises or falls, distinguishing between wide and narrow price bars.
- Pay attention to the shortening phenomenon during price surges or drops, which may signal a trend reversal.
- Monitor tests of high trading volume or vertical zones to judge the direction of price acceleration.
- Practice more, repeatedly observing market reactions after support and resistance lines are breached.
You should remember that there is no 100% accurate method in technical analysis. You should practice more, accumulate experience, and combine other analysis methods. This way, you can gradually improve your judgment and reduce common mistakes.
You have now learned how to use free stock quote platforms for technical analysis. These tools are simple to use and suitable for both beginners and experienced investors. You can start trying them out immediately to observe the trends of different stocks. Continuous practice and learning will make your analysis more accurate. You should choose the most suitable platform based on your needs and make good use of free resources to enhance your investment capabilities.
FAQ
Are free stock quote platforms safe?
Most mainstream platforms like TradingView and Yahoo Finance are from well-known companies. You should avoid entering personal information on unknown websites to ensure account safety.
Does quote delay affect technical analysis?
Delayed quotes have less impact on long-term analysis. If you need real-time trading, choose platforms offering real-time quotes or consider upgrading to a paid version.
Can I analyze multiple stocks simultaneously?
You can use the multi-stock comparison function on platforms like TradingView to overlay multiple stocks on the same chart, making it easy to compare performance.
How should I choose technical indicators?
You can start with commonly used indicators like Moving Averages (MA), MACD, and RSI. Practice more to observe which indicators best suit your strategy.
Are there hidden fees on free platforms?
Most features are free. Some advanced features, such as real-time quotes, more indicators, or historical data, may require paid upgrades. You can try the free version first.
Free stock quote platforms like TradingView and Yahoo Finance offer real-time quotes and technical indicators (e.g., MA, RSI) to analyze leading Hong Kong and US market enterprises, but quote delays and cross-border transaction costs can hinder global investment efficiency—how can you enhance technical analysis applications? BiyaPay provides an all-in-one financial platform, enabling seamless trading of Hong Kong’s financial and tech sectors and US tech growth stocks without offshore accounts, transforming technical analysis insights into global investment opportunities.
Supporting USD, HKD, and 30+ fiat and digital currencies, real-time exchange rate tracking ensures cost transparency, while global remittances to 190+ countries feature transfer fees as low as 0.5%, significantly below the 7.45% average traditional bank costs, with swift delivery to meet global investment needs. A 5.48% annualized yield savings product, with no lock-in period, balances market volatility with steady returns. Sign up for BiyaPay today to integrate free quote platform analytics with BiyaPay’s worldwide financial solutions, creating a precise, efficient wealth management experience!
*This article is provided for general information purposes and does not constitute legal, tax or other professional advice from BiyaPay or its subsidiaries and its affiliates, and it is not intended as a substitute for obtaining advice from a financial advisor or any other professional.
We make no representations, warranties or warranties, express or implied, as to the accuracy, completeness or timeliness of the contents of this publication.


Contact Us
Company and Team
BiyaPay Products
Customer Services


is a broker-dealer registered with the U.S. Securities and Exchange Commission (SEC) (No.: 802-127417), member of the Financial Industry Regulatory Authority (FINRA) (CRD: 325027), member of the Securities Investor Protection Corporation (SIPC), and regulated by FINRA and SEC.
registered with the US Financial Crimes Enforcement Network (FinCEN), as a Money Services Business (MSB), registration number: 31000218637349, and regulated by FinCEN.
registered as Financial Service Provider (FSP number: FSP1007221) in New Zealand, and is a member of the Financial Dispute Resolution Scheme, a New Zealand independent dispute resolution service provider.