- EasyCard
- Trade
- Help
- Announcement
- Academy
- SWIFT Code
- Iban Number
- Referral
- Customer Service
- Blog
- Creator
Why Is There Such a Big Difference Between the Shanghai Index and the CSI 300 Index?


Image Source: pexels
The Shanghai Index and the CSI 300 Index are two important indicators in the Chinese stock market, with the main differences stemming from their constituent stock selection, coverage, and representativeness. The Shanghai Index only includes companies listed on the Shanghai Stock Exchange, while the CSI 300 covers the 300 largest and most liquid companies from both Shanghai and Shenzhen. This selection method leads to significant differences in the market responsiveness and performance of these two Chinese stock market indices. Investors often focus on these differences because the characteristics of the indices directly impact their investment reference value.
Key Points
- The Shanghai Index includes all companies listed on the Shanghai Stock Exchange, with the financial sector accounting for over 60%, resulting in high volatility and significant influence from a single industry.
- The CSI 300 Index covers the 300 largest and most liquid companies from both Shanghai and Shenzhen, with a balanced industry distribution, stronger representativeness, and lower volatility.
- The CSI 300 Index has high-quality constituent stocks with strong liquidity, making it suitable for long-term investors to use as a reference for asset allocation and risk management.
- The two indices differ significantly in market responsiveness and investment reference value, with the CSI 300 better reflecting the overall trends and economic structural changes in the Chinese stock market.
- Investors should choose an index that aligns with their risk tolerance and investment goals, with the CSI 300 suitable for tracking broad market performance and the Shanghai Index suitable for focusing on the Shanghai market or the financial sector.
Index Definitions
Shanghai Index
The Shanghai Index is one of the most historically representative indices in the Chinese stock market. This index includes all A-shares and B-shares listed on the Shanghai Stock Exchange, reflecting the overall performance of the Shanghai market. The Shanghai Index uses a market capitalization-weighted calculation method, where companies with larger market capitalizations have a greater impact on the index. In terms of industry distribution, the financial and insurance sectors account for up to 62.2%, followed by mining and manufacturing. This structure makes the Shanghai Index particularly sensitive to the financial sector during economic cycle changes. The table below shows the industry composition of the Shanghai Index:
| Industry Category | Proportion (%) |
|---|---|
| Finance and Insurance | 62.20 |
| Mining | 14.71 |
| Manufacturing | 10.01 |
| Electricity, Gas, and Water Production and Supply | 3.75 |
| Transportation and Warehousing | 3.29 |
| Information Technology | 2.18 |
| Construction | 2.25 |
| Real Estate | 0.95 |
| Miscellaneous | 0.40 |
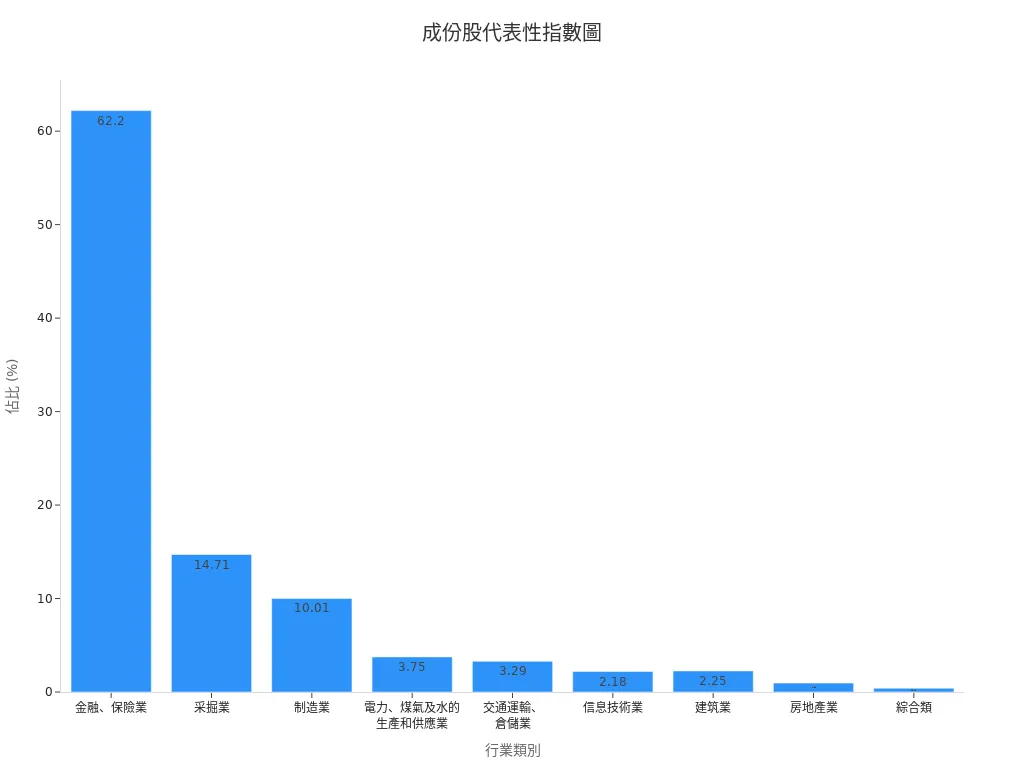
The composition and industry concentration of the Shanghai Index’s constituent stocks make it highly representative in the Chinese stock market, but its performance is also easily influenced by fluctuations in a single industry.
CSI 300 Index
The CSI 300 Index is one of the most closely followed comprehensive indices by professional investors in the Chinese stock market. This index selects the 300 largest and most liquid companies from both Shanghai and Shenzhen, offering broader coverage. The CSI 300 adopts a market capitalization-weighted design with a more balanced industry distribution, including leading companies from multiple sectors. The table below compares the CSI 300 with other major indices in terms of constituent stock numbers, market capitalization distribution, and industry concentration:
| Index Name | Number of Constituents | Market Cap Distribution Characteristics | Industry Concentration | Style Characteristics |
|---|---|---|---|---|
| CSI 300 | 300 | Large market cap with high concentration, covering the largest and most liquid stocks from Shanghai and Shenzhen | Balanced industry distribution, including leading companies from multiple sectors | More growth-oriented mid-cap stocks, with dispersed style |
| SSE 50 | 50 | Large market cap, high liquidity, mainly large-cap blue-chip stocks | Highly concentrated in the financial sector (non-bank financials, banks) | Low valuation, high profitability, average market turnover |
| CSI 500 | 500 | Lower market cap focus, 70% of constituents have market caps over 10 billion | Even industry distribution, no single industry exceeding 10% weight | Strong growth characteristics, high and dispersed valuations |
The design of the CSI 300 Index allows it to more comprehensively reflect the overall trends of the Chinese stock market and reduce the impact of a single industry. This balanced distribution helps investors more accurately assess market risks and opportunities.
Constituent Stock Comparison

Image Source: unsplash
Coverage
The Shanghai Index’s constituent stocks include only all A-shares and B-shares listed on the Shanghai Stock Exchange. This index reflects the overall performance of the Shanghai market. The CSI 300 Index selects the 300 largest and most liquid companies from both Shanghai and Shenzhen. This design gives the CSI 300 Index broader coverage, capable of reflecting trends in both markets.
- Shanghai Index: Covers only companies listed on the Shanghai Stock Exchange.
- CSI 300 Index: Covers leading companies from both Shanghai and Shenzhen.
The table below compares their coverage:
| Index Name | Coverage | Listing Location |
|---|---|---|
| Shanghai Index | All A-shares and B-shares on the Shanghai Stock Exchange | Shanghai |
| CSI 300 Index | 300 largest and most liquid companies from Shanghai and Shenzhen | Shanghai, Shenzhen |
The design of the CSI 300 Index makes it more representative of the overall development trends of the Chinese stock market. Investors looking to observe national market trends will find the CSI 300 Index a more suitable reference.
Quality and Liquidity
The quality and liquidity of constituent stocks directly affect the stability and investment value of an index. The Shanghai Index includes all listed companies, many of which have smaller market capitalizations and lower liquidity. These companies may have varying operational conditions, with some having limited trading volumes, making them prone to significant price fluctuations.
The CSI 300 Index strictly selects the 300 largest and most liquid companies. These companies are typically industry leaders with strong operational capabilities and stable financial conditions. Highly liquid stocks have active trading volumes and smaller bid-ask spreads, making it easier for investors to enter and exit the market.
- Shanghai Index: Includes many small and mid-sized companies, some with insufficient liquidity.
- CSI 300 Index: Constituents are mostly large enterprises with high liquidity and better quality.
For example, the CSI 300 Index includes well-known companies like Ping An Insurance, Kweichow Moutai, and China Merchants Bank. These companies have large market capitalizations, with daily trading volumes in the billions of USD (based on the June 2024 exchange rate of approximately 1 USD to 7.2 CNY), far exceeding the trading activity of typical small and mid-sized stocks. In contrast, some small and mid-sized companies in the Shanghai Index have daily trading volumes below 1 million USD, indicating significantly lower liquidity.
Professional investors generally believe that the quality and liquidity of the CSI 300 Index’s constituent stocks better meet the needs of asset allocation and risk management. This is particularly important for long-term investors seeking stable returns.
Industry Distribution
Financial Sector Weight
The Shanghai Index has an extremely high weighting in the financial sector. The finance and insurance industries account for over 60% of the Shanghai Index. This structure makes the index’s performance heavily dependent on fluctuations in the financial industry. When significant changes occur in the Chinese financial market, the Shanghai Index quickly reflects the associated risks. The CSI 300 Index adopts a more balanced industry allocation. While the finance and insurance sectors remain important in the CSI 300, their weighting is significantly lower. This design helps diversify single-industry risks and enhances the index’s stability.
A global industry strength report indicates that the finance and information technology sectors lead in market capitalization, while the industrial sector leads in revenue. This reflects the need to consider the relative importance of each industry in the economy when designing an index. The CSI 300 Index follows this principle, keeping the financial sector’s weighting within a reasonable range to avoid excessive concentration.
Other Industry Distribution
The CSI 300 Index has a more diverse industry distribution. In addition to finance and insurance, it covers manufacturing, wholesale and retail, information technology, and other sectors. According to the latest data, wholesale and retail account for over 40% in some indices, manufacturing accounts for about 12%, and other industries collectively account for about 30%. This distribution helps the index more comprehensively reflect the economic structure, reducing the impact of a single industry on overall performance.
| Industry Category | Sales Proportion (%) |
|---|---|
| Wholesale and Retail | 41.11 |
| Finance and Insurance | 15.35 |
| Manufacturing | 12.54 |
| Other Industries | 31.00 |
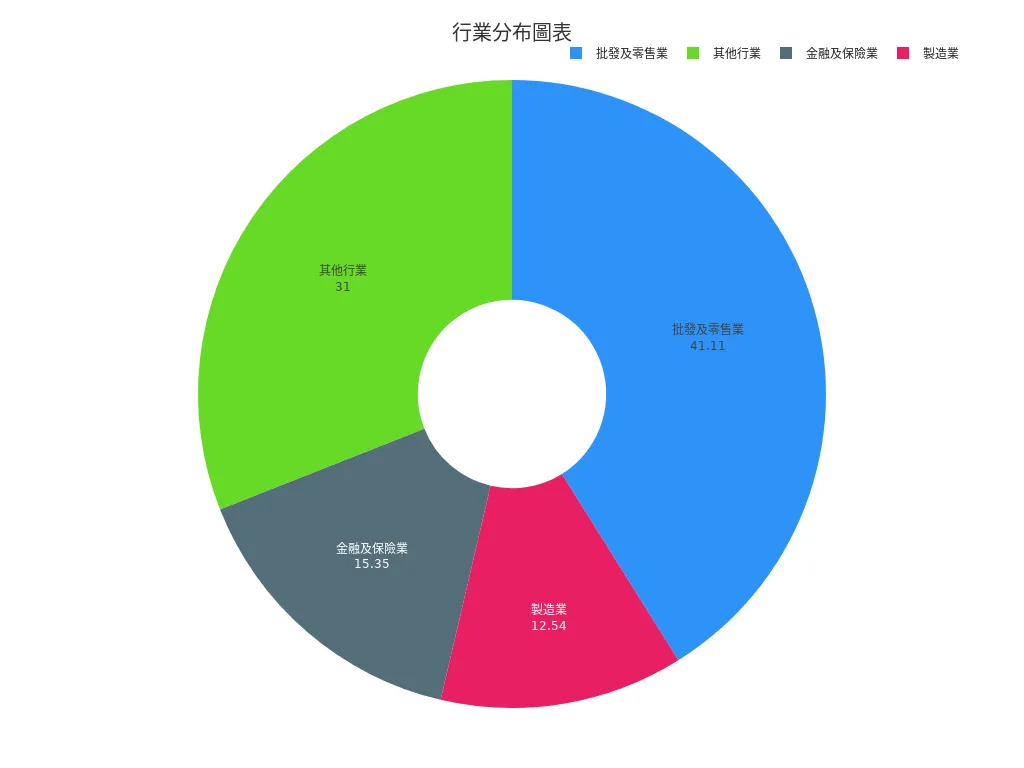
Equity products hold a core position in global active ETFs, with an asset scale of 57.6%. This reflects the market’s preference for equity industries and highlights the importance of weighting key industries in index design. The diverse industry distribution of the CSI 300 Index enables it to better represent the multifaceted development of the Chinese economy and helps investors diversify risks.
Representativeness of Chinese Stock Market Indices
Market Responsiveness
The Shanghai Index and the CSI 300 Index differ significantly in their representativeness within the Chinese stock market. The Shanghai Index only covers companies listed on the Shanghai Stock Exchange, reflecting the overall trends of the Shanghai market. This index is heavily influenced by a single market and industry, particularly the financial sector. When the financial industry experiences fluctuations, the Shanghai Index quickly reflects these changes.
The CSI 300 Index covers A-shares from both Shanghai and Shenzhen, selecting the 300 largest and most liquid companies. This design allows the CSI 300 Index to more comprehensively reflect the overall trends of the Chinese stock market. The CSI 300’s constituent stocks come from multiple industries, including manufacturing, information technology “‘’’, and consumer goods, with a balanced distribution. This reduces the impact of a single industry on the index, enhancing its market responsiveness.
Professional investors generally believe that the CSI 300 Index better represents the overall economic development of China. When structural changes occur in the Chinese economy, the CSI 300 Index can promptly reflect market trends, helping investors grasp the broader market direction.
The table below briefly compares the market responsiveness of the two indices:
| Index Name | Coverage | Industry Distribution | Market Responsiveness |
|---|---|---|---|
| Shanghai Index | Shanghai A-shares, B-shares | Concentrated | Moderate |
| CSI 300 Index | Shanghai and Shenzhen A-shares | Balanced | Strong |
Investment Reference Value
When choosing a Chinese stock market index as a reference, investors consider the index’s representativeness and practicality. Although the Shanghai Index has a long history, the varying quality of its constituent stocks, with some having smaller market capitalizations and insufficient liquidity, leads to higher volatility. This makes it difficult for investors to rely solely on the Shanghai Index to judge overall market trends.
The CSI 300 Index has high-quality constituent stocks, strong liquidity, and a diverse industry distribution. This index is often used by fund companies as a performance benchmark, becoming an important standard for measuring the performance of the Chinese stock market. Many ETFs and index funds tracking the Chinese stock market use the CSI 300 as their target, facilitating asset allocation and risk management for investors.
The high representativeness and stability of the CSI 300 Index make it the preferred reference for professional investors and institutional funds. For investors seeking an accurate reference for the overall performance of the Chinese stock market, the CSI 300 Index is a more suitable choice.
In summary, the CSI 300 Index has stronger market responsiveness and investment reference value among Chinese stock market indices. This is particularly important for investors who need to track China’s economic development and engage in long-term investments.
Historical Performance

Image Source: pexels
Volatility
The Shanghai Index and the CSI 300 Index differ significantly in terms of volatility. The Shanghai Index, due to its broad coverage of constituent stocks, including many small and mid-sized companies, exhibits higher volatility. The CSI 300 Index, which selects the 300 largest and most liquid companies, has relatively lower volatility. Investors typically refer to the following metrics to compare the long-term returns and risks of the two indices:
- Strategy Performance Curve: These charts clearly show the performance of the two indices over different periods, allowing investors to compare long-term positive performance at a glance.
- Average Profit per Trade: After deducting transaction costs and slippage, this metric reflects actual profitability. The CSI 300 Index, due to its high liquidity, has more stable average profits.
- Annual Return Performance: Annual fluctuations help observe the stability of an index. The Shanghai Index experiences larger swings in certain years, while the CSI 300 is relatively stable.
- Maximum Drawdown (MDD): This metric measures the maximum loss of an index under extreme market conditions. The CSI 300 Index typically has a smaller maximum drawdown, indicating higher risk tolerance.
Investors should select historical data covering bull markets, bear markets, and consolidation periods to comprehensively assess an index’s volatility and risks.
Economic Cycle Correlation
The two indices also respond differently to economic cycles. The Shanghai Index, due to its high weighting in the financial sector, experiences more pronounced fluctuations when the Chinese economy enters expansion or contraction phases. The CSI 300 Index, with its balanced industry distribution, can more comprehensively reflect economic structural changes. When manufacturing, technology, or consumer sectors perform strongly, the CSI 300 Index can promptly reflect the growth momentum of these industries.
Investors have found that the CSI 300 Index performs better during economic recovery periods because leading companies from multiple industries drive overall returns. During economic downturns, the CSI 300’s risk diversification characteristics help mitigate the drag from a single industry. This design makes the CSI 300 an important reference for tracking changes in the Chinese economic cycle.
Investment Applications
Market Barometer
Chinese stock market indices are often regarded as market barometers. These indicators reflect overall market trends, helping investors judge bullish or bearish turning points. According to Dow Theory, market barometers have proven their predictive ability through long-term historical data.
- From 1900 to 1923, U.S. stock market cycle data showed that indices can systematically record price trend patterns.
- Primary trends, secondary reactions, and daily fluctuations in the stock market are likened to tides, waves, and ripples, reflecting the multi-layered movements of the market.
- The combination of trading volume and trends, cross-verification between indices, and the sustained validity before trend reversals have been repeatedly tested in over a century of bull and bear markets, demonstrating high predictive reliability.
- Market barometers are not subject to long-term distortion by national policies or markets, making them applicable to global markets, including Chinese stock market indices.
- Using objective price indices as a basis for judgment helps investors avoid emotional influences and improve decision-making accuracy.
Long-term historical validation proves that market barometers are valuable in judging bullish or bearish turning points. Investors can use Chinese stock market indices as a reference for market sentiment and trends.
Index Fund Selection
When choosing index funds, investors should make decisions based on their strategies and risk tolerance.
- Macroeconomic analysis helps assess market trends and risks, suitable for long-term asset allocation.
- Individual company financial analysis can determine the value of specific assets, suitable for active investors.
- Industry analysis can reveal structural changes in industries, affecting constituent stock performance.
- Index constituent selection methods (e.g., market cap weighting) perform strongly in bullish markets but react more slowly during reversals.
- Momentum trading factor models, based on stock price strength rankings, have annualized performance influenced by market conditions, reflecting differences in factor performance across periods.
- Tracking market data such as market cap, price, and momentum helps quantify asset selection criteria and understand performance differences.
For example, conservative investors may choose index funds tracking the CSI 300 due to its high-quality constituent stocks and strong liquidity. Aggressive investors may consider combining industry analysis with momentum strategies to flexibly adjust their portfolios. The application differences in real investment scenarios reflect the diverse investment value of Chinese stock market indices.
In summary, the biggest differences between the Shanghai Index and the CSI 300 Index lie in their constituent stock scope, market capitalization concentration, and representativeness.
- The CSI 300 Index focuses on the largest and most liquid 300 companies, offering strong representativeness and lower volatility.
- The Shanghai Index covers more small and mid-sized companies, with higher volatility and fewer dividends. Investors should choose the index that best suits their investment goals and risk tolerance.
FAQ
What is the biggest difference between the Shanghai Index and the CSI 300 Index?
The Shanghai Index only includes companies listed in Shanghai, while the CSI 300 covers the 300 largest and most liquid companies from both Shanghai and Shenzhen, offering stronger representativeness.
What are the benefits of investing in CSI 300 index funds?
CSI 300 index funds have high-quality constituent stocks with strong liquidity. Investors can more easily diversify risks and track the overall performance of the Chinese stock market.
What type of investors is the Shanghai Index suitable for?
The Shanghai Index is suitable for investors focusing on the Shanghai market or favoring the financial sector. Some long-term investors use it to observe single-market trends.
Why is the CSI 300 Index often used as a fund performance benchmark?
The CSI 300 Index represents the Chinese stock market’s large-cap segment with high-quality constituent stocks. Fund companies commonly use it as a standard to measure fund performance.
How do the volatility levels of the two indices differ?
The CSI 300 Index has lower volatility because its constituents are mostly large enterprises. The Shanghai Index has higher volatility, significantly influenced by small and mid-sized companies.
The Shanghai and CSI 300 Indices differ in components and sectors, impacting investment strategies, with exchange rates and quote monitoring adding complexity. BiyaPay offers a seamless solution, enabling US and Hong Kong stock investments without extra overseas accounts, indirectly tracking CSI 300 assets—start now at BiyaPay! With transfer fees as low as 0.5% and coverage across 190+ countries, it meets global funding needs. Real-time exchange rate queries help you stay on top, streamlining index quote monitoring.
Its 5.48% annualized yield wealth product offers flexible withdrawals to navigate volatility. Regulated internationally, it ensures secure transactions. Visit BiyaPay today to enhance your investment strategy!
*This article is provided for general information purposes and does not constitute legal, tax or other professional advice from BiyaPay or its subsidiaries and its affiliates, and it is not intended as a substitute for obtaining advice from a financial advisor or any other professional.
We make no representations, warranties or warranties, express or implied, as to the accuracy, completeness or timeliness of the contents of this publication.


Contact Us
Company and Team
BiyaPay Products
Customer Services


is a broker-dealer registered with the U.S. Securities and Exchange Commission (SEC) (No.: 802-127417), member of the Financial Industry Regulatory Authority (FINRA) (CRD: 325027), member of the Securities Investor Protection Corporation (SIPC), and regulated by FINRA and SEC.
registered with the US Financial Crimes Enforcement Network (FinCEN), as a Money Services Business (MSB), registration number: 31000218637349, and regulated by FinCEN.
registered as Financial Service Provider (FSP number: FSP1007221) in New Zealand, and is a member of the Financial Dispute Resolution Scheme, a New Zealand independent dispute resolution service provider.